ING’s Chris Turner notes Sterling is softening after UK local elections, as Labour’s losses fuel talk of a leadership contest and a leftward policy shift. He highlights the risk of developments around Manchester Mayor Andy Burnham re-entering parliament. Turner says markets will focus on Prime Minister Keir Starmer’s policy speech and expects EUR/GBP to revisit the overnight high at 0.8675.
Sterling pressured by Labour uncertainty
“Sterling is softening a little as markets digest the fall-out from local UK elections held late last week. While Labour losses were not quite as bad as feared, they have failed to quell speculation over a Labour leadership contest and a clear leftward drift in government policy.”
“Manchester Mayor Andy Burnham remains waiting in the wings and the markets will react to any news such as Burnham resigning as mayor or a sitting Labour MP resigning to make way for Burnham’s return to parliament.”
“The key focus this morning will be a policy speech from PM Keir Starmer on how he plans to address Labour’s falling popularity and take the party into the next election. The wild card here is how far he intends to embrace a return to Europe, whether that be rejoining the customs union or more controversially, the single market. “
“It will be tough for Starmer to win over his critics, and we suspect EUR/GBP finds its way back to the overnight high at 0.8675.”
The political crisis surrounding Keir Starmer has become one of the key market drivers for the pound today. The situation is evolving rapidly and is having a direct impact on government bond yields and the value of the pound, with the markets closely monitoring the Prime Minister’s every word. Internal party pressure The scale of Starmer’s problem is best illustrated by a single figure: 42 Labour MPs had already officially called on him to resign by Sunday evening, whilst former Deputy Prime Minister Angela Rayner described the current situation as “Labour’s last chance” to change course.
The emergence of potential challengers, such as Wes Streeting and Andy Burnham, means that the market now views the internal dispute within the Labour Party as a real risk, rather than mere political noise. In his speech on Monday, Starmer focused on several key themes. Firstly, a firm defence of his own position: “I will fight in every internal vote.” Secondly, a political agenda aimed at closer ties with the EU, the nationalisation of British Steel and a new mobility agreement for young people with Europe. The market viewed this speech primarily through the prism of one question: will the Prime Minister stabilise his position sufficiently to halt the sell-off of gilts?
You can watch the UK Prime Minister’s live address here. Source: Sky News, YouTube
Starmer, gilts in pounds
The yield on 10-year gilts rose on Monday morning to 4.954%, an increase of 3 basis points from the previous close, when it stood at 4.904% immediately after Starmer refused to resign on Friday. Economists surveyed by Bloomberg say that were it not for the political component, yields would be 10–15 basis points lower. This shows just how much the market has already begun to price in the risk of political instability, rather than solely macroeconomic fundamentals. The UK currently has the highest debt servicing costs of all G7 countries, a consequence of inflation remaining above target and weak economic growth. The situation is further complicated by the economic fallout from the armed conflict in Iran, which has led to higher energy prices and a further weakening of business activity. In such an environment, any political uncertainty acts as a risk multiplier for funds holding gilts.
Implications for the GBP
The pound finds itself in a difficult position, both technically and fundamentally. On the one hand, structural factors such as the Bank of England’s relatively high interest rates compared to the ECB and the marked inflationary divergence from the rest of Europe may continue to support it in the medium term. On the other hand, the political risk premium, which has just begun to be priced into gilt yields, is a factor that directly affects the currency’s valuation: higher bond yields against a backdrop of a weakening government is a scenario that has historically been negative for the pound, as it suggests a lack of a fiscal anchor. If Starmer survives the coming weeks politically and manages to quell the internal rebellion, the risk premium should gradually decline, and the GBP/USD pair could test higher resistance levels once again. An alternative scenario, namely a genuine battle for party leadership, would, however, mean further rises in gilt yields and pressure on the pound, particularly as global markets are now highly sensitive to any signs of political fiscal instability following the experiences of the Truss era. For sterling traders, therefore, today is a test not so much of Starmer himself as of the resilience of the political risk premium that the market has already priced in.
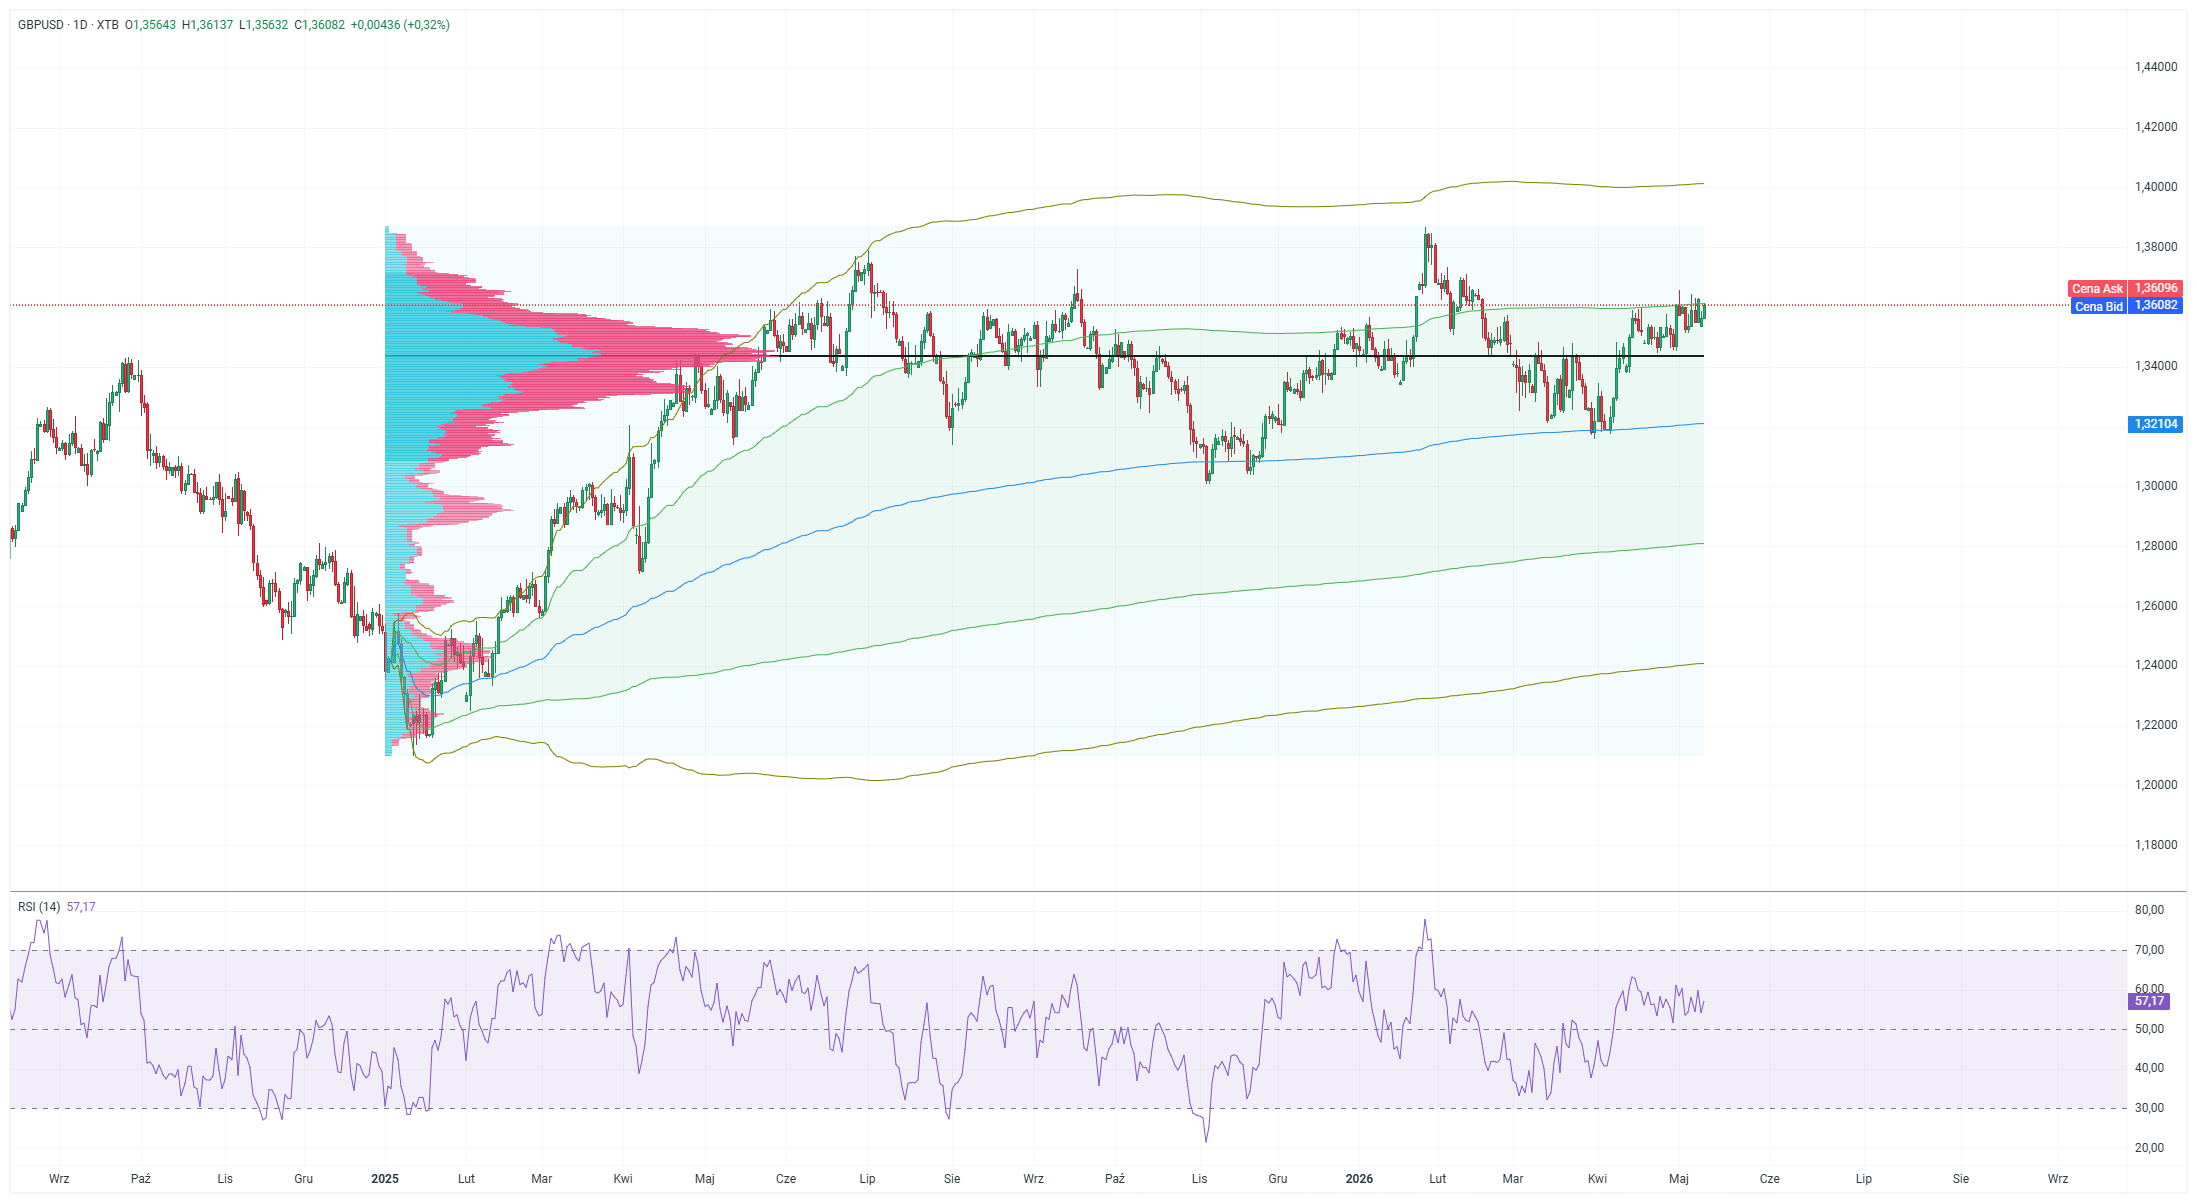
GBP/USD is trading at 1.3608 on the daily chart, within an uptrend that has been in place since the low around 1.22 at the turn of 2024/2025, and the price remains above the anchored VWAP from early 2025, which runs in the 1.31–1.32 region. The volume profile indicates a Point of Control in the 1.3450–1.3480 zone, where a black horizontal line marks a key support level that has been tested repeatedly on both sides. The RSI(14) at 57.17 suggests neutral-bullish momentum with no signs of overbought conditions, which technically leaves room for further gains towards the 1.3800–1.3850 resistance zone, where the price reversed at the 2025 peak.
Today’s speech by Starmer and his political survival are factors that will directly determine the short-term direction: government stability paves the way upwards, whilst an escalation of the crisis and a rise in gilt yields would push the pair back towards the POC zone at 1.3450, and, in the event of a deeper sell-off, even towards the VWAP. Technically, the bulls have the upper hand as long as the price remains above 1.34, and the bears will only regain the initiative after a break below this zone with volume. Source: xStation
GBP/USD attracts fresh buyers following a modest bearish gap down opening to mid-1.3500s.
Easing UK political risks and the BoE’s hawkish signal underpin the GBP, supporting spot prices.
Iran tensions and reviving Fed rate hike bets benefit the safe-haven USD and might cap the pair.
The GBP/USD pair fills a major part of its weekly bearish gap opening on Monday and is now looking to extend the momentum further beyond the 1.3600 mark. Spot prices, however, remain below the 1.3635 horizontal resistance and the highest level since February 16, touched earlier this month, warranting caution for bullish traders amid a modest US Dollar (USD) strength.
Against the backdrop of renewed hostilities in the Strait of Hormuz, disagreements over Tehran’s nuclear program dampen bets for a US-Iran peace deal. US President Donald Trump and Iran both rejected each other’s peace proposals for ending the war and the gradual reopening of the Strait of Hormuz. This keeps geopolitical risks in play, which, along with hawkish US Federal Reserve (Fed) expectations, turn out to be key factors underpinning the safe-haven USD.
The US-Iran standoff triggers a fresh leg up in Crude Oil prices, fueling inflationary concerns and keeping hopes alive for at least one 25-basis-point (bps) rate hike by the US central bank in 2026. In fact, the CME Group’s FedWatch Tool indicates a nearly 20% chance that the Fed will raise borrowing costs by the end of this year. That said, easing UK political uncertainty underpins the British Pound (GBP) and might continue to act as a tailwind for the GBP/USD pair.
In fact, UK Prime Minister Keir Starmer said he would not resign after local election results in Britain confirmed expectations of significant losses for the ruling Labour Party. Furthermore, the Bank of England’s (BoE) signal last week that rate hikes could be appropriate if inflation remains persistent turns out to be another factor lending some support to the GBP and contributes to the GBP/USD pair’s goodish intraday move up from the 1.3550 horizontal support zone.
The BoE’s MPC member Megan Greene said earlier today that the central bank needs to wait to see how Middle East conflicts will flare before making any monetary policy adjustments, and that Inflation risks are skewed entirely to the upside. This, in turn, backs the case for a further appreciating move for the GBP/USD pair, though traders might opt to wait for the release of the latest US consumer inflation figures on Tuesday and the Trump-Xi summit later this week.
EUR/GBP loses ground to near 0.8650 in Friday’s early European session.
German Industrial Production falls 0.7% MoM in March, weaker than expected.
BoE’s Bailey warned of “forceful tightening” if energy price shocks from the Middle East conflict continue to drive inflation.
The EUR/GBP cross holds losses around 0.8650 during the early European session on Friday. The Euro (EUR) softens against the Pound Sterling (GBP) on the downbeat German economic data. Traders brace for the speeches from the European Central Bank policymakers later on Friday, including Christine Lagarde, Luis de Guindos, Piero Cipollone, Isabel Schnabel , and Joachim Nagel.
Data released by Destatis on Friday revealed that Germany’s industrial sector activity fell sharply in March, with Industrial Production falling by 0.7% MoM, versus a decline of 0.5% prior (revised from -0.3%). This figure came in weaker than the expectation of a 0.5% rise.
Annually, German Industrial Production arrived at -2.8% in March, following February’s revised 0.2% decrease. The Euro edges slightly lower against the GBP in an immediate reaction to the worse-than-expected German report.
Hawkish remarks from the ECB officials might help limit the EUR’s losses. ECB Executive Board member Isabel Schnabel bolstered expectations that the bank could raise interest rates as soon as next month, saying companies and households were now reacting in a concerning way to surging global energy prices.
Meanwhile, ECB board member Piero Cipollone noted on Wednesday that the chance of a central bank rate hike has risen as inflation pressures are high, even as negotiated wage data showed pay demands had yet to increase.
On the UK’s front, the Bank of England (BoE) decided to hold the bank rate steady at 3.75% as widely expected at the last meeting, presenting a scenario framework that suggests rate hikes could be appropriate but avoiding any pre-commitment. BoE Governor Andrew Bailey warned of “forceful tightening” if energy price shocks from the Middle East conflict continue to drive inflation.
GBP/USD gains positive traction for the second straight day amid a broadly weaker USD.
Hopes for a US-Iran peace deal and fading hawkish Fed bets exert pressure on the buck.
BoE rate hike expectations act as a tailwind for the GBP and further support spot prices.
The GBP/USD pair attracts buyers for the second consecutive day on Wednesday and moves away from the weekly low, around the 1.3515-1.3510 area, which was touched the previous day. The optimism over a potential US-Iran peace deal undermines the safe-haven US Dollar (USD) and lifts spot prices to the 1.3580 region during the Asian session.
US President Donald Trump said that ‘Project Freedom’ – aimed at restoring commercial shipping traffic through the Strait of Hormuz – will be paused for a short period of time to see if the Iran peace deal can be finalised. This comes hours after US Defense Secretary Pete Hegseth said that the US-Iran ceasefire holds for now and that the US was not seeking to re-escalate tensions with Tehran. The comments lift hopes for a quick resolution of the US-Iran conflict and boost investors’ confidence, prompting some selling around the USD and providing a goodish lift to the GBP/USD pair.
Meanwhile, the latest developments trigger a fresh leg down in Crude Oil prices, which helps ease inflationary concerns and tempers market expectations for a more hawkish US Federal Reserve (Fed). The outlook turns out to be another factor weighing on the Greenback. The British Pound (GBP), on the other hand, draws support from the Bank of England’s (BoE) signal that rate hikes could be appropriate if inflation remains persistent. This further contributes to the GBP/USD pair follow-through move higher and backs the case for a further near-term appreciating move.
Moving ahead, the US ADP report on private-sector employment, along with speeches by influential FOMC members, could provide some impetus later during the early North American session. The key focus, however, will be on the closely-watched US Nonfarm Payrolls (NFP) report on Friday. Apart from this, the incoming geopolitical headlines might continue to infuse volatility across the global financial markets, which will drive the USD and the GBP/USD pair. Nevertheless, the fundamental backdrop suggests that the path of least resistance for spot prices is to the upside.
US Dollar Price Today
The table below shows the percentage change of US Dollar (USD) against listed major currencies today. US Dollar was the strongest against the Canadian Dollar.
USD
EUR
GBP
JPY
CAD
AUD
NZD
CHF
USD
-0.24%
-0.26%
-0.16%
-0.14%
-0.57%
-0.60%
-0.25%
EUR
0.24%
-0.03%
0.09%
0.10%
-0.32%
-0.39%
-0.01%
GBP
0.26%
0.03%
0.11%
0.13%
-0.29%
-0.35%
0.04%
JPY
0.16%
-0.09%
-0.11%
0.00%
-0.43%
-0.47%
-0.06%
CAD
0.14%
-0.10%
-0.13%
-0.00%
-0.42%
-0.46%
-0.08%
AUD
0.57%
0.32%
0.29%
0.43%
0.42%
-0.03%
0.34%
NZD
0.60%
0.39%
0.35%
0.47%
0.46%
0.03%
0.38%
CHF
0.25%
0.00%
-0.04%
0.06%
0.08%
-0.34%
-0.38%
The heat map shows percentage changes of major currencies against each other. The base currency is picked from the left column, while the quote currency is picked from the top row. For example, if you pick the US Dollar from the left column and move along the horizontal line to the Japanese Yen, the percentage change displayed in the box will represent USD (base)/JPY (quote).
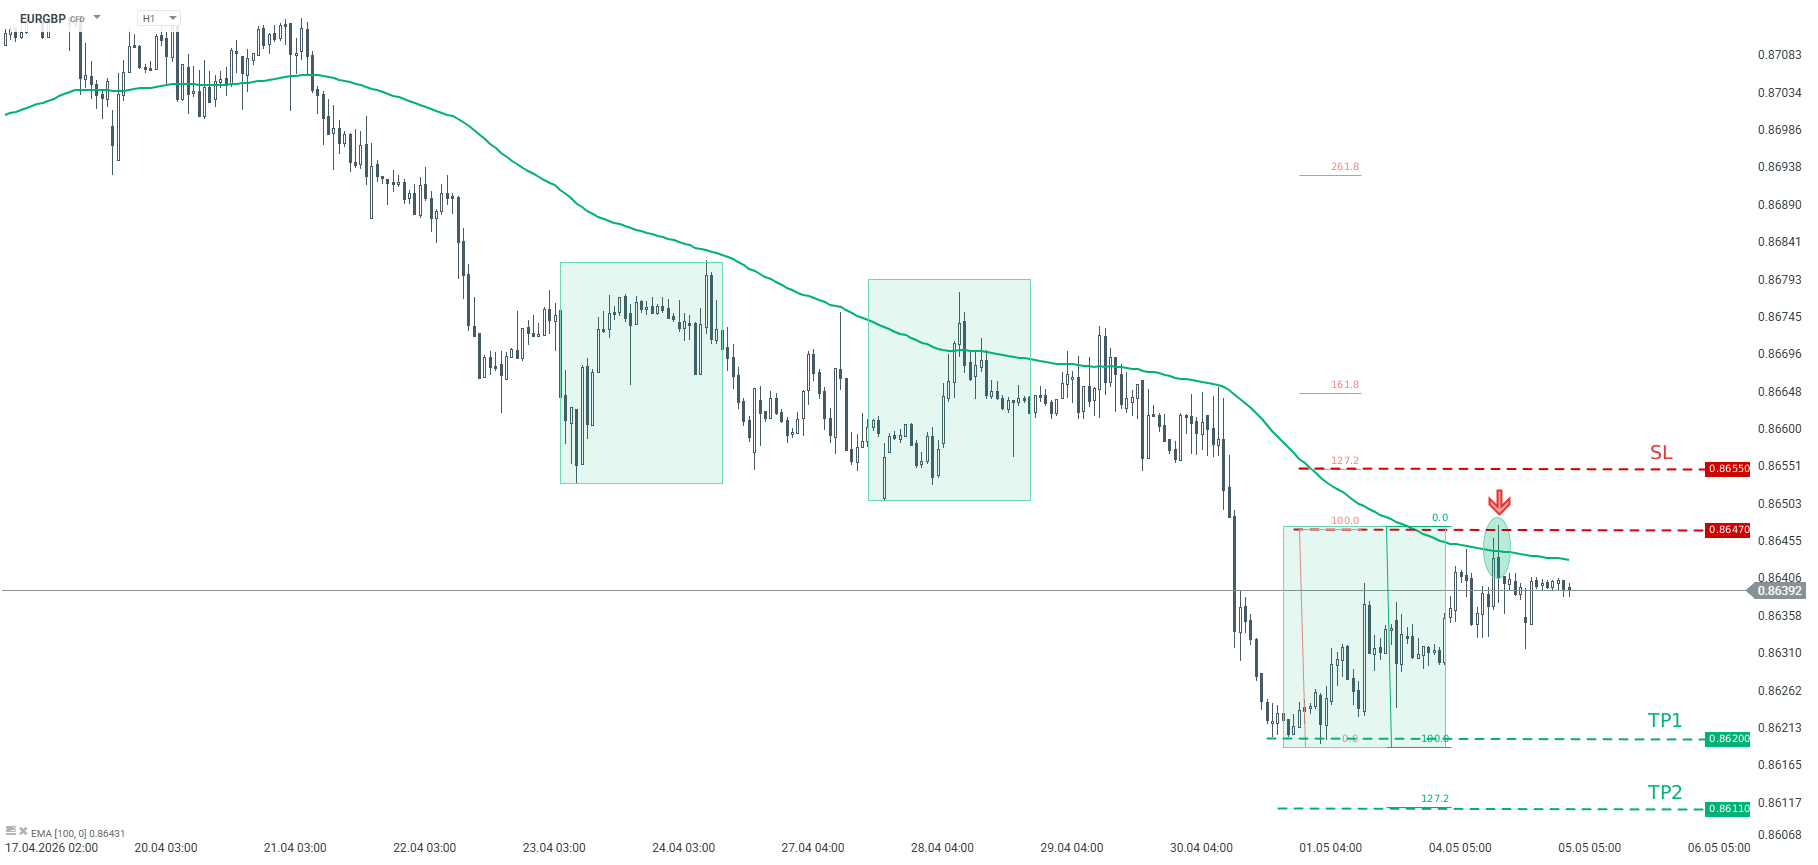
Facts: EURGBP bounced off the 1:1 structure at 0.8647 The pair is trading below the 100-period exponential moving average foram H1 interval Recommendation: Trade: Short position on EURGBP at market price Target: 0.8620, 0.8611 Stop Loss: 0.8655
Opinion: EURGBP has been trading in a downward trend recently. Taking a look at the H1 internal, we can see that the pair bounced off the key resistance, signaling a potential bearish trend resumption. The resistance at 0.8647 is marked with the upper limit of 1:1 structure. In addition the price sits below the 100- period moving average. According to the Overbalance strategy, as long as the price sits below the 0.8647 resistance, one should expect the price to continue to fall. Taking this into account, we recommend going short EURGBP at market price with two targets: 0.8620 and 0.8611. We also recommend placing a stop loss at 0.8655. Source: xStation5
What is the technical outlook for AUD/CAD, GBP/USD and AUD/USD?
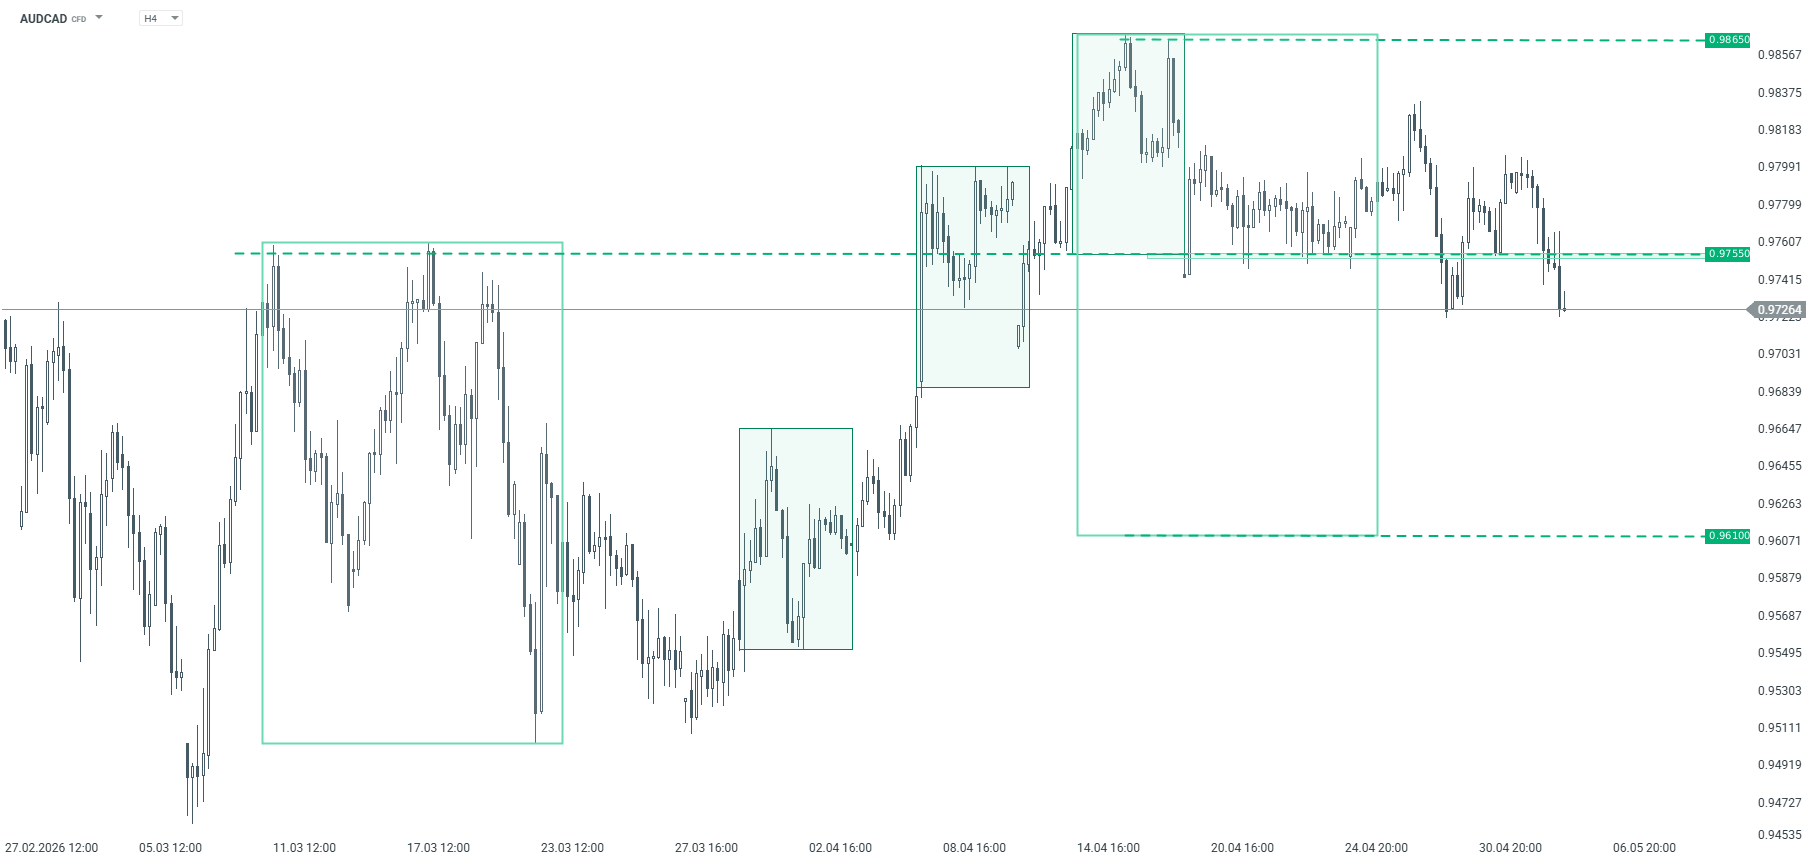
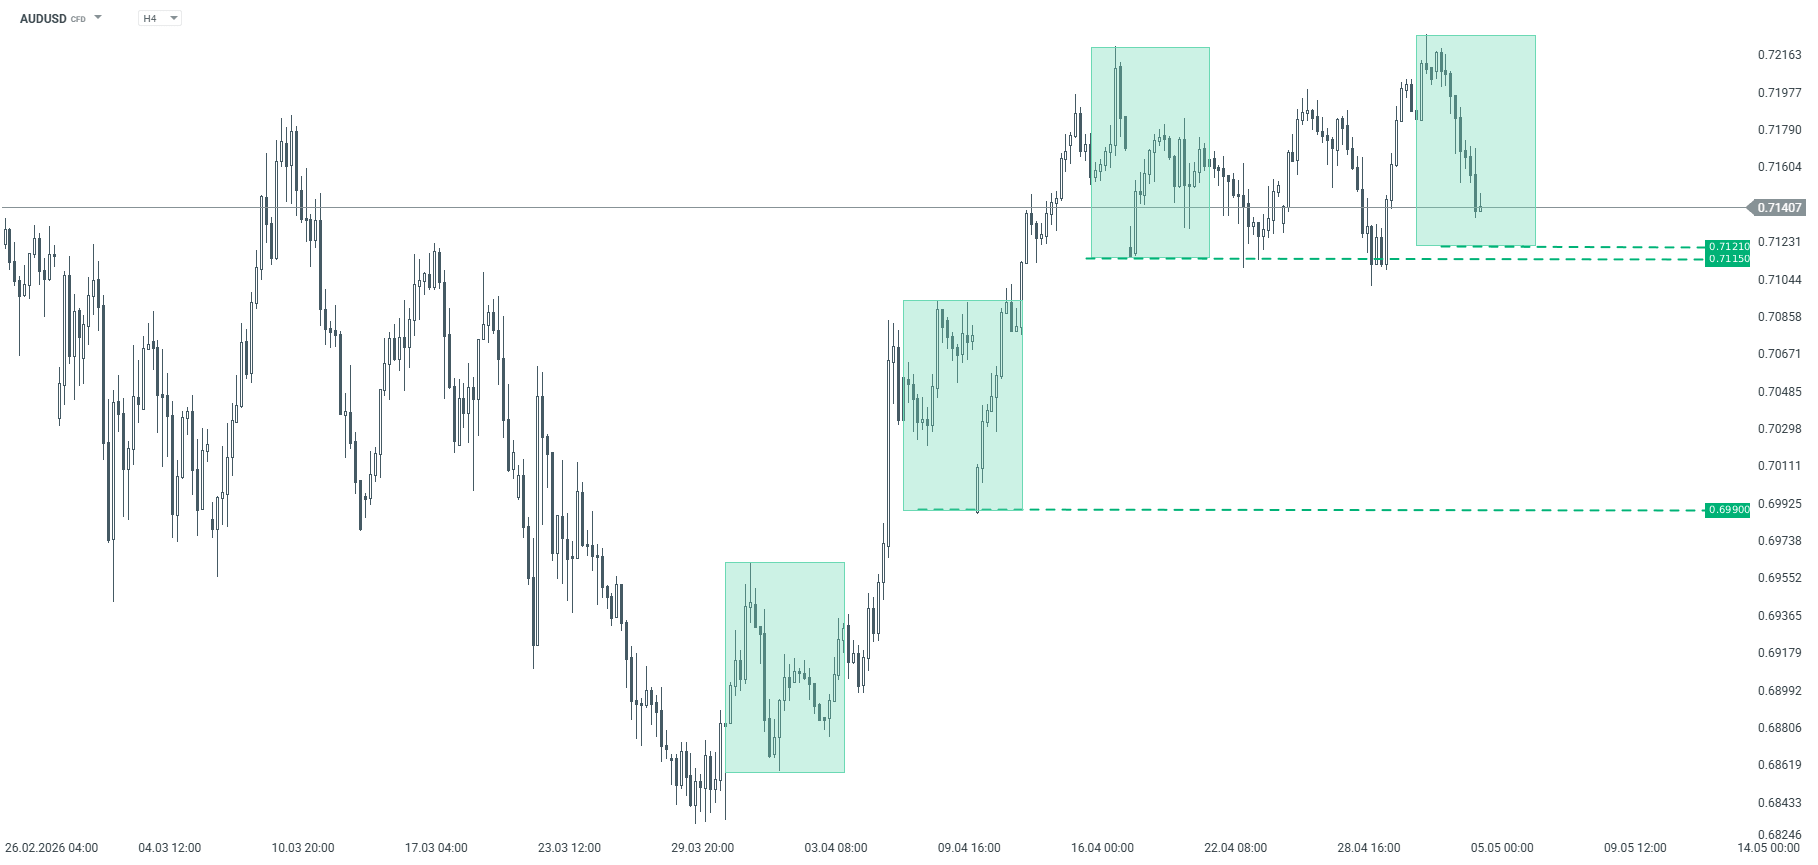
This analysis from the Overbalance series aims to identify three financial instruments, analysed primarily on the daily/four-hour timeframe (D1/H4). The analysis utilises only the Overbalance methodology, which helps to identify points where a trend may continue or where a reversal may occur. Today’s analysis covers three instruments, assessed solely in terms of 1:1 correction structures. AUDCAD After several tests, the AUDCAD exchange rate has broken through the key support level at 0.9755, which, according to the Overbalance methodology, paves the way for a deeper downward correction. A potential target for the downside is the 0.9610 level, where the lower boundary of the large 1:1 pattern is located. Currently, the 0.9755 level is acting as resistance, and only a sustained return of the price above this zone could restore the bullish scenario.
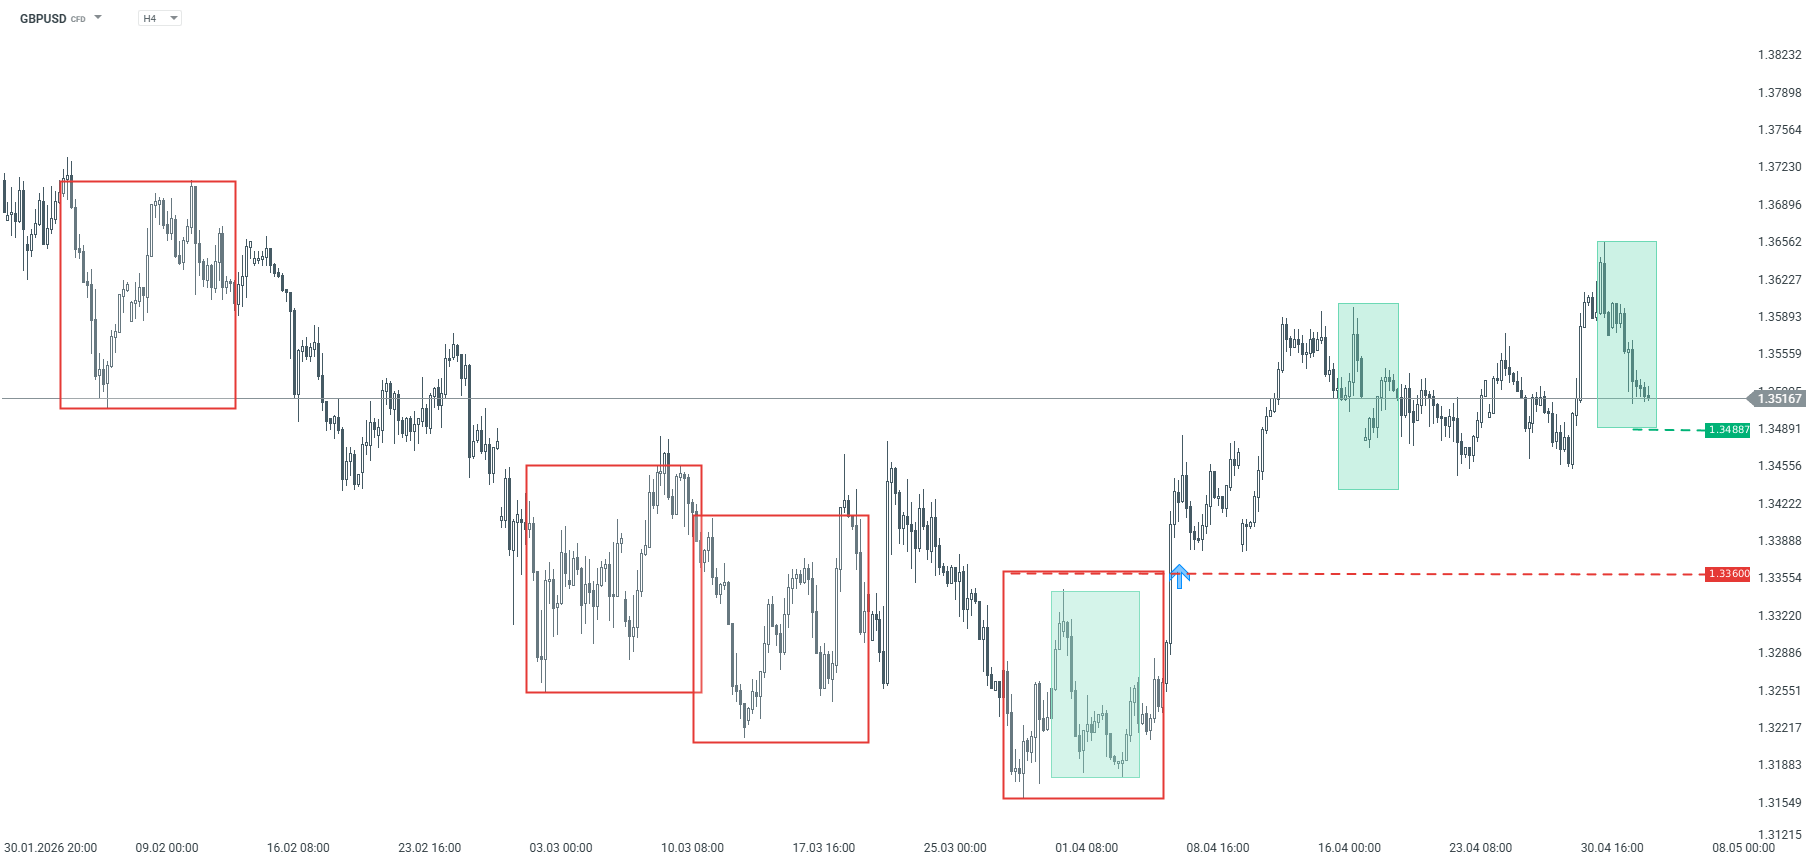
AUDCAD – H4 timeframe. Source: xStation GBPUSD Since the beginning of April, GBPUSD has been trading within a local uptrend, supported by the 1:1 bullish pattern highlighted in green. The key support level remains at 1.3488. A potential bounce at this point could lead to the generation of another upward impulse. Conversely, a break below this level would open the way for a decline towards 1.3360, where the polarity of the previously broken downward pattern lies.
GBPUSD – H4 chart. Source: xStation AUDUSD The AUDUSD pair remains in an uptrend. Recently, the pair reached a new local high, followed by a rapid correction. Should this correction deepen, the key support level is 0.7121, derived from the lower boundary of the 1:1 pattern. As long as this level holds, the base case scenario remains a continuation of the upward trend.
To provide the best experiences, we use technologies like cookies to store and/or access device information. Consenting to these technologies will allow us to process data such as browsing behavior or unique IDs on this site. Not consenting or withdrawing consent, may adversely affect certain features and functions.
Functional
Always active
The technical storage or access is strictly necessary for the legitimate purpose of enabling the use of a specific service explicitly requested by the subscriber or user, or for the sole purpose of carrying out the transmission of a communication over an electronic communications network.
Preferences
The technical storage or access is necessary for the legitimate purpose of storing preferences that are not requested by the subscriber or user.
Statistics
The technical storage or access that is used exclusively for statistical purposes.The technical storage or access that is used exclusively for anonymous statistical purposes. Without a subpoena, voluntary compliance on the part of your Internet Service Provider, or additional records from a third party, information stored or retrieved for this purpose alone cannot usually be used to identify you.
Marketing
The technical storage or access is required to create user profiles to send advertising, or to track the user on a website or across several websites for similar marketing purposes.