The British pound is regaining momentum at the end of the week, driven by a stronger-than-expected batch of UK economic data.
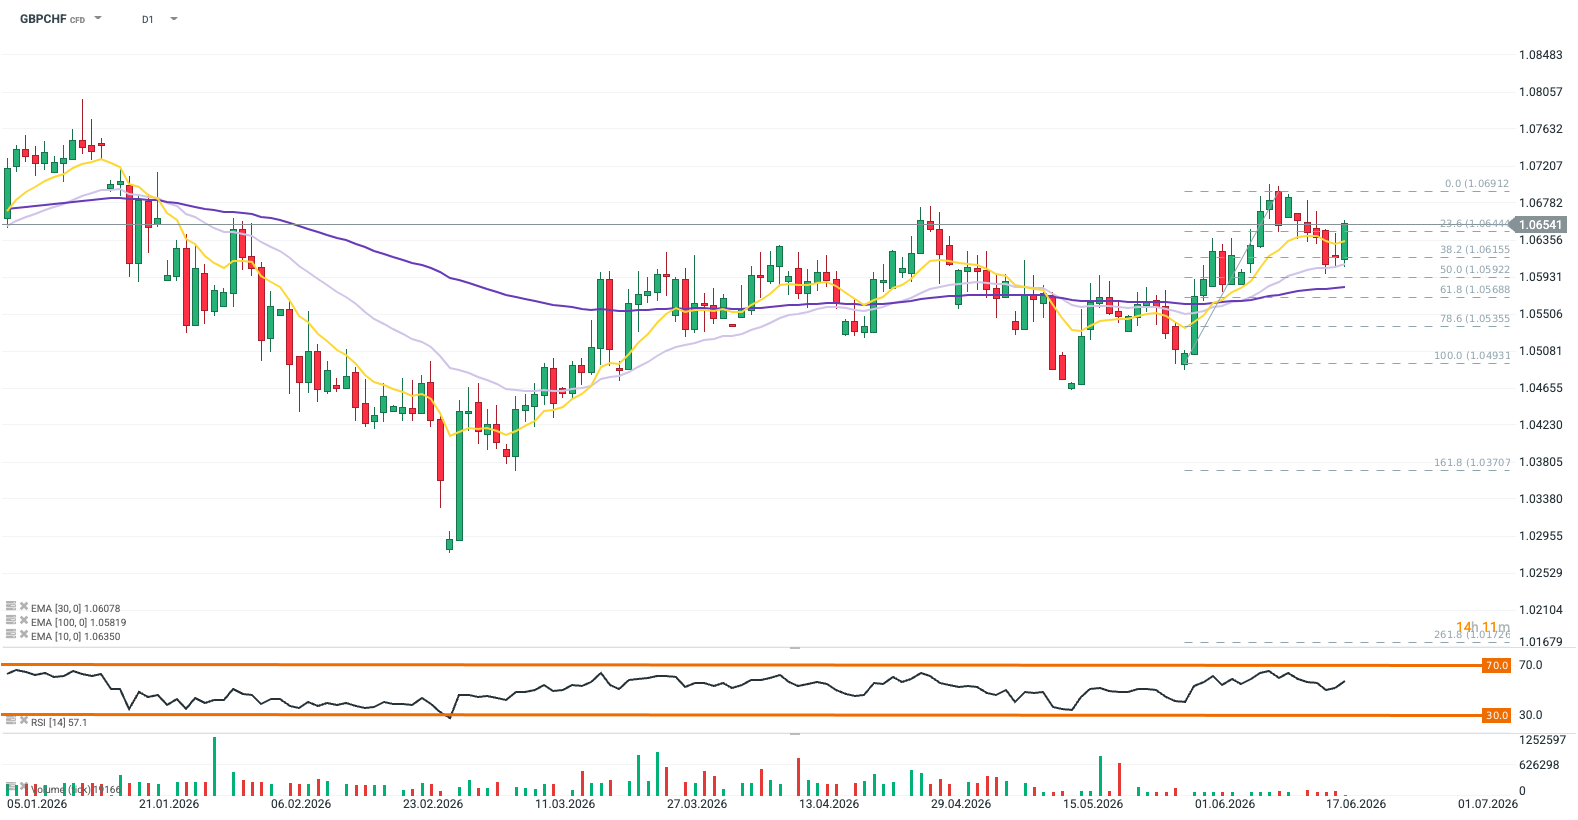
This surprise surge in retail sales successfully halted sterling’s broad decline against most G10 currencies. Leading the recovery is the GBP/CHF pair, which broke cleanly above key moving averages to cement the pound’s robust positioning across Europe this Friday.
GBPCHF is exhibiting a bullish outlook, rebounding firmly to 1.0651 after finding support near the 38.2% Fibonacci level. The pair trades cleanly above its 10, 30, and 100-day EMAs, saving the upward trend. With the RSI at 56.7, there is plenty of room for further gains toward recent local highs. Source: xStation5
What’s Driving GBPCHF Today?
Sales Surprise on the Upside: Driven by the joint-third warmest May on record and retail promotions, UK retail sales volumes jumped 1.2% in May 2026, bouncing back from a 1.0% decline in April. This growth significantly outperformed economists’ forecasts, with annual sales rising 3.2%. Department and online stores performed particularly well, boosting the online sales share to 28.8%, though overall volumes still remain 0.4% below their pre-pandemic February 2020 levels.
Fragile Trend Sustainability: Over the three months to May 2026, sales volumes edged up 0.4%, supported by strong demand for tech products and outdoor items. However, long-term consumer confidence remains fragile. Shoppers are showing caution regarding big-ticket purchases due to cost-of-living pressures and geopolitical uncertainty surrounding the conflict in Iran. Major supermarket groups like Tesco and Morrisons have already noted a distinct slowdown in sales growth since this conflict began.
Burnham’s Turning Point: Greater Manchester Mayor Andy Burnham’s decisive parliamentary victory in Makerfield has cleared the way for a potential challenge against the deeply unpopular Prime Minister Keir Starmer, threatening fresh political instability in the UK. Positioned as a prime minister-in-waiting and heavily favored by party members, Burnham’s win severely weakens Starmer—who already faces resignation calls from a quarter of his lawmakers—and sets the stage for a high-stakes battle over the future direction of the Labour government.
EUR/GBP retreated to the mid-range of the 0.8600s after rejection at one-month highs near 0.8685.
UK Retail Sales increased well beyond expectations in May.
Public Sector Net Borrowing has also risen against expectations, which might dent the Pound’s recovery.
The Euro (EUR) is pulling back against a stronger British Pound (GBP) on Friday, with the EUR/GBP pair trading at the 0.8665 area following rejection at one-month highs near 0.8685. UK Retail Sales figures released beat expectations in May, but the increase in government borrowing might have offset the positive impact on the GBP.
Retail consumption increased by 1.2% in the UK in May, according to data released by the Office for National Statistics, more than twice the 0.5% expected and following a 1% decline in April. Excluding fuel purchases, sales of all other products also increased by 1.2% after a 0.1% contraction in the previous month.
At the same time, National Statistics also revealed that Public Sector Net Borrowing rose to GBP 23.29 billion in May, from GBP 23.03 billion in April, against expectations of a decline to GBP 18.5 billion. These figures might increase concerns about the UK’s fiscal deficit and dent the Pound’s recovery.
German producer prices slow down in May
In the Eurozone, German Producer Prices Index (PPI) data showed that factory-gate inflation accelerated to 2.2% year-on-year in May, up from 1.7% in April, but below the 2.5% rate expected. The Monthly PPI eased to 0.3% from 1.2% in the previous month.
On Thursday, the Bank of England (BoE) met market expectations and left interest rates on hold at 3.75, with two policymakers calling for a quarter-point rate hike. The central bank also lowered its inflation forecasts for the rest of the year, but warned that the impact of the energy shock on the UK economy remains uncertain.
Also on Thursday, the Labour Mayor of Manchester, Andrew Burnham, won the election in Makerfield, securing the parliamentary seat needed to challenge the Prime Minister, Keir Starmer. The compact on the Pound, however, has been marginal so far.
GBP/USD prolongs its downtrend for the third straight day amid a combination of negative factors.
The UK political turmoil undermines the GBP amid reduced bets for aggressive rate hikes by the BoE.
The Fed’s hawkish tilt and the Iran uncertainty boost the USD, further exerting pressure on the pair.
The GBP/USD pair attracts some follow-through selling for the third straight day and weakens further below the 1.3200 mark, hitting a fresh low since April during the Asian session on Friday. Spot prices remain on track to register heavy weekly losses, and the fundamental backdrop suggests that the path of least resistance remains to the downside.
The British Pound (GBP) continues with its relative underperformance in the wake of lingering domestic political risks, which, along with a bullish US Dollar (USD), validates the near-term negative outlook for the GBP/USD pair. Greater Manchester Mayor Andy Burnham cleared a path to attempt to oust British Prime Minister Keir Starmer after winning a parliamentary seat in northern England on Friday. In his victory speech, Burnham said the result could be a “turning point” for British politics and told his party that this was a final chance to change direction.
Meanwhile, traders have scaled back expectations for more aggressive interest rate hikes by the Bank of England (BoE) following the release of softer inflation figures earlier this week. Furthermore, the US-Iran peace deal eased concerns about the energy shock, endorsing the view that the BoE will hold interest rates steady. This is seen as another factor undermining the GBP. The USD, on the other hand, stands firm near its highest level since late March amid the US Federal Reserve’s (Fed) more hawkish tilt, signaling the possibility of at least one rate hike by the year-end.
On the geopolitical front, US Vice President JD Vance canceled his planned trip for talks with Iran in Switzerland, saying that the meeting wasn’t yet finalized. Adding to this, Israeli air strikes in Lebanon threaten to unravel the US-Iran deal. This further benefits the safe-haven USD and backs the case for an extension of the GBP/USD pair’s steep downfall from the weekly swing high, near the 1.3460 region. This, in turn, suggests that any attempted recovery could be seen as a selling opportunity as traders now look to UK monthly Retail Sales data for a fresh impetus.
Pound Sterling Price This week
The table below shows the percentage change of British Pound (GBP) against listed major currencies this week. British Pound was the strongest against the New Zealand Dollar.
USD
EUR
GBP
JPY
CAD
AUD
NZD
CHF
USD
1.17%
1.70%
0.74%
1.14%
0.66%
1.61%
1.32%
EUR
-1.17%
0.50%
-0.42%
-0.03%
-0.53%
0.43%
0.14%
GBP
-1.70%
-0.50%
-1.09%
-0.52%
-1.03%
-0.07%
-0.35%
JPY
-0.74%
0.42%
1.09%
0.39%
-0.10%
0.89%
0.56%
CAD
-1.14%
0.03%
0.52%
-0.39%
-0.52%
0.50%
0.16%
AUD
-0.66%
0.53%
1.03%
0.10%
0.52%
0.96%
0.69%
NZD
-1.61%
-0.43%
0.07%
-0.89%
-0.50%
-0.96%
-0.28%
CHF
-1.32%
-0.14%
0.35%
-0.56%
-0.16%
-0.69%
0.28%
The heat map shows percentage changes of major currencies against each other. The base currency is picked from the left column, while the quote currency is picked from the top row. For example, if you pick the British Pound from the left column and move along the horizontal line to the US Dollar, the percentage change displayed in the box will represent GBP (base)/USD (quote).
The United Kingdom (UK) headline Consumer Price Index (CPI) climbed 2.8% over the year in May, compared to a rise of 2.8% in April, the data released by the Office for National Statistics (ONS) showed on Wednesday. The UK inflation reading was well above the Bank of England’s (BoE) 2% inflation target.
The core CPI (excluding volatile food and energy items) rose 2.6% year-over-year (YoY) in the same period, compared to April’s 2.5% print and came in softer than the forecast of 2.7%.
Meanwhile, the monthly UK CPI arrived at 0.2% in May versus a rise of 0.7% reported in April, below the market consensus of 0.4%.
The British Pound (GBP) attracts some sellers in an immediate reaction to the UK inflation report. At the time of writing, the GBP/USD pair is trading 0.05% lower on the day to trade at 1.3420.
Pound Sterling Price Today
The table below shows the percentage change of British Pound (GBP) against listed major currencies today. British Pound was the weakest against the Swiss Franc.
USD
EUR
GBP
JPY
CAD
AUD
NZD
CHF
USD
-0.04%
0.02%
-0.08%
0.03%
0.12%
0.19%
-0.22%
EUR
0.04%
0.06%
-0.02%
0.06%
0.15%
0.26%
-0.17%
GBP
-0.02%
-0.06%
-0.09%
0.03%
0.13%
0.19%
-0.20%
JPY
0.08%
0.02%
0.09%
0.10%
0.19%
0.22%
-0.10%
CAD
-0.03%
-0.06%
-0.03%
-0.10%
0.09%
0.16%
-0.21%
AUD
-0.12%
-0.15%
-0.13%
-0.19%
-0.09%
0.09%
-0.29%
NZD
-0.19%
-0.26%
-0.19%
-0.22%
-0.16%
-0.09%
-0.38%
CHF
0.22%
0.17%
0.20%
0.10%
0.21%
0.29%
0.38%
The heat map shows percentage changes of major currencies against each other. The base currency is picked from the left column, while the quote currency is picked from the top row. For example, if you pick the British Pound from the left column and move along the horizontal line to the US Dollar, the percentage change displayed in the box will represent GBP (base)/USD (quote).
What do United Kingdom CPI inflation data mean for the British Pound?
The UK CPI is a measure of consumer price inflation, the rate at which the prices of goods and services bought by households rise or fall. This figure is one of the most important economic indicators for the GBP because it measures inflation and plays a key role in the Bank of England’s (BoE) monetary policy decisions.
Hotter-than-expected CPI Inflation suggests stronger price pressures in the economy. Traders may expect the BoE to keep interest rates higher-for-longer or consider additional rate hikes.
On the other hand, softer-than-expected outcomes may indicate easing price pressures in the UK economy. Markets could increase their bets on future BoE rate cuts.
Technical Analysis: GBP/USD maintains a neutral outlook in the near-term
In the daily chart, GBP/USD holds just above the Bollinger middle band, while still capped by the 100-day simple moving average (SMA). This configuration suggests a neutral near-term bias, with price consolidating inside the Bollinger envelope rather than trending. The Relative Strength Index (RSI) at roughly 50 hints at balanced momentum, leaving the pair dependent on a break outside this nearby band-and-MA corridor to define the next directional move.
On the topside, initial resistance emerges at the 100-day SMA around 1.3460, with the Bollinger upper band near 1.3498 forming a secondary barrier if buyers extend the recovery. On the downside, immediate support is seen at the Bollinger middle band around 1.3420, ahead of a deeper cushion at the Bollinger lower band close to 1.3345, where a break would expose a broader corrective phase.
GBP/USD keeps hovering around 1.3400, lacking a clear bias.
Investors await details from the US-Iran deal and interest rate decisions by the Fed and the BoE.
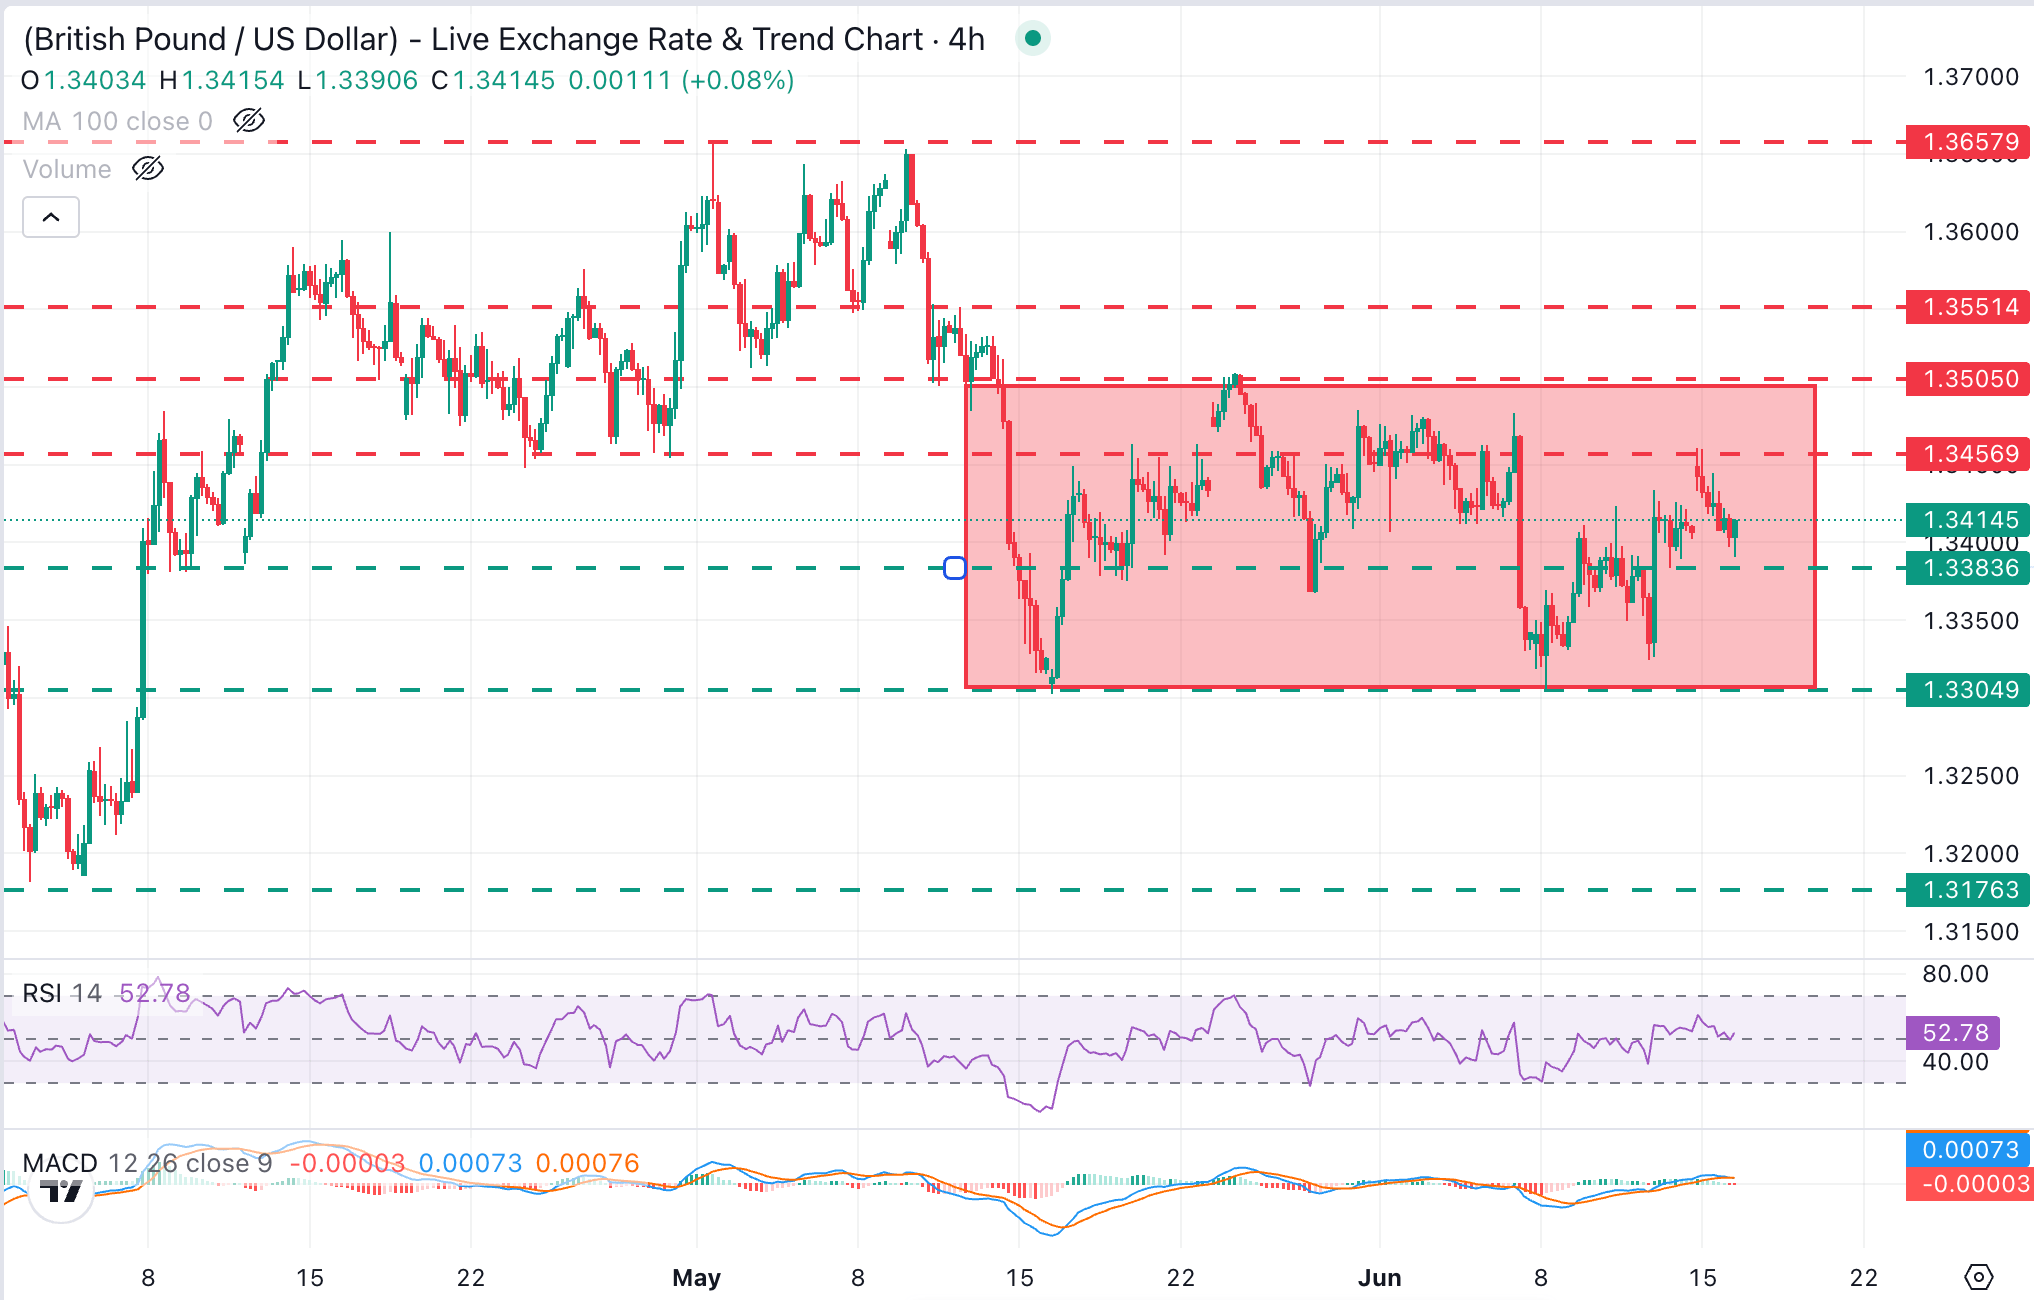
Technically, the pair is in a consolidating phase, trapped between 1.3300 and 1.3500.
The British Pound (GBP) is trading practically flat against the US Dollar (USD) on Tuesday. The Doji candles at the 1.3400 area highlight an indecisive market, as traders await details on the US-Iran peace deal and monetary policy decisions by the US Federal Reserve (Fed) and the Bank of England (BoE) to make investment decisions.
US Vice President JD Vance affirmed earlier on the day that no tolls will be applied to vessels crossing the Strait of Hormuz and that nuclear inspectors will return to Iran. Investors, however, remain reluctant to take excessive risks, awaiting confirmation from Tehran.+
Markets are also attentive to the interest rate decisions from the Fed and the BoE to assess how major central banks will react to the peace deal. The Fed is expected to keep rates on hold on Wednesday, with the new Chairman Kevin Warsh, likely to adopt a more dovish stance than his predecessor Jerome Powell.
On Thursday, the BoE is highly likely to follow suit on rates and to hint at a steady monetary policy for the coming months. In this case, the vote split and the minutes of the meeting are expected to provide further details about the bank’s forward guidance.
Technical Analysis: Key levels are 1.3300 and 1.3500
GBP/USD trades at 1.3410, halfway through the last four weeks’ range, between 1.3300 and 1.3500. Indicators in the 4-hour chart highlight a lack of clear momentum, with the Relative Strength Index (RSI) flat at the 50 midline and the Moving Average Convergence Divergence (MACD) fractionally below zero, together hinting at a consolidative bias.
The pair was rejected at the 1.3460 area on Monday, although the key resistance area lies between 1.3485 and 1.3505, which has held bulls since mid-May. Further up, the next target is the May 14 high, near 1.3550.
On the downside, Friday’s low, at 1.3380, might provide some support ahead of the bottom of the range, at the 1.3300 area (May 18, June 8 lows). Below here, the next bearish target is the late March to early April lows around 1.3170.
(The technical analysis of this story was written with the help of an AI tool.)
US Dollar Price Today
The table below shows the percentage change of US Dollar (USD) against listed major currencies today. US Dollar was the strongest against the Australian Dollar.
USD
EUR
GBP
JPY
CAD
AUD
NZD
CHF
USD
-0.03%
-0.00%
-0.05%
0.09%
0.18%
0.07%
0.03%
EUR
0.03%
0.03%
0.02%
0.13%
0.20%
0.10%
0.07%
GBP
0.00%
-0.03%
0.00%
0.11%
0.16%
0.08%
0.04%
JPY
0.05%
-0.02%
0.00%
0.11%
0.19%
0.10%
0.08%
CAD
-0.09%
-0.13%
-0.11%
-0.11%
0.08%
-0.03%
-0.06%
AUD
-0.18%
-0.20%
-0.16%
-0.19%
-0.08%
-0.09%
-0.12%
NZD
-0.07%
-0.10%
-0.08%
-0.10%
0.03%
0.09%
-0.03%
CHF
-0.03%
-0.07%
-0.04%
-0.08%
0.06%
0.12%
0.03%
The heat map shows percentage changes of major currencies against each other. The base currency is picked from the left column, while the quote currency is picked from the top row. For example, if you pick the US Dollar from the left column and move along the horizontal line to the Japanese Yen, the percentage change displayed in the box will represent USD (base)/JPY (quote).
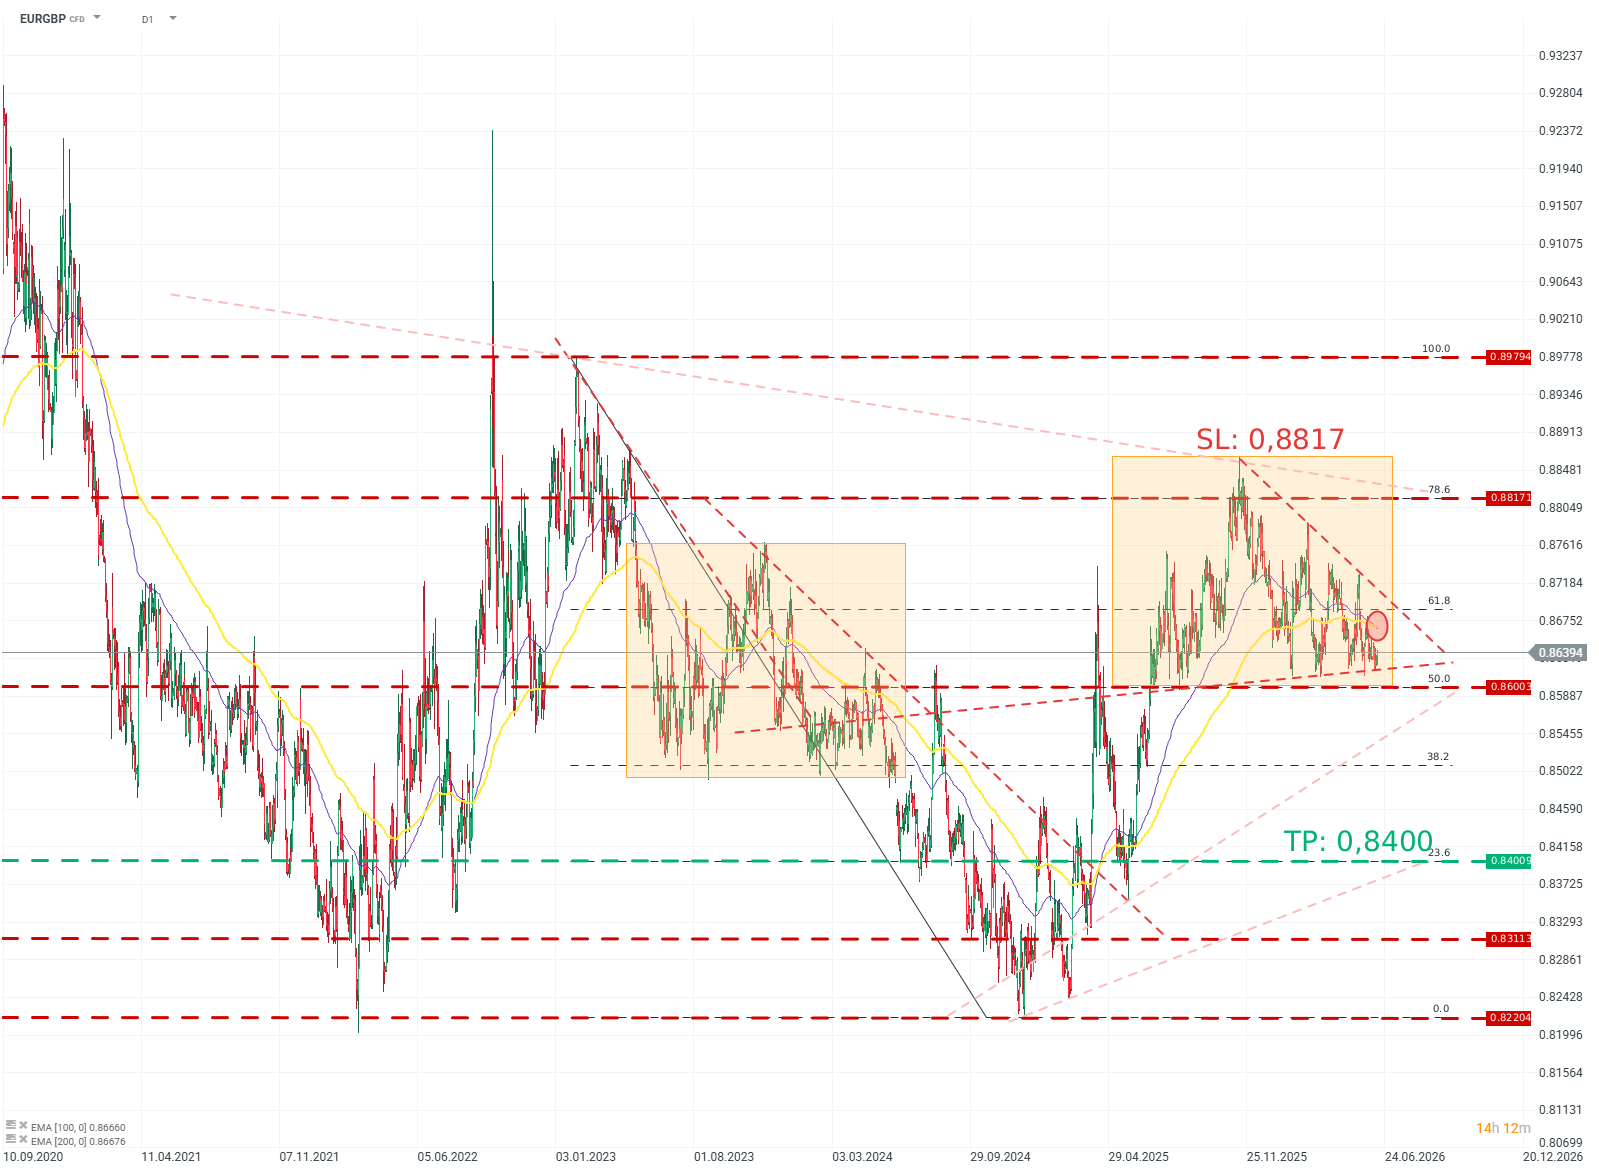
The price is near the lower boundary of a consolidation range between 0.886 and 0.861.
Upward corrections within the consolidation are breaking to increasingly lower levels, while at the same time testing resistance around 0.863.
The EMA100 has crossed the EMA200 from above.
Recommendation:
Short position (Sell) on EURGBP at the market price.
Target price (Take Profit; TP): 0.8400
Stop Loss (SL): 0.8817
EURGBP (D1)
Source: xStation5
OPINION :
The EURGBP rate is once again testing the lower boundary of the consolidation, which can also be treated as a developing 1:1 pattern, potentially ending with a downside breakout. The repeated defense of the ~0.86 level indicates the strength of this zone; however, increasingly weaker upward corrections within the consolidation reveal buyer weakness and point to the likely direction of further price movement.
Methodology and assumptions:
The recommendation is based on technical analysis of the chart, in particular EMA moving averages and Fibonacci levels.
The target level was determined based on Fibonacci levels.
The protective stop-loss order was set based on a favorable risk-to-reward ratio and with reference to a Fibonacci level.
GBP/USD jumps to near 1.3460 as the market sentiment turns favorable for riskier assets.
The finalization of an MoU between the US and Iran has improved the market mood.
The Fed and BoE are scheduled to announce their monetary policies on Wednesday and Thursday, respectively.
The GBP/USD pair trades 0.35% higher to near 1.3460 during the late Asian trading session on Monday. The Cable extends its week-long advance as market sentiment improves further, following the announcement that the United States (US) and Iran have reached a deal.
At press time, S&P 500 futures are up over 1% and Asian stock markets are exhibiting a broad rally, reflecting a strong risk appetite of investors. The US Dollar Index (DXY), which tracks the Greenback’s value against six major currencies, trades 0.4% lower at near 99.40.
Pakistan Prime Minister (PM) Shehbaz Sharif has stated in a post on X, formerly known as Twitter, that the finalized memorandum of understanding (MoU) between the US and Iran will be signed on June 19 in Switzerland.
Meanwhile, investors brace for a volatile week, especially for the British Pound (GBP), as an array of United Kingdom (UK) data, including the labor market report for three months ending in April and the Consumer Price Index (CPI) data for May, along with the Bank of England’s (BoE) monetary policy announcement, will be key events to watch out.
In the US, investors will focus on the Federal Reserve’s (Fed) monetary policy, which will be announced on Wednesday.
GBP/USD technical analysis
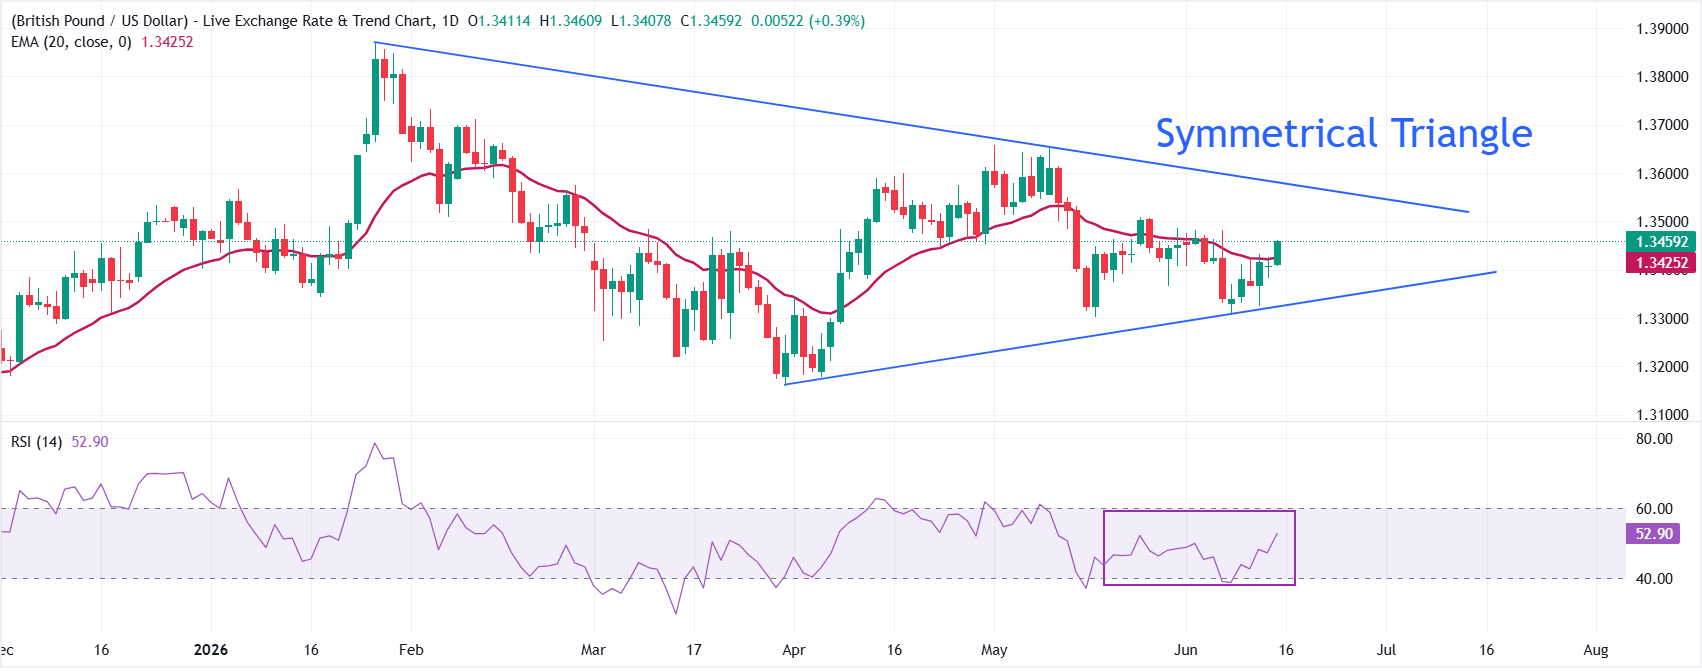
GBP/USD trades sharply higher at around 1.3460 as of writing. The near-term bias has turned mildly bullish as it returns above the 20-period exponential moving average (EMA), which is at 1.3425.
The Relative Strength Index (RSI) at about 53 hovers just above the midline, hinting at steady, rather than aggressive, upside momentum while the pair consolidates within this supported backdrop.
On the topside, the primary hurdle is the May 26 high at around 1.3500, followed by the descending resistance trend line, with its break price near 1.3580. On the downside, initial demand would be seen around the 20-EMA at 1.3425, while the upward trend-line support around 1.3327 would remain a key support zone.
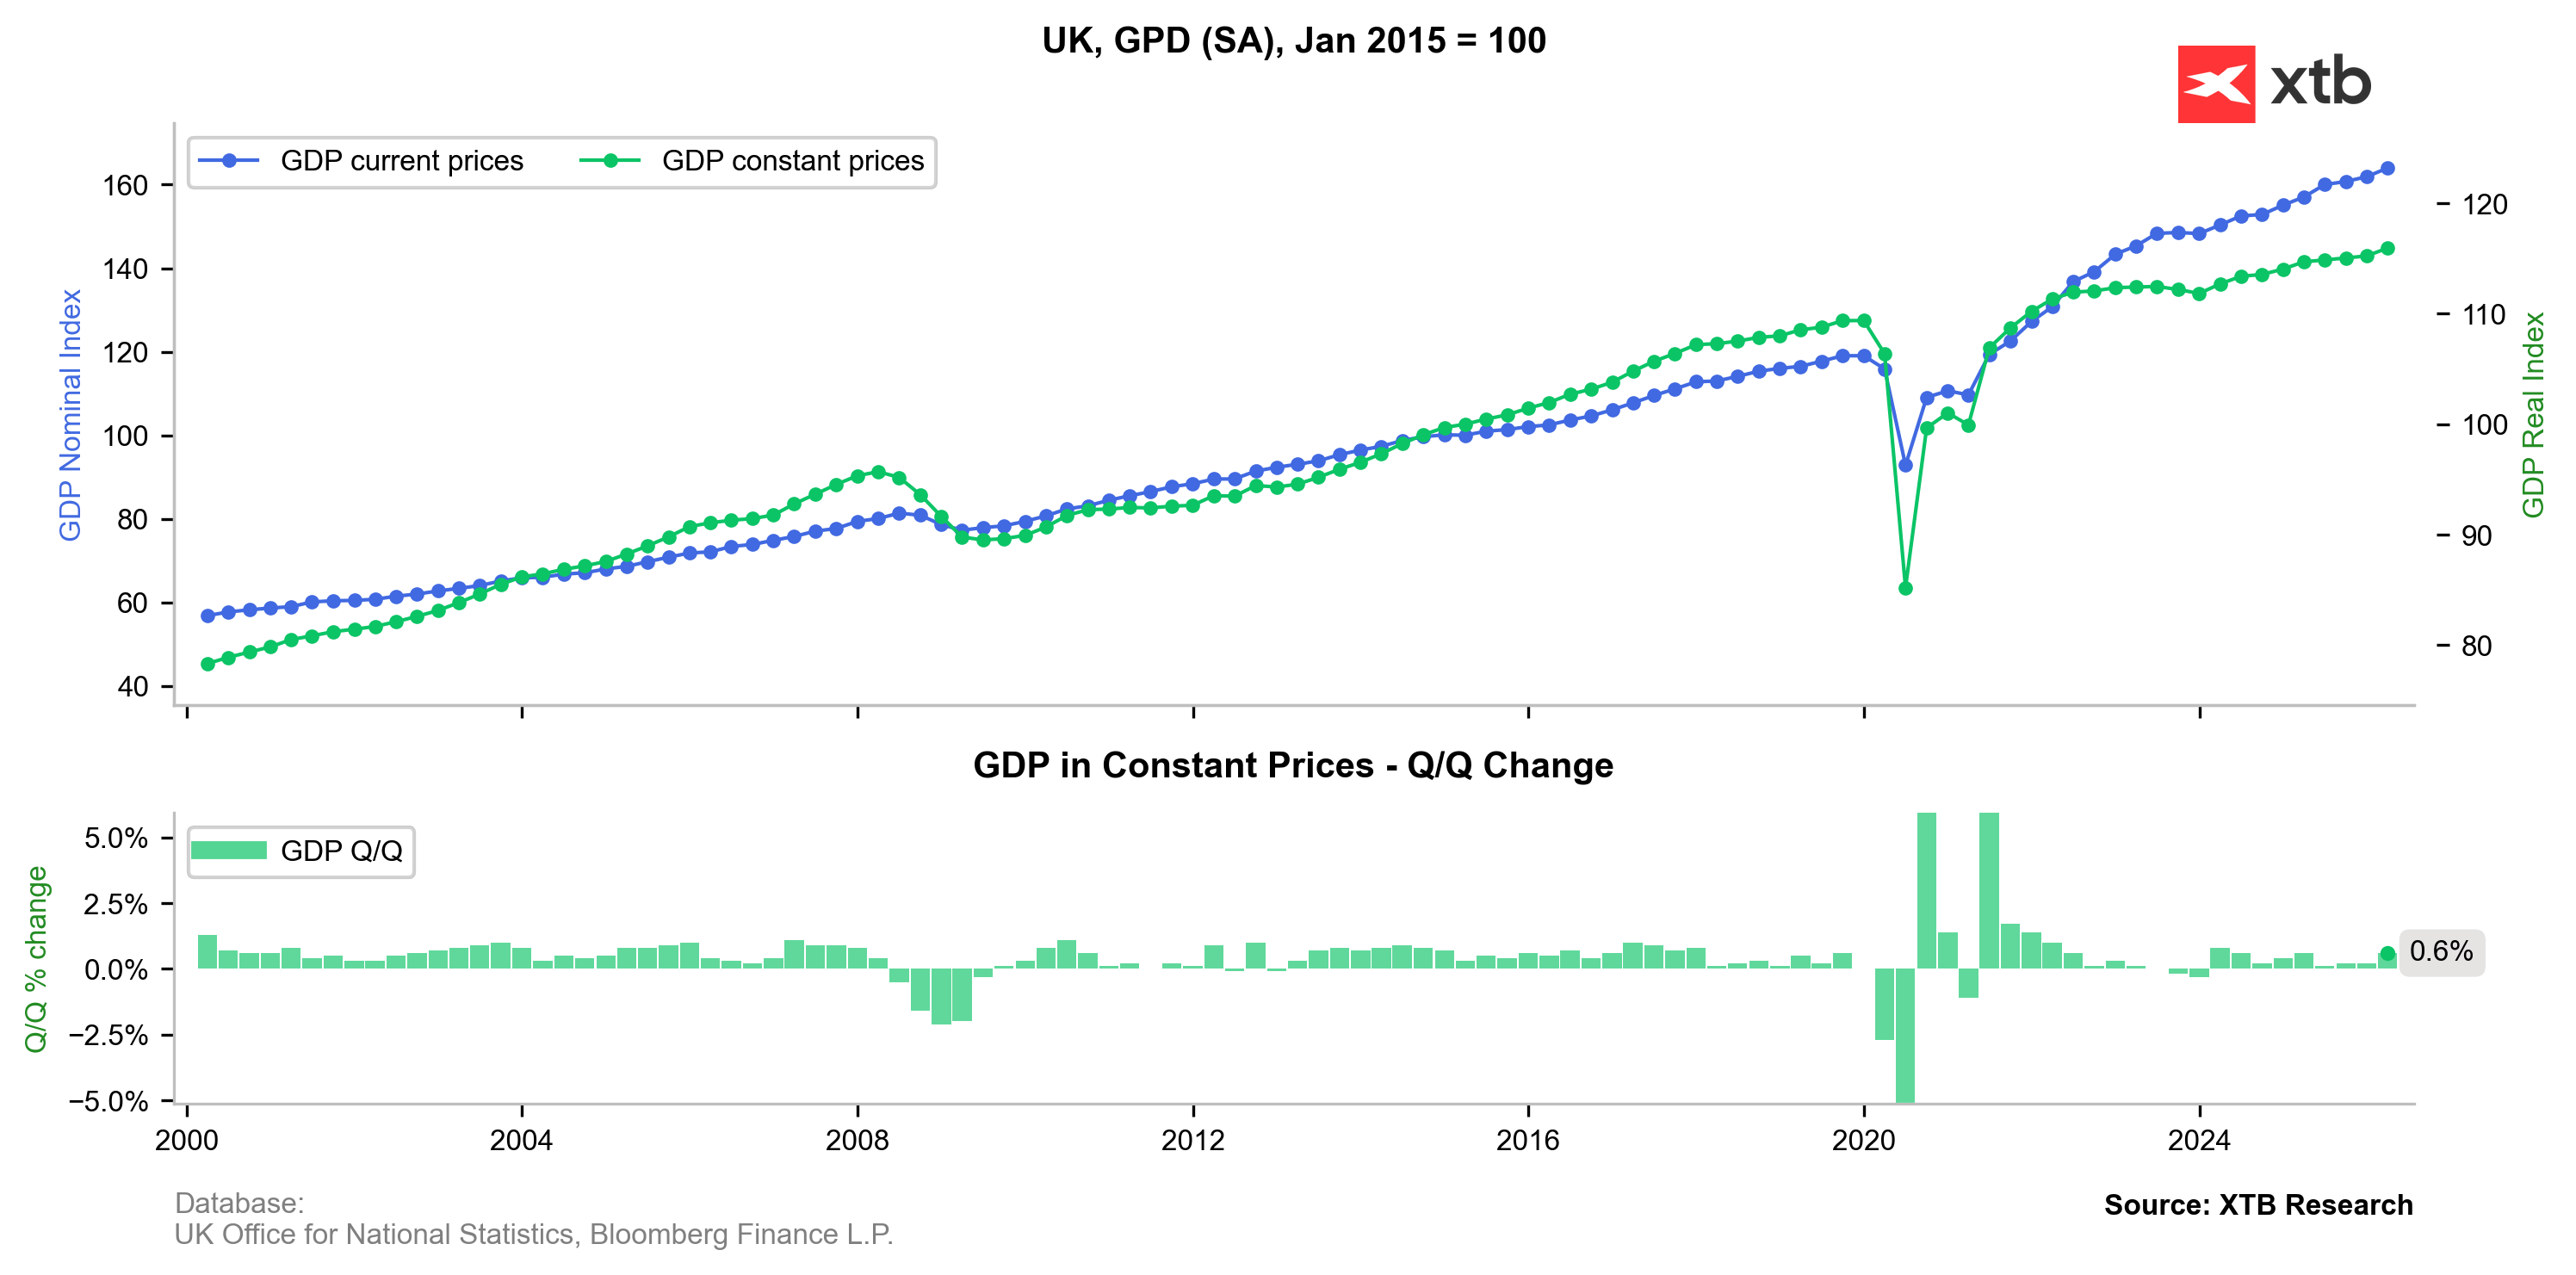
pril 2026 as a result of the escalating conflict in the Middle East. According to the latest data from the Office for National Statistics (ONS), this marks the first monthly GDP decline since August 2025. Although this contraction aligns with forecasts from economists polled by Reuters, it represents a sharp trend reversal from March, which recorded a 0.3% growth. However, looking at the less volatile three-month perspective, real GDP grew by 0.7% in the period to April 2026, demonstrating that the British economy entered the current crisis on relatively stable foundations.
Chart 1: Real and nominal GDP in the United Kingdom (upper panel) and quarter-on-quarter change (lower panel). In Q1 2026 (January–March), the UK economy grew by 0.6%, offering a solid base by British standards before the effects of the Middle East war materialized. Source: XTB Research based on ONS/Bloomberg data.
How the Iran Conflict Stalled Growth in the United Kingdom
The main catalyst for April’s slowdown is the war between Iran and the US, which recently passed the 100-day mark. The effective blocking of the Strait of Hormuz—a crucial shipping route for oil and many other commodities—paralyzed global supply chains and triggered a sharp surge in energy and fuel prices. As a net energy importer, the UK is exceptionally vulnerable to international energy shocks. A sudden surge in prices at petrol stations forced motorists to drastically cut consumption in April, reversing the positive growth impulses seen at the beginning of the year. Furthermore, ONS surveys revealed widespread complaints from businesses regarding falling turnovers and rising production costs across the wholesale, manufacturing, and transport sectors.
Sector Breakdown: Slump in Services, Stagnation in New Construction
April’s economic slowdown was characterized by uneven performances across core industrial sectors:
Services Sector: Recorded a 0.2% decline, becoming the primary driver of the monthly GDP drop. The arts, entertainment, and recreation sector suffered the most, posting a drastic 9.1% fall. This was mainly due to the cancellation of multiple sporting events in the Middle East, which directly hit UK-based companies.
Construction: Ticked up marginally by 0.1%. However, this growth came solely from a 0.6% recovery in repair and maintenance. New construction projects fell by 0.3%, complicating the government’s political promises to accelerate housebuilding in the UK.
Industrial Production: Showed zero growth (0.0%). Although manufacturing grew by 0.4% (driven by a 4.2% surge in pharmaceutical production), these gains were completely offset by shrinking outputs in the utility sector.
Stagflation Risks and the Bank of England’s Dilemma
The sudden dip in GDP momentum has raised serious concerns about a dangerous descent towards stagflation—a situation where economic stagnation couples with stubborn inflation. The International Monetary Fund (IMF) has already downgraded its 2026 UK economic growth forecast from 1.3% to just 0.8%, warning that Britain could feel the impact of the war most acutely among major economies. Economic conditions could deteriorate further in the third quarter, when the domestic energy price cap is set to rise by 13%, allowing suppliers to pass higher oil and gas costs onto consumers. This leaves the Bank of England in a precarious position ahead of its upcoming interest rate decision. Policymakers must now balance combating war-driven inflation against the risk of triggering a deeper recession.
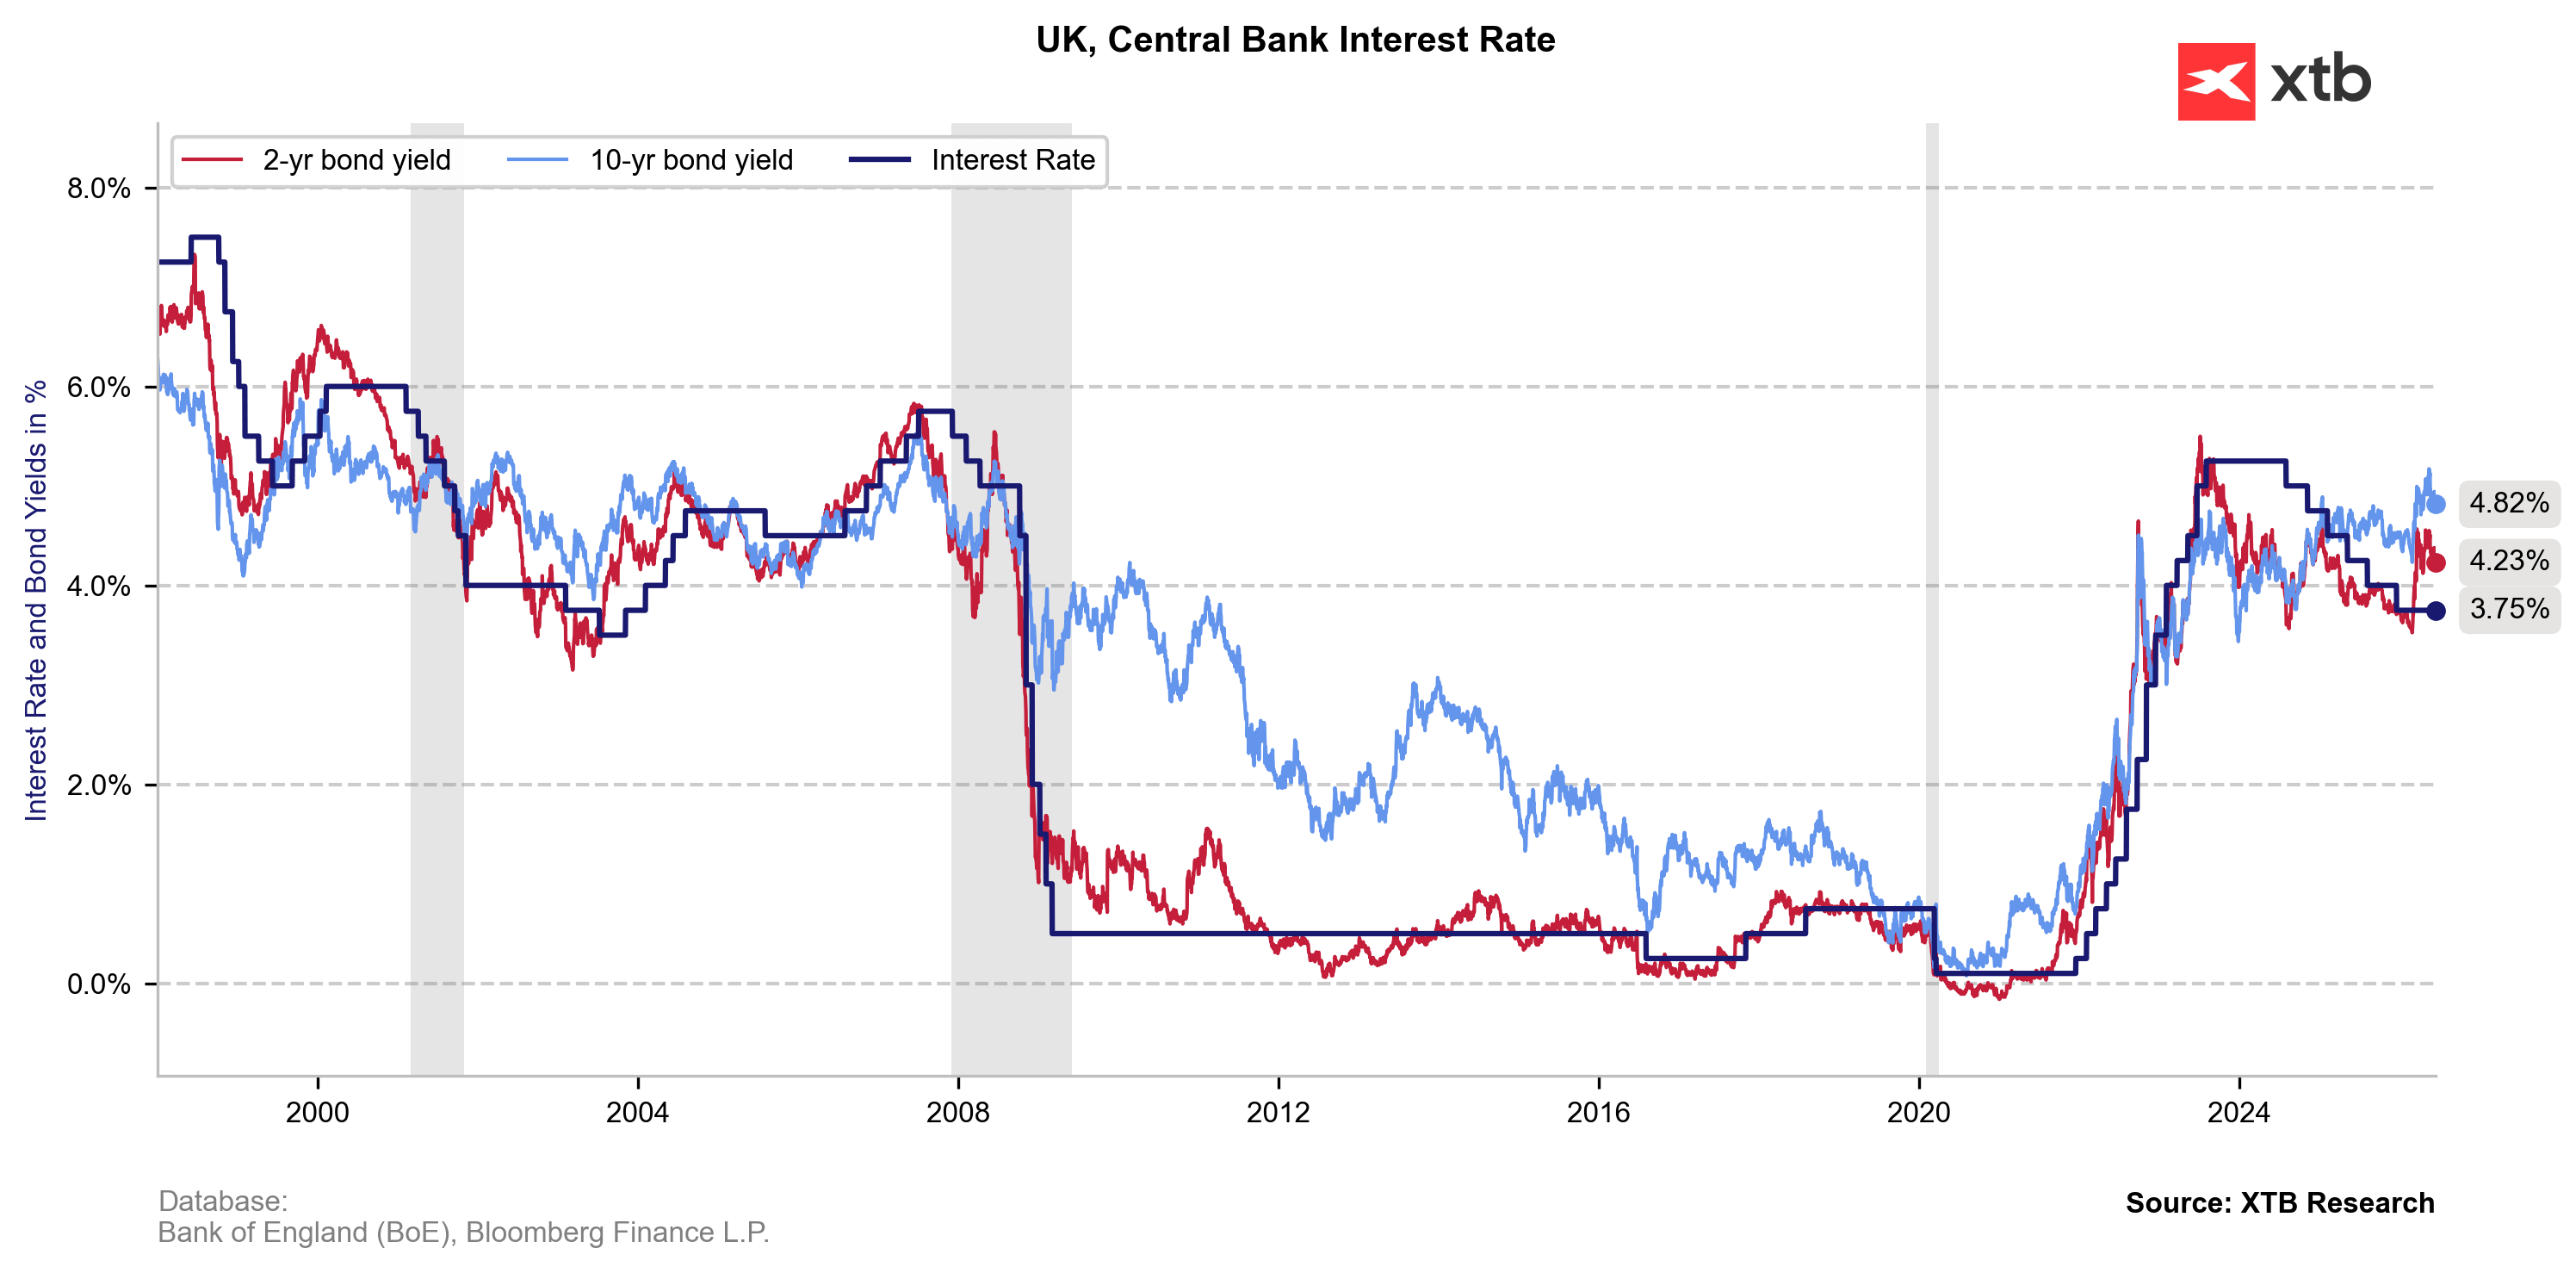
Following the ONS release, sterling initially lost 0.2% against the dollar as markets scaled back expectations for subsequent rate hikes. Over time, however, a global increase in risk appetite took over in response to easing tensions between the US and Iran, resulting in a weaker dollar. Moreover, the softer GDP does not eliminate the hawkish pressure on the Bank of England, which is widely expected to hold interest rates at 3.75%. Some members of the Monetary Policy Committee may vote for a hike, signaling the central bank’s readiness to combat the prolonged energy shock.
Chart 2: The Bank of England’s main interest rate and UK 2- and 10-year bond yields. Yields are already clearly above the 3.75% rate, signaling hawkish expectations from the debt market, which is organically tightening financial conditions. Source: XTB Research based on Bloomberg data.
Technical Analysis: GBPUSD (D1)
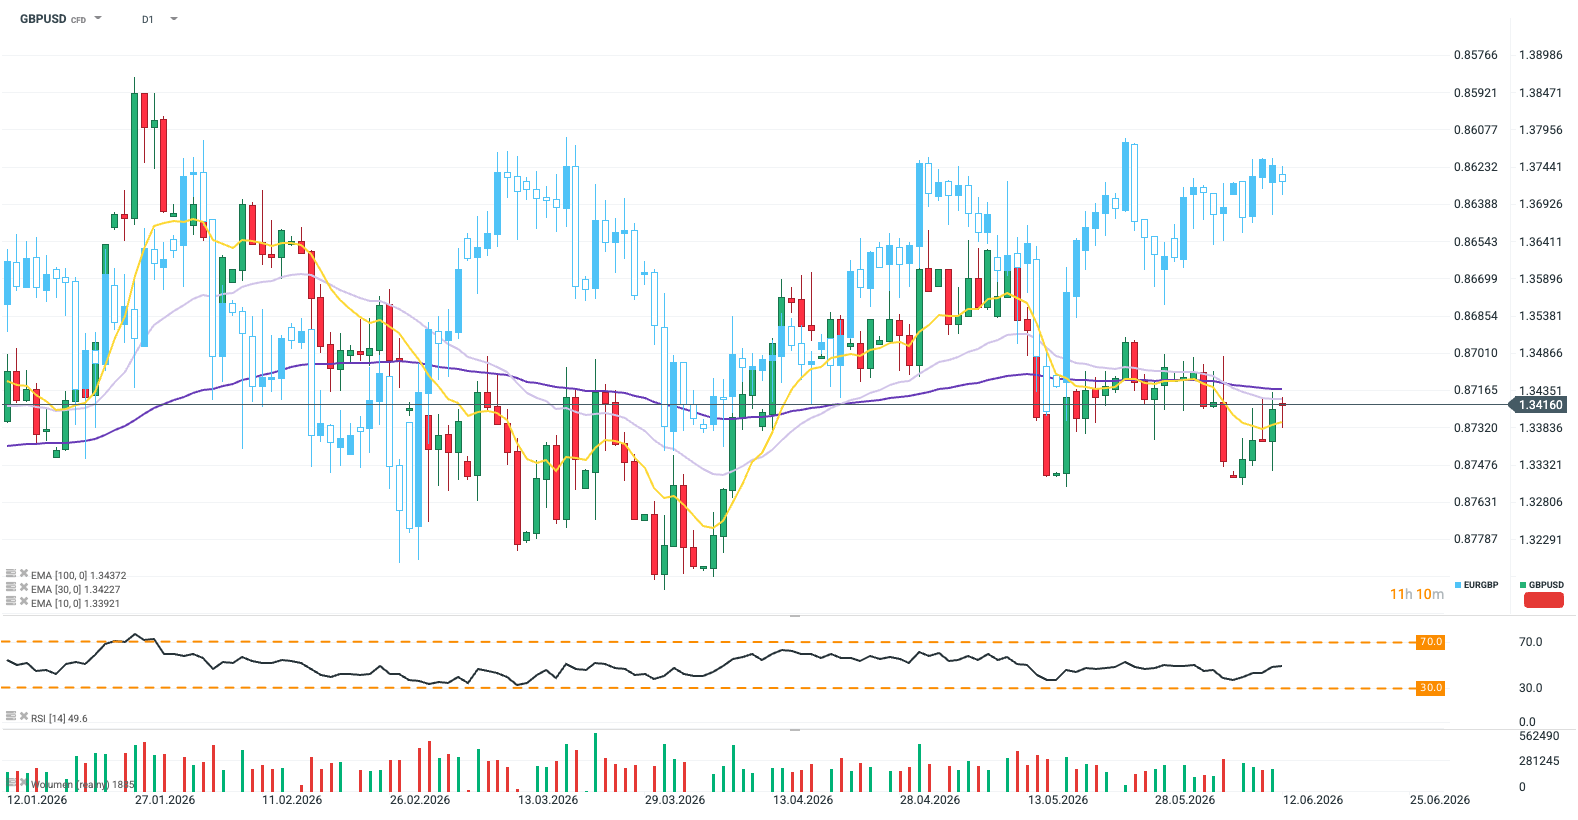
GBPUSD is currently trading slightly up (+0.05%), although the pair on the D1 interval remains in a local downtrend, consolidating around the 1.34158 level. The price is currently moving below key exponential moving averages: EMA 30 (1.34226) and EMA 100 (1.34372), which act as crucial resistance for any building momentum. Following a rebound from recent support near 1.3330, selling pressure has slowed down. The RSI (14) indicator at 49.5 signals complete market neutrality. The next direction depends on a sustained breakout above the moving averages or a return to test the recent lows.
To provide the best experiences, we use technologies like cookies to store and/or access device information. Consenting to these technologies will allow us to process data such as browsing behavior or unique IDs on this site. Not consenting or withdrawing consent, may adversely affect certain features and functions.
Functional
Always active
The technical storage or access is strictly necessary for the legitimate purpose of enabling the use of a specific service explicitly requested by the subscriber or user, or for the sole purpose of carrying out the transmission of a communication over an electronic communications network.
Preferences
The technical storage or access is necessary for the legitimate purpose of storing preferences that are not requested by the subscriber or user.
Statistics
The technical storage or access that is used exclusively for statistical purposes.The technical storage or access that is used exclusively for anonymous statistical purposes. Without a subpoena, voluntary compliance on the part of your Internet Service Provider, or additional records from a third party, information stored or retrieved for this purpose alone cannot usually be used to identify you.
Marketing
The technical storage or access is required to create user profiles to send advertising, or to track the user on a website or across several websites for similar marketing purposes.