DXY struggles to capitalize on the previous day’s solid recovery move from mid-June lows.
The US-Iran uncertainty keeps the geopolitical risk premium in play and acts as a tailwind.
Fed rate hike bets further lend support to the buck as bulls await the US NFP report on Friday.
The US Dollar Index (DXY), which tracks the Greenback against a basket of currencies, struggles to capitalize on a modest Asian session uptick and currently trades around the 100.00 psychological mark, nearly unchanged for the day. The index, for now, seems to have stalled the previous day’s solid recovery move from its lowest level since mid-June, though the fundamental backdrop warrants some caution for bearish traders.
The optimism over a potential US-Iran peace deal faded rather quickly after Iran said on Monday there were no talks underway with the US and no plans for any meetings. Meanwhile, US President Donald Trump had cited resumption of negotiations as justification for calling off attacks over the weekend. Adding to this, unconfirmed reports of drone strikes on US assets in Kuwait prompt traders to again price in the geopolitical risk premium, which, in turn, is seen offering some support to the safe-haven US Dollar (USD).
Meanwhile, Mohsen Rezaee, a senior military adviser to Iran’s Supreme Leader, said that Tehran will not permit any shipping route through the strategic waterway other than the one designated by the Islamic Republic. Rezaee further warned that US vessels and forces could face serious risk and casualties if the standoff over the strategic waterway continues. This lends some support to crude oil prices, reviving inflation fears and keeping bets for at least one rate hike by the US Federal Reserve (Fed) firmly on the table.
Adding to this, data released on Monday showed that US manufacturing sector activity increased to the highest level in more than four years in July. In fact, the US ISM Manufacturing PMI rose to 55.6 last month from 53.3 in June, surpassing consensus estimates. This reaffirms hawkish Fed expectations, validating the near-term positive outlook for the DXY. Traders, however, might refrain from placing aggressive bets and opt to wait for the release of US employment details, or the Nonfarm Payrolls (NFP) report, due on Friday.
NZD/USD declines to around 0.5870 in Tuesday’s Asian session.
Trump said the negotiations are Iran’s “last chance” to secure a deal to end the five-month conflict.
New Zealand’s employment report will be in the spotlight later on Wednesday.
The NZD/USD pair loses traction to near 0.5870 during the Asian trading hours on Tuesday, pressured by stronger US economic data and safe-haven flows. Traders brace for New Zealand’s employment report, which will be published later on Wednesday.
Business activity in the US manufacturing sector expanded at an accelerating pace in July, with the Institute for Supply Management’s (ISM) Manufacturing Purchasing Managers’ Index (PMI) climbing to 55.6 in July from 53.3 in June. This figure came in above the market consensus of 54.0.
Additionally, uncertainty surrounding US-Iran talks remains high, boosting a safe-haven currency such as the US Dollar (USD) against the New Zealand Dollar (NZD). US President Donald Trump said on Monday that he is giving Iran “every last chance” to reach a deal. Trump claimed that an agreement to reopen the Strait of Hormuz and denuclearize Tehran is “imminent.”
Nonetheless, Iranian officials denied participating in direct talks with the US, saying that they are negotiating with mediators in Oman.
New Zealand’s unemployment rate is expected to climb to 5.4% in the second quarter (Q2) from 5.3% in the previous reading. Any signs of improvement in New Zealand’s labor market could lift the Kiwi in the near term.
Analysts from ASB expect the Reserve Bank of New Zealand (RBNZ) to keep tightening toward a 3.25% year-end Official Cash Rate (OCR), while Westpac is forecasting hikes in September and December that would take the OCR to 3.75% within a year.
Kiwi support builds as RBNZ outlook firms on stronger labor signals
Strategists at Brown Brothers Harriman highlight that the recent “improvement in the ANZ Business employment intentions index to a five-month high in June points to more favorable labor market conditions.” They add that this firmer labor backdrop, combined with “above target inflation,” “argue for additional RBNZ rate hikes which is NZD supportive,” reinforcing the constructive policy and currency narrative around New Zealand.
Australia’s ANZ–Indeed Job Ads rose 2.0% in July, showing broad-based strength across states and industries.
The TD-MI Inflation Gauge jumped 1.0% in July, marking its first increase since April.
RBA Governor Bullock warned high underlying inflation could rise further, delaying prospective policy easing.
AUD/USD rises after two days of losses, hovering around 0.7010 during the Asian hours on Tuesday. The Australian Dollar (AUD) gained ground following the release of positive employment data, which showed that ANZ–Indeed Job Ads increased by 2.0% month-over-month in July. This rebound reversed a 0.2% decline from the previous month, marking the fourth monthly rise of the year. According to ANZ Senior Economist Catherine Birch, the growth was broad-based across both states and industries, reflecting robust labor demand even as the overall economy cools.
Meanwhile, renewed inflationary pressures are further supporting expectations of a cautious stance by the central bank. Data released on Monday showed the TD-MI Inflation Gauge rising 1.0% month-on-month in July, recovering from a 0.4% drop in June and marking its first gain since April. This uptick aligns with the Reserve Bank of Australia’s (RBA) June Meeting Minutes, which projected that underlying price pressures would intensify mid-year.
RBA Governor Michele Bullock recently emphasized that underlying inflation remains too high and warned of potential further increases driven by higher oil prices stemming from the conflict in Iran, strengthening the case for the RBA to hold off on policy easing.
RBA flags persistent inflation and resilient jobs market
BNY’s Geoff Yu notes that RBA Assistant Governor Sarah Hunter acknowledged that “inflation remains above the 2-3% target band” and stressed the central bank must “keep pressure on price growth so higher inflation expectations do not become entrenched.” On the labour market, Hunter judged that conditions are “still somewhat tight,” with job growth having held up “not too badly” over the first half of the year, underscoring ongoing resilience in employment despite softer headline price dynamics.
The AUD/USD pair gains ground as the US Dollar (USD) struggles on easing geopolitical tensions amid lingering hopes for a diplomatic breakthrough between the United States (US) and Iran. US President Donald Trump announced that his latest offer of talks is a “last chance” for Iran, following his decision to call off a major attack on the Islamic Republic. Trump expressed expectations that negotiations would begin shortly to reopen the Strait of Hormuz and address US concerns regarding Iran’s nuclear program.
USD/CAD is seen consolidating the previous day’s recovery gains amid mixed cues.
Recovering oil prices underpins the Loonie and acts as a headwind for spot prices.
The US-Iran uncertainty benefits the safe-haven USD and lends support to the pair.
The USD/CAD pair struggles to capitalize on the previous day’s modest recovery gains and oscillates in a narrow band during the Asian session on Tuesday. Spot prices currently trade just below the 1.4050 level, nearly unchanged for the day, amid mixed fundamental cues.
The uncertainty over US-Iran talks helps crude oil prices gain some positive traction, which underpins the commodity-linked Loonie and acts as a headwind for the USD/CAD pair. The safe-haven US Dollar (USD), on the other hand, benefits from fading optimism over a potential US-Iran peace deal, lending some support to the currency pair. In the latest developments, Iran said on Monday there were no talks underway with the US and also no plans for any meetings.
This contradicted US President Donald Trump, who has cited resumption of negotiations as justification for calling off attacks over the weekend. Moreover, unconfirmed reports of drone strikes on US assets in Kuwait prompt traders to again price in the geopolitical risk premium. This, in turn, assists the safe-haven Greenback to preserve the previous day’s solid recovery gains from its June 17 low and holds back USD/CAD bears from placing fresh bets.
Meanwhile, the US-Iran standoff over the Strait of Hormuz, along with Houthi rebels’ naval blockade against Saudi Arabia, fuels concerns regarding global energy supplies and triggers a modest uptick in crude oil prices. This could revive inflation fears and keep bets for at least one interest rate hike by the US Federal Reserve (Fed) firmly on the table, which favors USD bulls and warrants caution before positioning for any meaningful decline for the USD/CAD pair.
Rabobank’s Benjamin Picton characterises the recurring pattern around the Strait of Hormuz as a kind of “Groundhog Day” for markets, warning that “later in the week strikes typically resume, oil prices rally, equities sell, and bond yields rise.” He adds that while “there is every chance of that happening this week,” for now the market is left with the impression of “‘strikes for strikes’,” as participants weigh the risk of renewed escalation against the current lull.
GBP/USD softens to around 1.3425 in Tuesday’s early Asian session.
Trump insists Iran talks are underway; Iran denies any negotiations taking place.
US ISM Manufacturing PMI rose to 55.6 in July, stronger than expected.
The GBP/USD pair loses ground to near 1.3425 during the early Asian session on Tuesday. Uncertainty surrounding US-Iran talks drives traders toward a safe-haven currency such as the US Dollar (USD) against the British Pound (GBP). All eyes will be on the US July jobs data, which is due later on Friday.
US President Donald Trump on Monday claimed talks with Iran are ongoing, saying this is Tehran’s “last chance to sign a good document”. Trump added that he expected negotiations to begin in the next day or two to reopen the Strait of Hormuz and create a pathway for Iran to address the US’s concerns about its nuclear programme.
However, Tehran denied that talks with the US were taking place. Iran’s Foreign Ministry Spokesperson, Esmaeil Baghaei, stated that the country’s current focus was on negotiations with Oman over the Strait of Hormuz.
Furthermore, the upbeat US economic data provide some support to the Greenback and create a headwind for the major pair. Data released by the Institute for Supply Management (ISM) on Monday showed that the US Manufacturing Purchasing Managers’ Index (PMI) rose to 55.6 in July, up from 53.3 in June. This figure came in stronger than the market expectation of 54.0.
Last week, the Bank of England (BoE) voted 6-3 to hold the interest rates steady at 3.75%, with three policymakers favoring a rate hike. BoE Governor Andrew Bailey pushed back against expectations of an imminent tightening cycle, saying the disinflation process remains intact. Markets are now pricing in just one rate hike by the end of the year, while renewed US-Iran hostilities continue to add uncertainty to the economic outlook.
Pound struggles for support as BoE hawkish split meets Bailey’s dovish tone
Analysts at Rabobank highlight that “GBP net shorts bounced higher last week ahead of the BoE policy meeting,” underscoring a build-up in speculative bearish positioning on the Pound. They note that, despite “a more hawkish voting split than the market had expected from the MPC,” Governor Bailey’s “dovish” tone ultimately “suggest[ed] little support for the pound from the BoE,” leaving sentiment towards the currency constrained.
EUR/USD trades in a narrow range as traders await clarity on US-Iran negotiations.
Strong US manufacturing data and a stabilizing US Dollar cap the Euro’s upside.
Upcoming US employment data could shape expectations for the Fed’s next policy move.
EUR/USD trades in a narrow range on Monday as traders await clarity on US-Iran negotiations, while signs of stabilization in the US Dollar following the recent intervention-led weakness cap the Euro’s upside.
At the time of writing, the pair trades around 1.1515 after reaching an intraday high of 1.1558, its highest level since June 17.
US President Donald Trump said over the weekend that he had called off a planned strike on Iran, with negotiations expected to begin on Monday. However, Iranian Foreign Ministry spokesperson Esmaeil Baghaei said Tehran is not currently holding talks with Washington. The conflicting headlines keep geopolitical uncertainty alive and leave market sentiment cautious.
Traders also assess the latest business activity data from both sides of the Atlantic. The US ISM Manufacturing Purchasing Managers’ Index (PMI) rose to 55.6 in July from 53.3 in June, beating expectations of 54.0 and marking its highest reading since May 2022. The sector expanded for a seventh consecutive month following ten months of contraction.
Meanwhile, the Eurozone Manufacturing PMI improved to a three-month high of 51.9 from 51.4 in June, although it fell short of the market forecast of 52.0. The stronger-than-expected US reading offers some support to the US Dollar.
The US Dollar Index (DXY), which tracks the Greenback’s value against a basket of six major currencies, trades around 99.84 after rebounding from an intraday low of 99.42, its weakest level since June 15.
Dollar outlook darkens as Fed caution and US-Japan action sap confidence
Economists at DBS argue that “the greenback’s trajectory looks bleak in August after stumbling badly at the end of July,” with a combination of policy and geopolitical factors leaving the Dollar exposed. They highlight “the confluence of a Fed seemingly reluctant to hike, coordinated US-Japan currency interventions, and a cooling geopolitical landscape in the Middle East” as key forces that “keep the USD vulnerable.”
DBS notes that “Fed Chairman Kevin Warsh has unsettled investors who had amassed long USD positions betting on his hawkish credentials.” Instead of signalling that rates may rise, “Warsh used the July 28-29 FOMC meeting to focus on institutional reforms, especially scaling back forward guidance.”
Attention now turns to upcoming US employment data for fresh clues on the Fed’s policy path. The JOLTS Job Openings report is due on Tuesday, followed by ADP Employment Change on Wednesday and Nonfarm Payrolls (NFP) on Friday.
The dollar has come bottom of the G10 currency rankings for the past week.
The market does not believe that Kevin Warsh, the new Fed chairman, is a hawk.
Oil prices are falling, which is also putting pressure on the US dollar.
Higher GDP growth and inflation are fuelling expectations of interest rate rises in the eurozone.
The yen is strengthening following the first coordinated intervention by the US and Japan in 15 years.
In recent months, the market has repeatedly cast doubt on Donald Trump’s promises and announcements. This phenomenon has become so widespread that it has even been given its own name (TACO, i.e. Trump Always Chickens Out). In keeping with this motto, the US President backed down from a planned attack on Iran over the weekend, which, as he himself put it, was to be “the biggest since the Second World War”.
However, what proved more significant for the currency was investors’ scepticism regarding statements made by another US official. Kevin Warsh, the new Fed chairman, continued to emphasise his uncompromising stance on inflation, seeking to convince the markets of his supposed hawkishness. Whilst this was sufficient in June, by July investors were expecting much more.
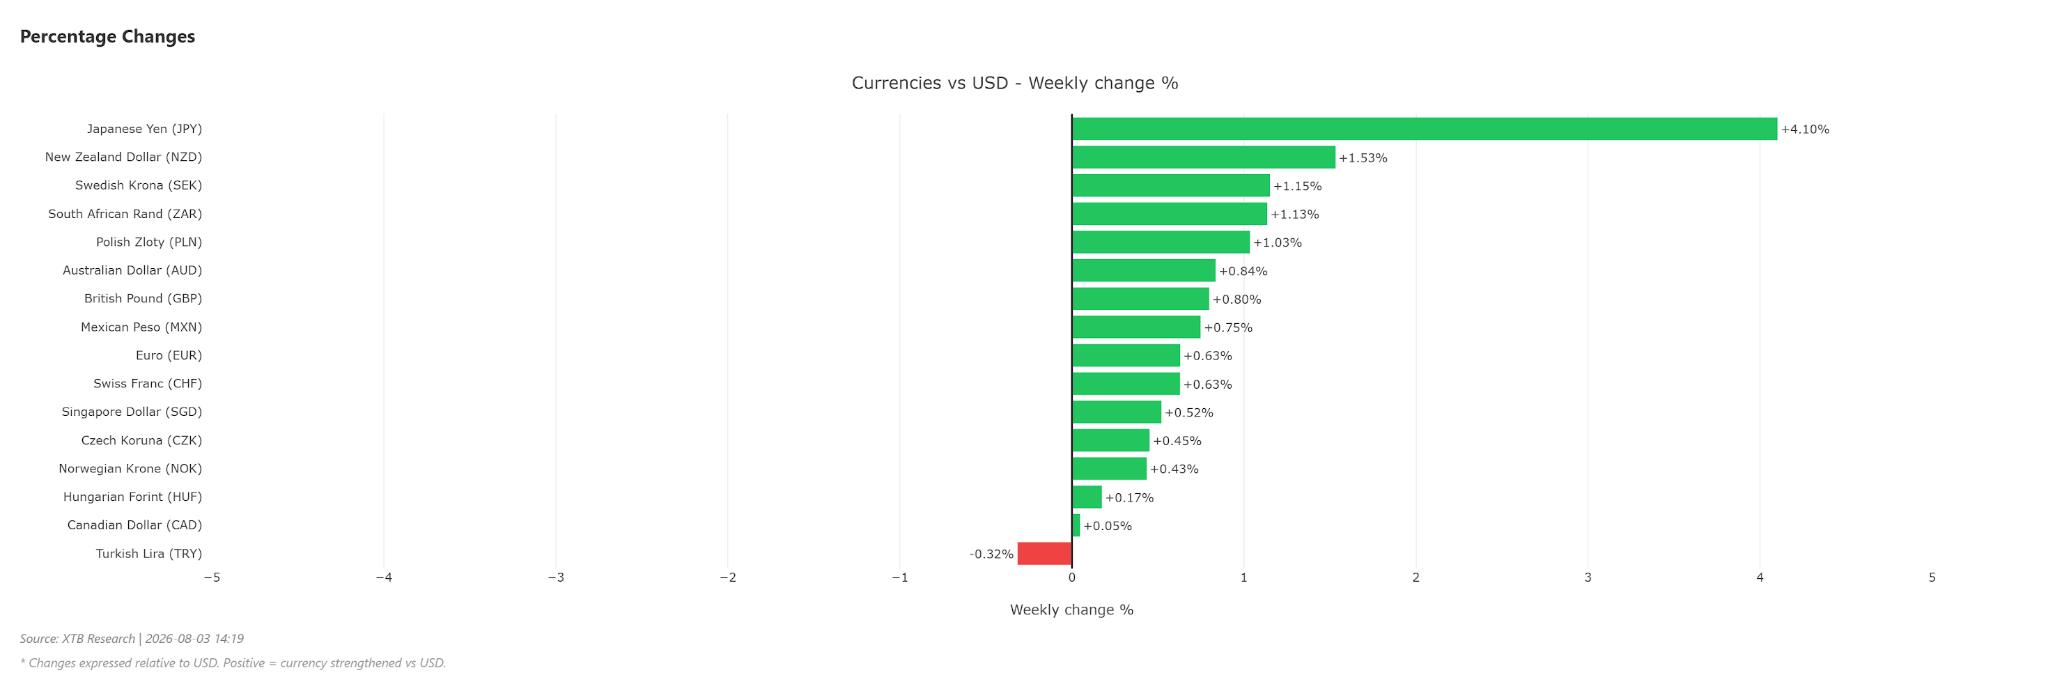
Chart 1: Exchange rates of selected currencies [vs. USD] (27 July – 3 August)
Source: Bloomberg, 3 August 2026 The US dollar has therefore come under pressure, weakening against almost every currency we analyse on a regular basis. Currencies with a higher beta (e.g. the Swedish krona or the Polish zloty) performed particularly well, as did those whose economies could suffer most from a deepening energy crisis (e.g. the South African rand or the South Korean won). At the very top of the list was, of course, the Japanese yen, which was bolstered last Thursday by the first joint currency intervention by the United States and Japan since 2011.
US dollar (USD)
The dollar is being weighed down by both the fall in energy commodity prices (of which it is a net exporter) and a dovish revision to market expectations regarding the Fed’s interest rate path. The Federal Open Market Committee (FOMC) decided last week to hold rates steady. The vote was 9 to 3. Only three policymakers voted in favour of a rate rise, and Warsh was not among them (the others were Beth Hammack, Neel Kashkari and Lorie Logan). During the conference itself, the Fed Chair stuck to his decision not to provide forward guidance. Although he spoke for nearly 45 minutes, few of the words that came out of his mouth were of any great significance from a market perspective. He avoided answering both questions regarding the justification for the pause and those concerning the current economic situation.
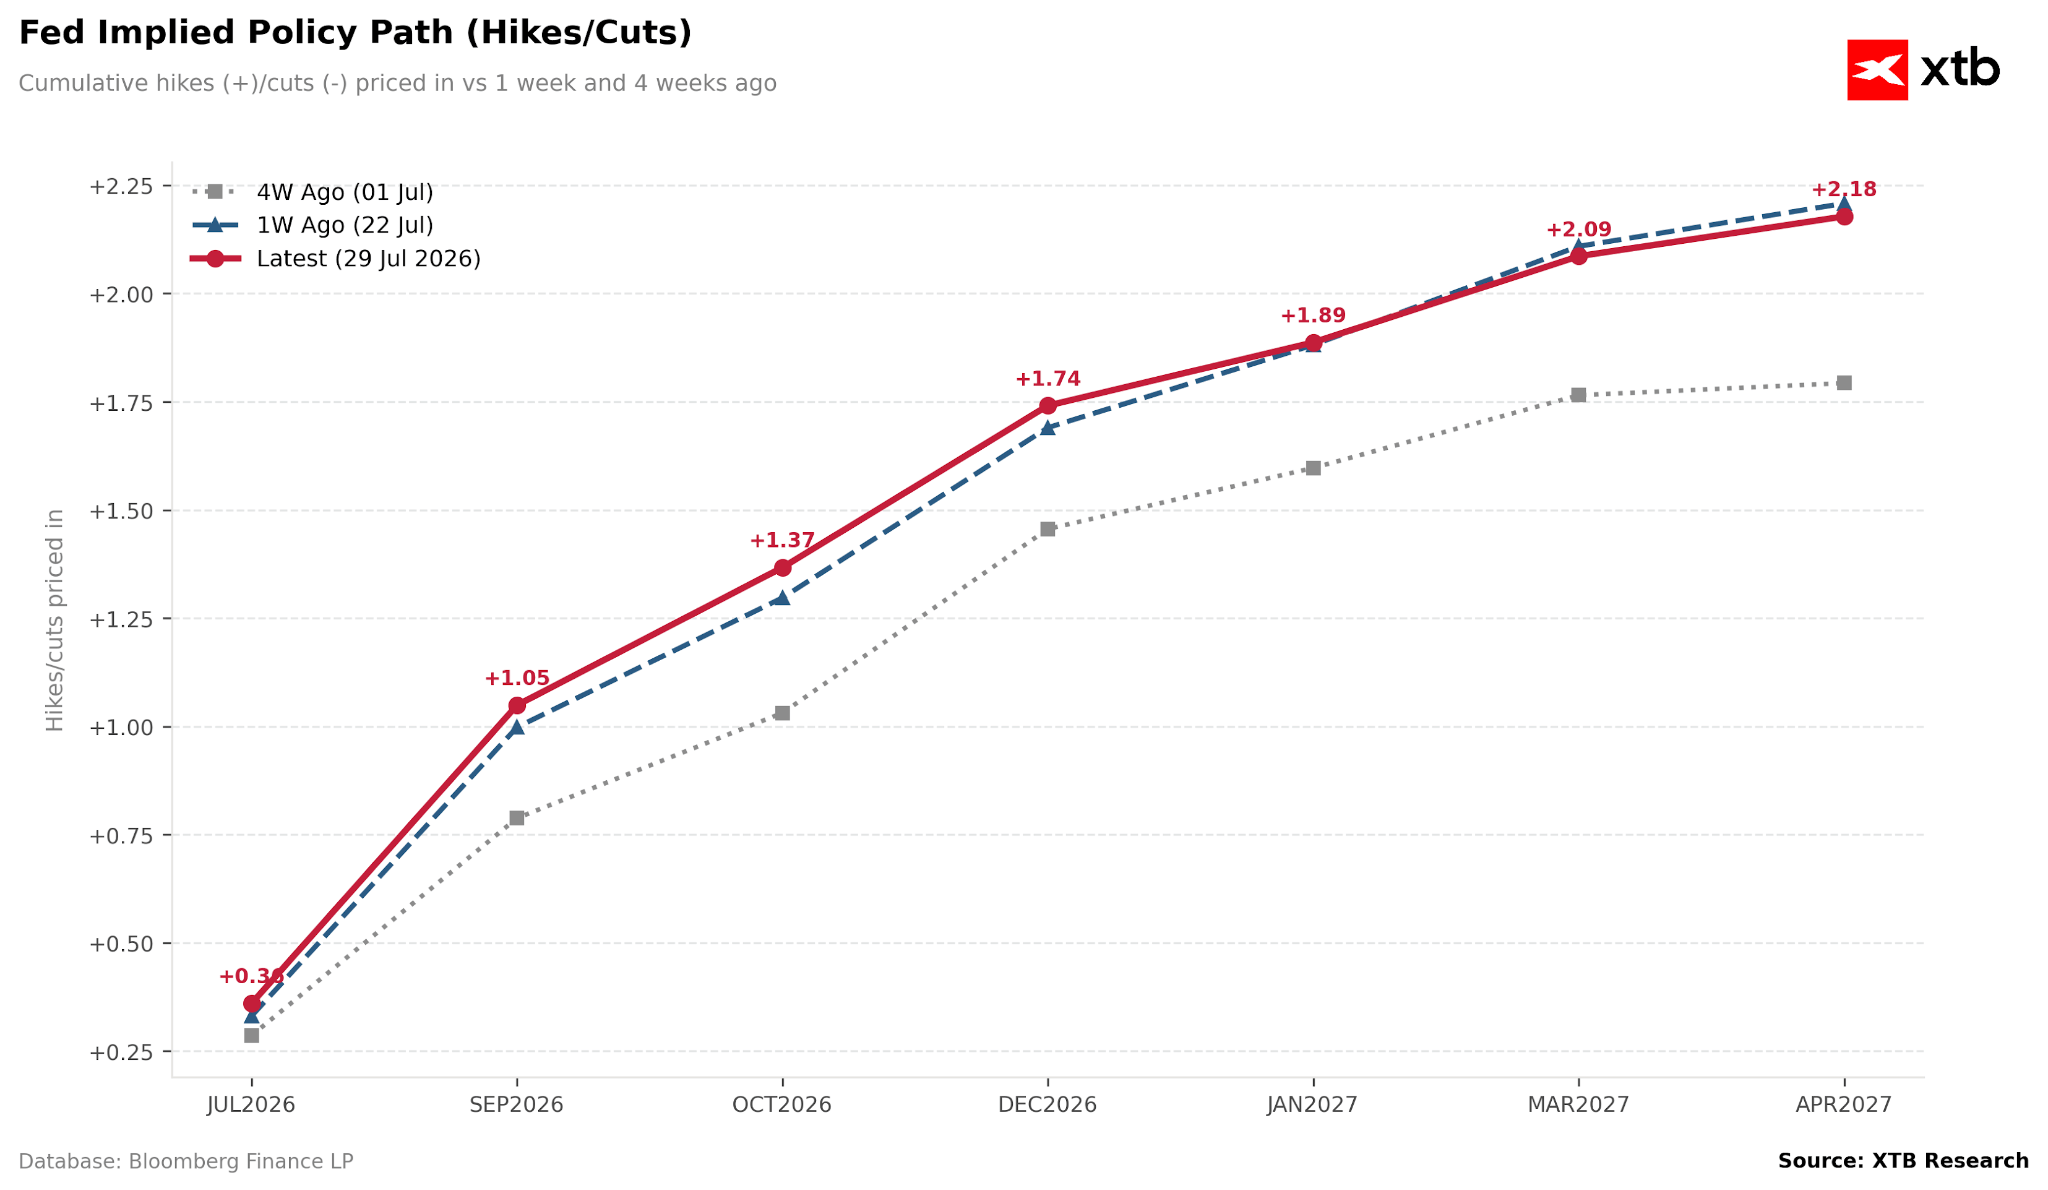
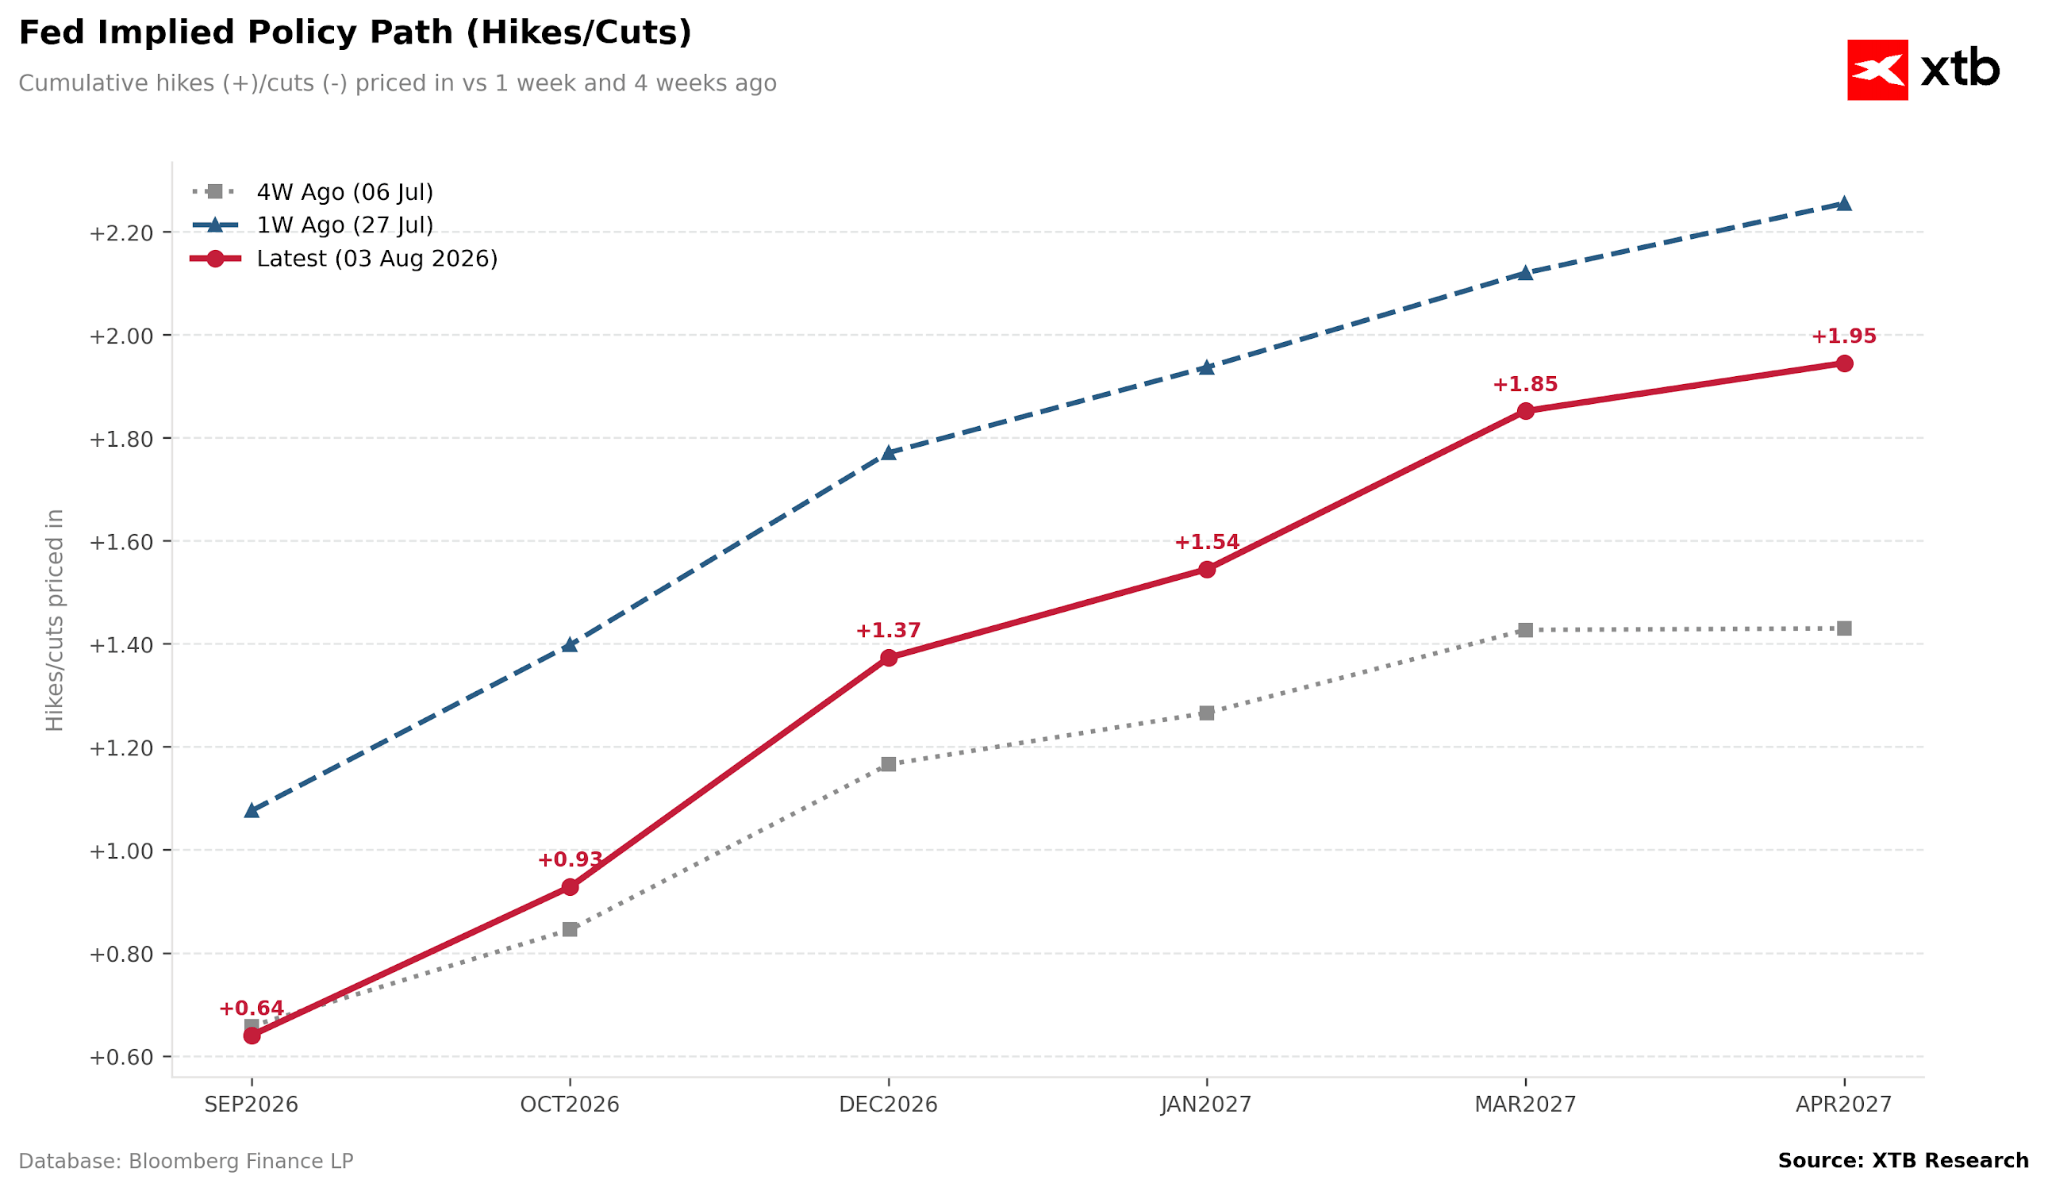
He mainly emphasised that the energy shock is hampering the committee’s work, and that the rise in CAPEX among hyperscalers should translate into future economic growth. This is largely consistent with his past comments on AI, when he argued that the productivity surge driven by artificial intelligence would, over time, have a disinflationary effect. The question is being raised once again as to whether Kevin Warsh is a dove in hawk’s clothing. The market seems increasingly sceptical that hawkish statements will be followed by concrete action, leading to a pullback in bets on interest rate rises. It currently assigns a probability of just over 60 per cent to a rate rise in September. Prior to the meeting, this was fully priced in. Chart 2: Market pricing of interest rate rises ahead of the FOMC decision (2026–2027)
Source: XTB Research, 29 July 2026 Chart 3: Market pricing of interest rate rises following the FOMC decision (2026–2027)
Source: XTB Research, 3 August 2026 It is worth recalling that almost exactly a year ago, he openly sided with the president, stating on FOX News that Donald Trump’s frustration with Powell’s conduct of monetary policy was entirely justified, and criticising the institution for being too slow to cut interest rates and for placing too much emphasis on historical economic data.
Euro (EUR)
In the eurozone, attention last week was focused not on monetary policy but on macroeconomic data. There are increasing signs that, following the pause in July, the time has come for a rate rise. The probability of a rate rise in September is estimated at almost 90 per cent. In recent days, both GDP growth (up 0.4 per cent quarter-on-quarter, compared with expectations of 0.2 per cent) and core inflation (2.5 per cent, consensus 2.4 per cent) have come in higher than expected. Both figures are consistent with further monetary tightening.
G10
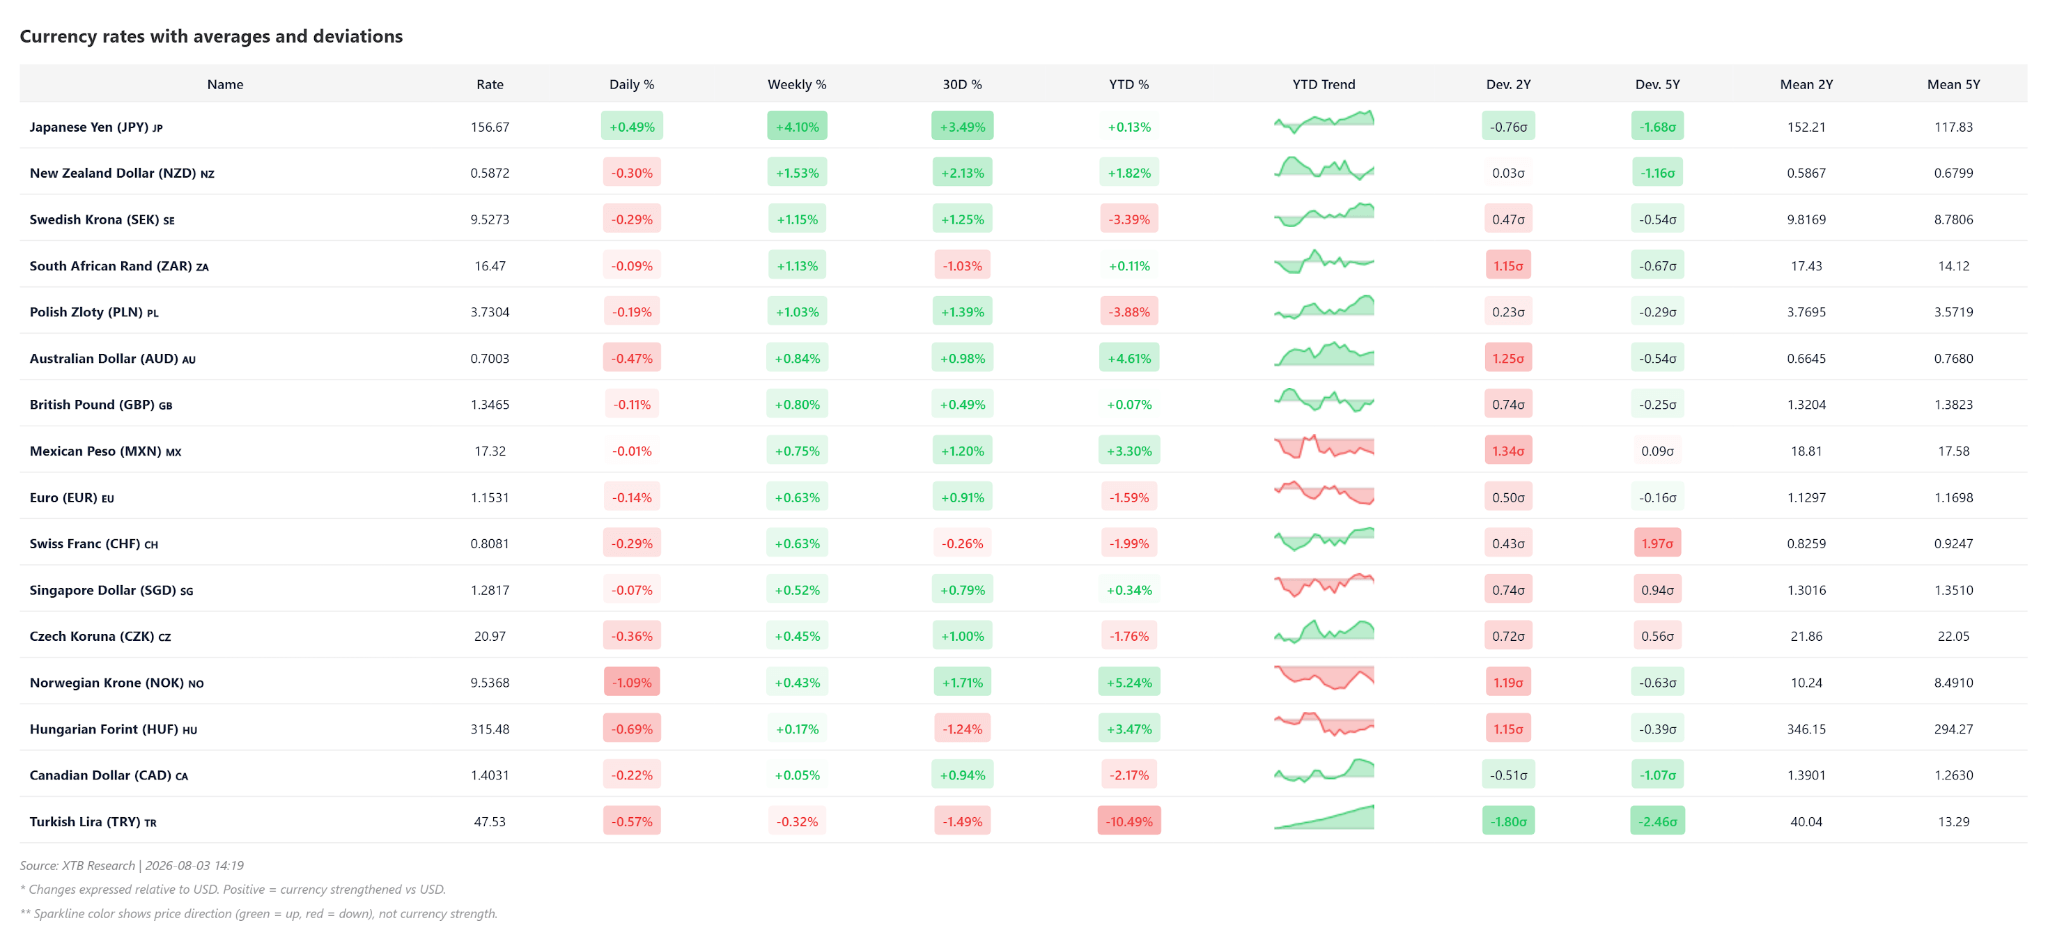
Chart 4: Exchange rates of selected currencies [vs. USD]
Source: Bloomberg, 3 August 2026
Japanese yen (JPY)
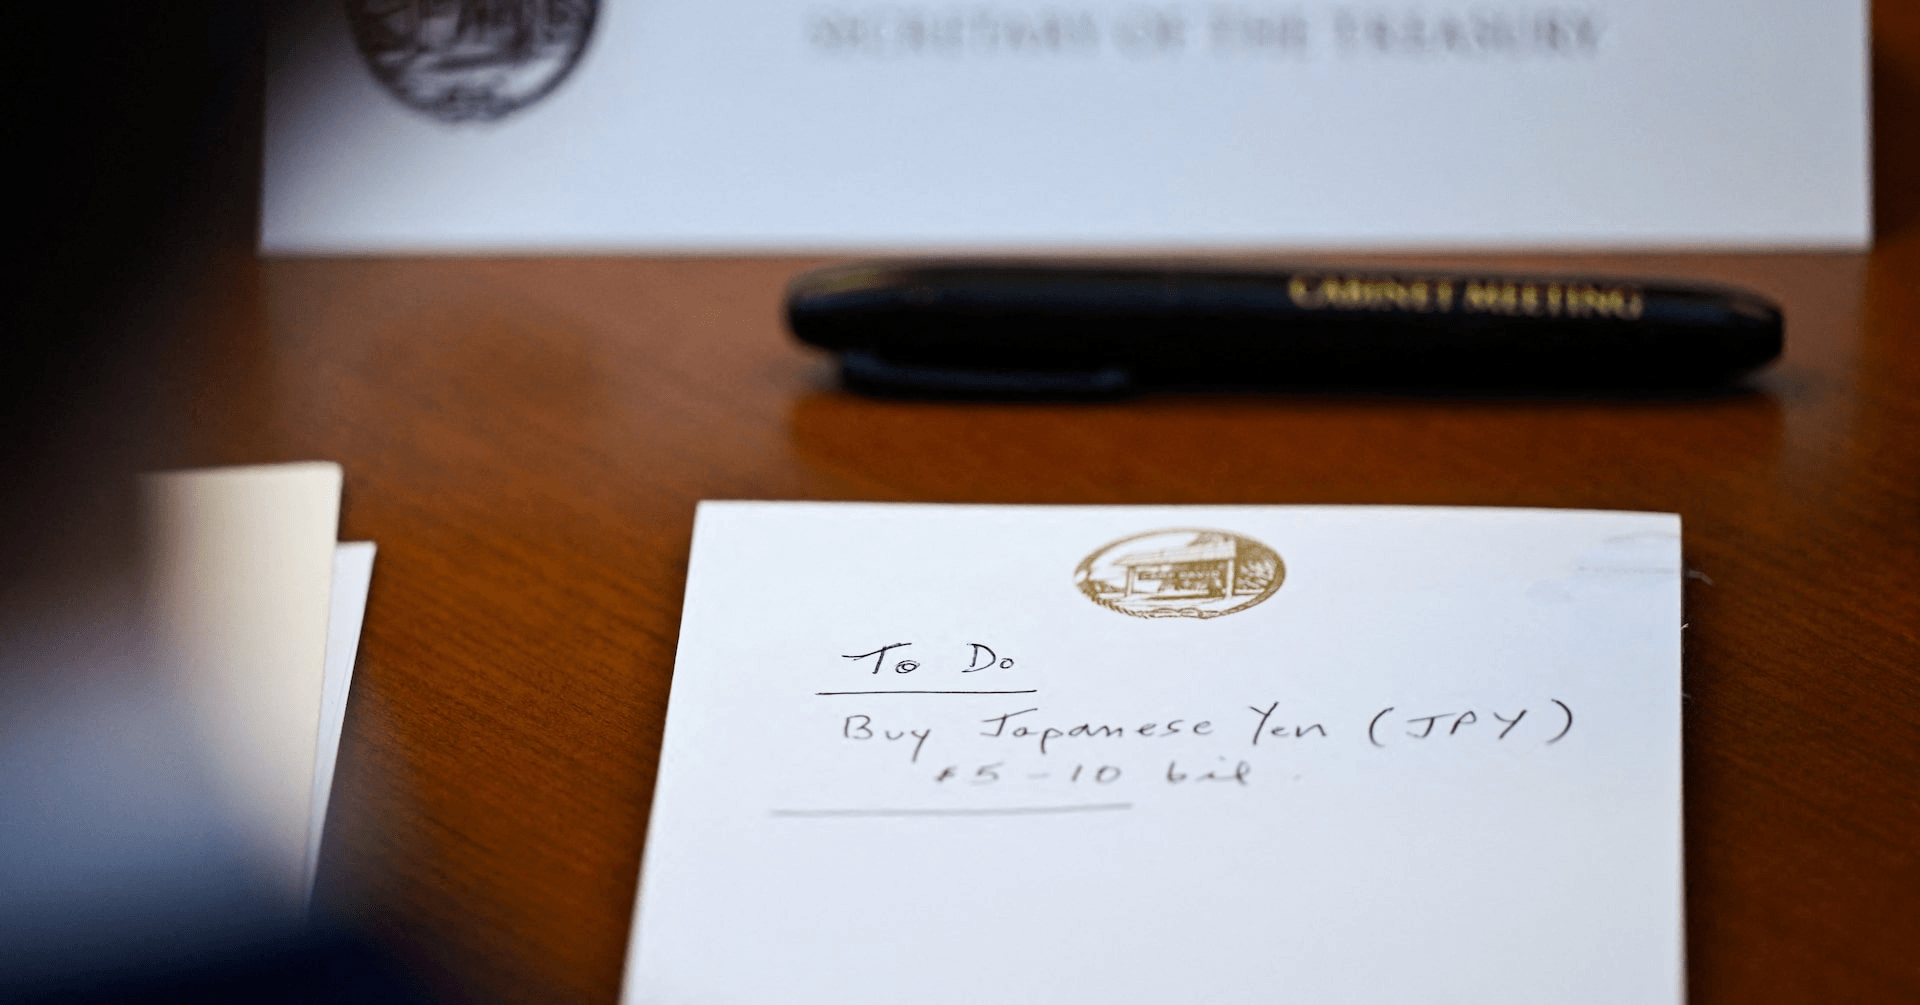
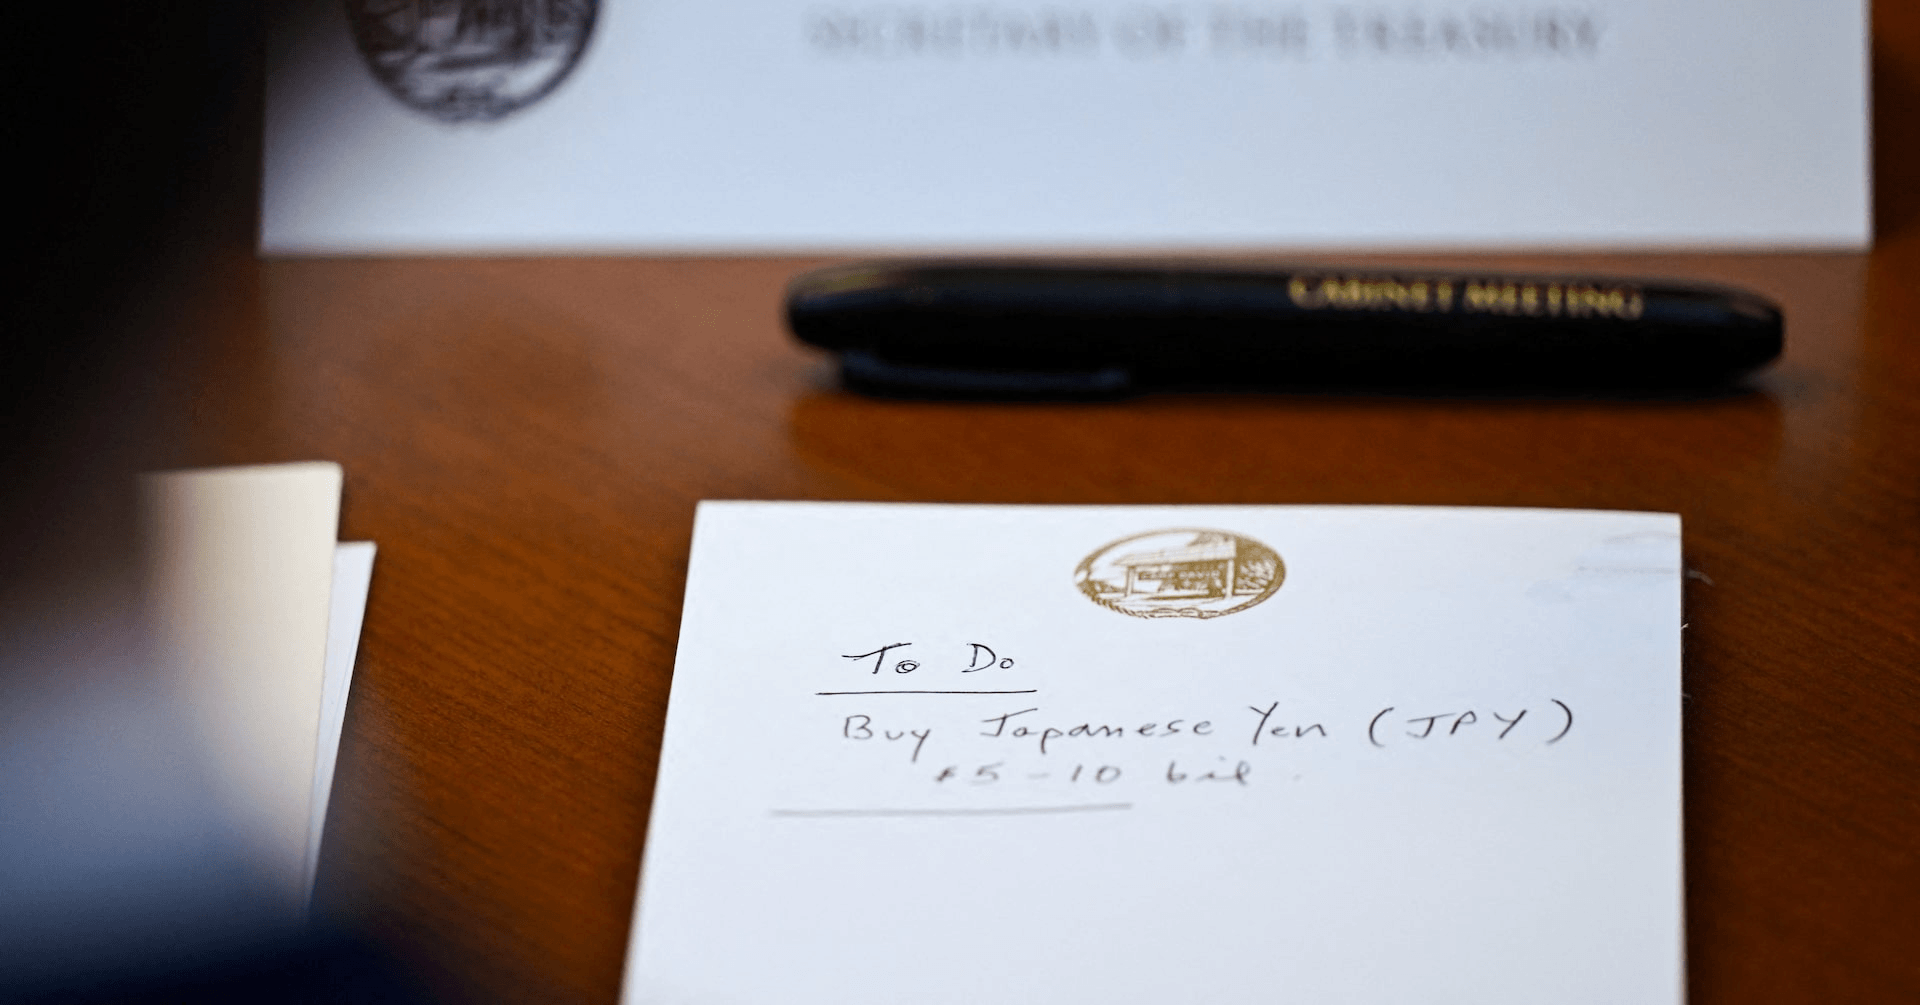
After reaching its highest level since 1986 (163.99), the USDJPY pair experienced a very sharp fall. This move was driven by the first coordinated intervention by the US and Japan since 2011. At that time, the yen had weakened following a massive earthquake. As emphasised by the US Treasury Secretary, Scott Bessent, and the Japanese Finance Minister, Satsuki Katayama, both sides remain ready to take further measures to stabilise the exchange rate. According to data provided by the Bank of Japan, the scale of the Japanese intervention may have reached as much as 59 billion dollars, which would be an unprecedented move (in terms of the scale of a single-day intervention). Although we cannot estimate the scale of US operations using official data, there are strong indications that it amounted to between 5 and 10 billion dollars. This is at least what is suggested by a note left by Scott Bessent during a meeting in Maryland.
Source: Reuters President Trump confirmed the US intervention at the weekend: “Japan has been very good to us, except, of course, for the attack on Pearl Harbour. (…) Their yen is weakening and they needed a bit of help. And we are always ready to help Japan.” Today, Minister Katayama published an official letter confirming the intervention.
After reaching its highest level since 1986 (163.99), the USDJPY pair recorded a very dynamic decline. The movement was driven by the first coordinated intervention by the US and Japan since 2011. At that time, the yen was weakened following a massive earthquake. US Treasury Secretary Scott Bessent and Japan’s Minister of Finance Satsuki Katayama emphasised that both sides are prepared to take further action to stabilise the exchange rate.
Historic intervention
According to data provided by the Bank of Japan, the scale of the Japanese intervention may have reached as much as 59 billion dollars, which would be unprecedented given the scale of a one-day intervention. Although we cannot estimate the scale of the US action using official data, many indications suggest it reached 5-10 billion dollars. This is suggested, at least, by a note left by Scott Bessent during a meeting in Maryland.
Source: Reuters The US intervention was confirmed over the weekend by President Trump: “Japan has been very good to us, except, of course, for the attack on Pearl Harbor. (…) They have a weakening yen and they needed a little help. And we are always ready to help Japan.” Today, an official letter confirming the intervention was published by Minister Katayama.
Is the Mar-a-Lago accord returning?
Due to US cooperation in the recent intervention aimed at strengthening the yen, the issue of broader White House policy is returning to the fore. A return to actions aimed at weakening the US currency, which would support domestic exports, seems possible. At the beginning of 2025, such actions were termed the “Mar-a-Lago Accord,” a modern attempt to repeat the premises of the 1985 Plaza Accord.
What is behind the earlier weakening of the yen?
Key to this was the return of the carry trade, i.e., trading on interest rate differentials.
How does this work?
This strategy is based on borrowing a currency (in this case, the yen) at near-zero interest rates and immediately exchanging it for another (e.g., the dollar) to make investments in a market offering higher returns. Although the Bank of Japan has moved away from its ultra-loose monetary policy and implemented five interest rate hikes in recent months, bringing the reference interest rate to its highest level in over 20 years (1%), it still remains far below levels seen in the United States (3.75%) and many other developed economies, such as Australia (4.35%), Norway (4.25%), the UK (3.75%), or the eurozone (2.4% – deposit rate).
BoJ holds rates
In line with market expectations, the Bank of Japan kept interest rates unchanged overnight from Thursday to Friday. The main interest rate remains at 1%. The decision was made by a vote of 8 to 1. One of the hawks, Hajime Takata, voted in favour of a hike. Due to government initiatives aimed at supporting households regarding energy prices, the BoJ revised down its inflation forecast for the 2026 fiscal year, lowering it from 2.8% to 2.5%. At the same time, the inflation forecast for 2027 was raised from 2.3% to 2.4%. The meeting was treated as a pause to assess the impact of recent tightening. Naoki Tamura, a board member, suggested the possibility of raising rates at intervals of a few months by 25 basis points until reaching a level of approx. 2%. This is largely consistent with market valuations. The market-implied probability of a hike in September can be compared to a coin toss. An upward move before the end of the year is fully priced in. It is possible that the BoJ will raise rates twice in the mentioned period.
What is the inflation situation?
The quarterly report published in July showed that households estimate prices will grow at a rate of 10.8% over the next five years. The survey has never shown such high values (though it should be noted that it has only been conducted for 20 years). Although this figure is inflated by the survey methodology – an average is presented, which is contaminated by irrationally high expectations of part of the society – the anxiety regarding rising price pressure cannot be underestimated. The median (5%) is also growing very dynamically, which may be a more reliable indicator in this regard. Inflation grew in the last four months by 0.4%, 0.1%, 0.4%, and 0.3% respectively on a monthly basis – when annualised, this data suggests price growth in the region of 4-5%. After excluding the most volatile energy and food prices, the situation looks better, but much still points to a significant rise in the indicator from current levels (1.6%). Significant factors may include, among others, relatively dynamic wage growth (3.2% in May).
Dependence on energy imports
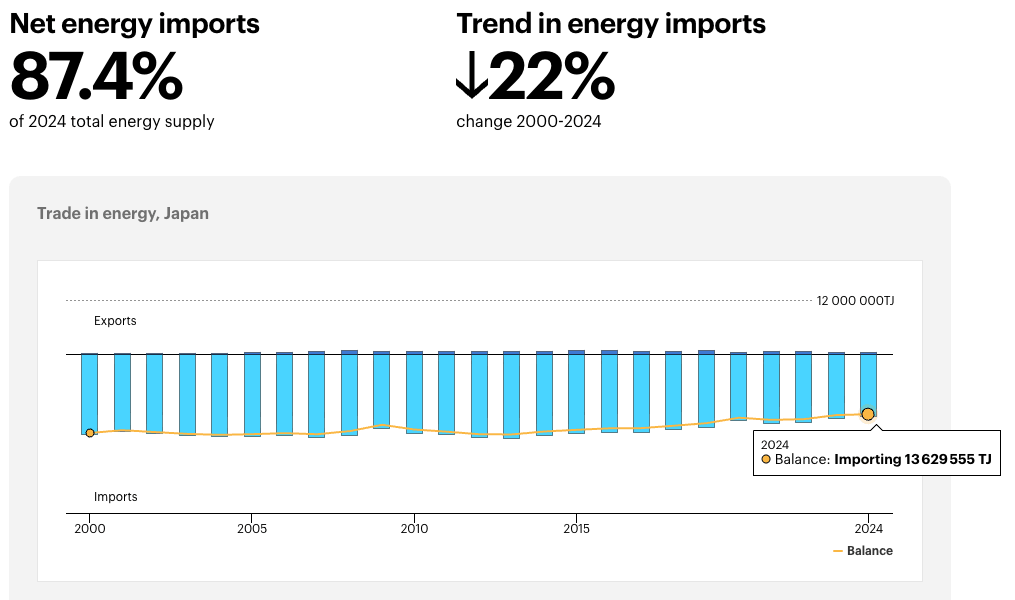
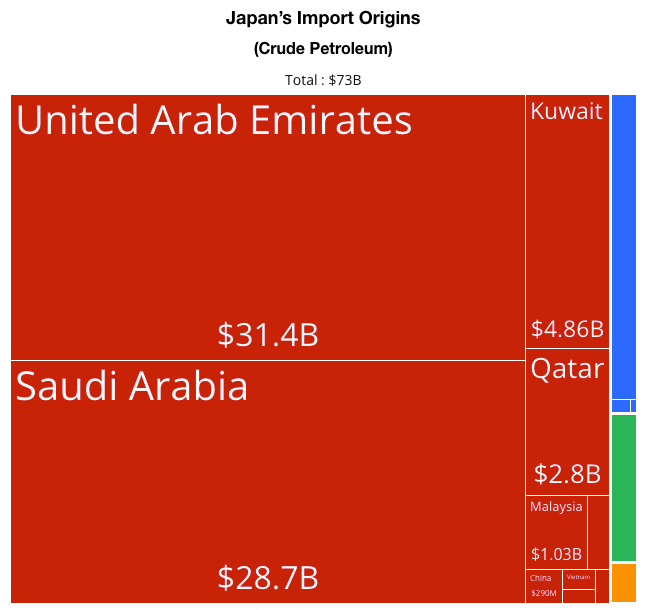
A weaker yen is not just a matter of carry trade. The outbreak of war in the Middle East plays a significantly important role, which brought oil and LNG prices to their highest levels since 2022, when Russia launched a full-scale attack on Ukraine. Nearly 90% of Japan’s energy demand comes from imports, and under normal conditions, its main suppliers are Middle Eastern countries.
Figure 1: Japan’s Energy Sector Trade Balance (1998 – 2026)
Source: IEA, 03.08.2026 The prolonged lack of de-escalation in the conflict between the United States and Iran may translate not only into a significant increase in inflationary pressure but also into problems maintaining the continuity of key energy resource supplies. Figure 2: Structure of Japan’s Crude Oil Imports (2024)
Source: OEC, 03.08.2026
Technical analysis
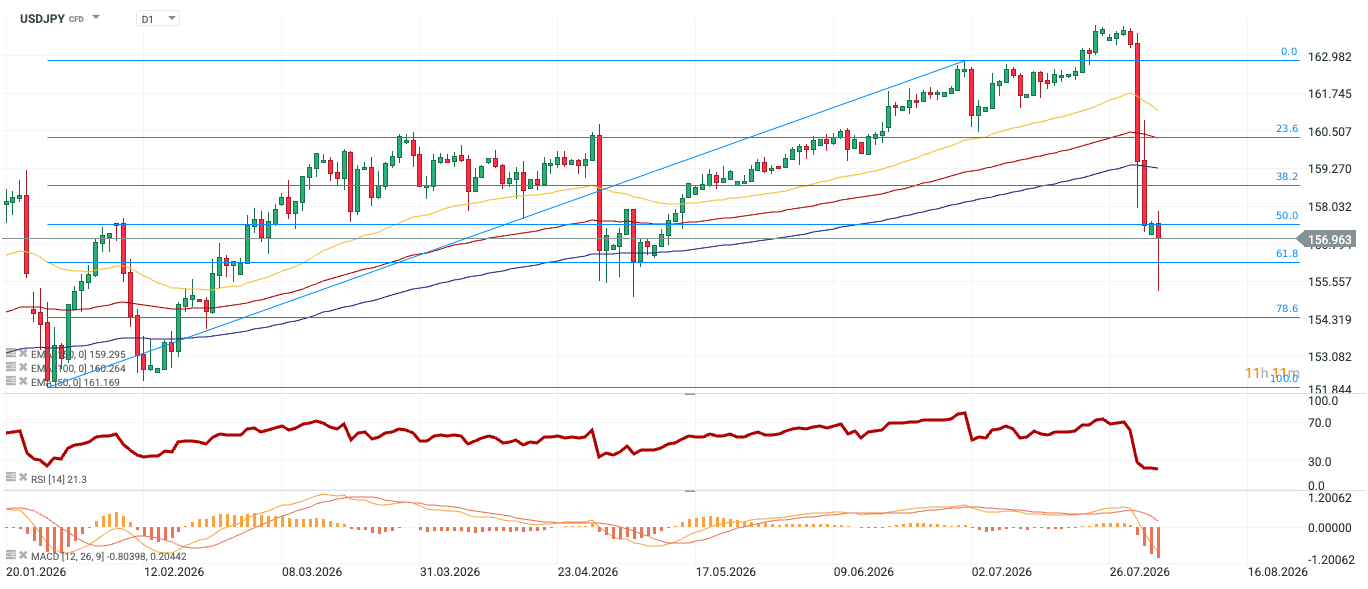
Figure 3: USDJPY [D1] (20.01.2026 – 03.08.2026)
Source: xStation, 03.08.2026 After reaching a local peak near the 164 level, the market experienced a sharp collapse. The price broke through key structural supports with momentum and is currently in the 157 region. It is worth noting, however, that a long lower wick formed on one of the recent candles – this signifies the first serious attempt at defence and a reaction from demand. The price drastically broke down through the band of moving averages (EMA 50, EMA 100, and EMA 200). For a long time, these averages (blue, red, and yellow lines) served as dynamic supports in the uptrend. Currently, this setup has been negated. The closest of them (blue, around 159.3) now constitutes the first very important dynamic resistance in the case of a possible rebound.
The long lower wick of the bearish candle tested the 78.6 Fibo retracement. Currently, the price has rebounded and is fighting to hold above the 61.8 retracement. The RSI indicator is at the 21.3 level. This is an extreme oversold zone (below 30). Although in strong downtrends, the RSI can stay in this zone for a long time, such a low value is a strong warning signal of a possible upward correction or at least a transition into consolidation to “cool down” the indicator. MACD confirms a strong downtrend. The lines have crossed downwards and are moving away from the zero level, and the histogram is growing in the negative zone. There are no divergences here at this moment.
To provide the best experiences, we use technologies like cookies to store and/or access device information. Consenting to these technologies will allow us to process data such as browsing behavior or unique IDs on this site. Not consenting or withdrawing consent, may adversely affect certain features and functions.
Functional
Always active
The technical storage or access is strictly necessary for the legitimate purpose of enabling the use of a specific service explicitly requested by the subscriber or user, or for the sole purpose of carrying out the transmission of a communication over an electronic communications network.
Preferences
The technical storage or access is necessary for the legitimate purpose of storing preferences that are not requested by the subscriber or user.
Statistics
The technical storage or access that is used exclusively for statistical purposes.The technical storage or access that is used exclusively for anonymous statistical purposes. Without a subpoena, voluntary compliance on the part of your Internet Service Provider, or additional records from a third party, information stored or retrieved for this purpose alone cannot usually be used to identify you.
Marketing
The technical storage or access is required to create user profiles to send advertising, or to track the user on a website or across several websites for similar marketing purposes.