Currency Hedger No Comments

The Week Ahead

The Week Ahead:

Risk is back, as we wait for payrolls Stocks are in a buoyant mood as we start August. Futures are in positive territory on Monday, with European indices expected to open higher today, and US futures expected to carry on last weekโ€™s rally. The Nasdaq is currently expected to open higher by more than 0.8%. Last week, US stocks made a stunning comeback from Thursday onwards and the gains are expected to continue this week. The question now is, can US indices outperform their European counterparts this week, after falling behind for the past month?

Oil price boost for markets

The 5% drop in the oil price is also helping to boost sentiment. Overnight, President Trump said that negotiations to find a peace deal with Iran could start today, which has led Brent crude to fall back towards $83 per barrel. This will ease inflation fears and could also act as a dampener on bond yields, which rose sharply last week, especially at the long end, where 30-year US Treasury yields jumped to their highest level for 19 years.

Economic data and earnings to spur price action

This is another huge week for financial markets. Firstly, there is a large amount of fresh economic data, including the latest labour market data from the US. 20% of the S&P 500 report earnings this week, including Palantir and SanDisk. SpaceX will also release its first earnings report on Tuesday. The market wants to know if the tech selloff is over, what the yen will do next after unprecedented multilateral intervention to prop up the currency, and US Treasury yields are also in focus. If anyone thought things would be quiet for markets this August, they are only heating up.

3 main themes dominate markets

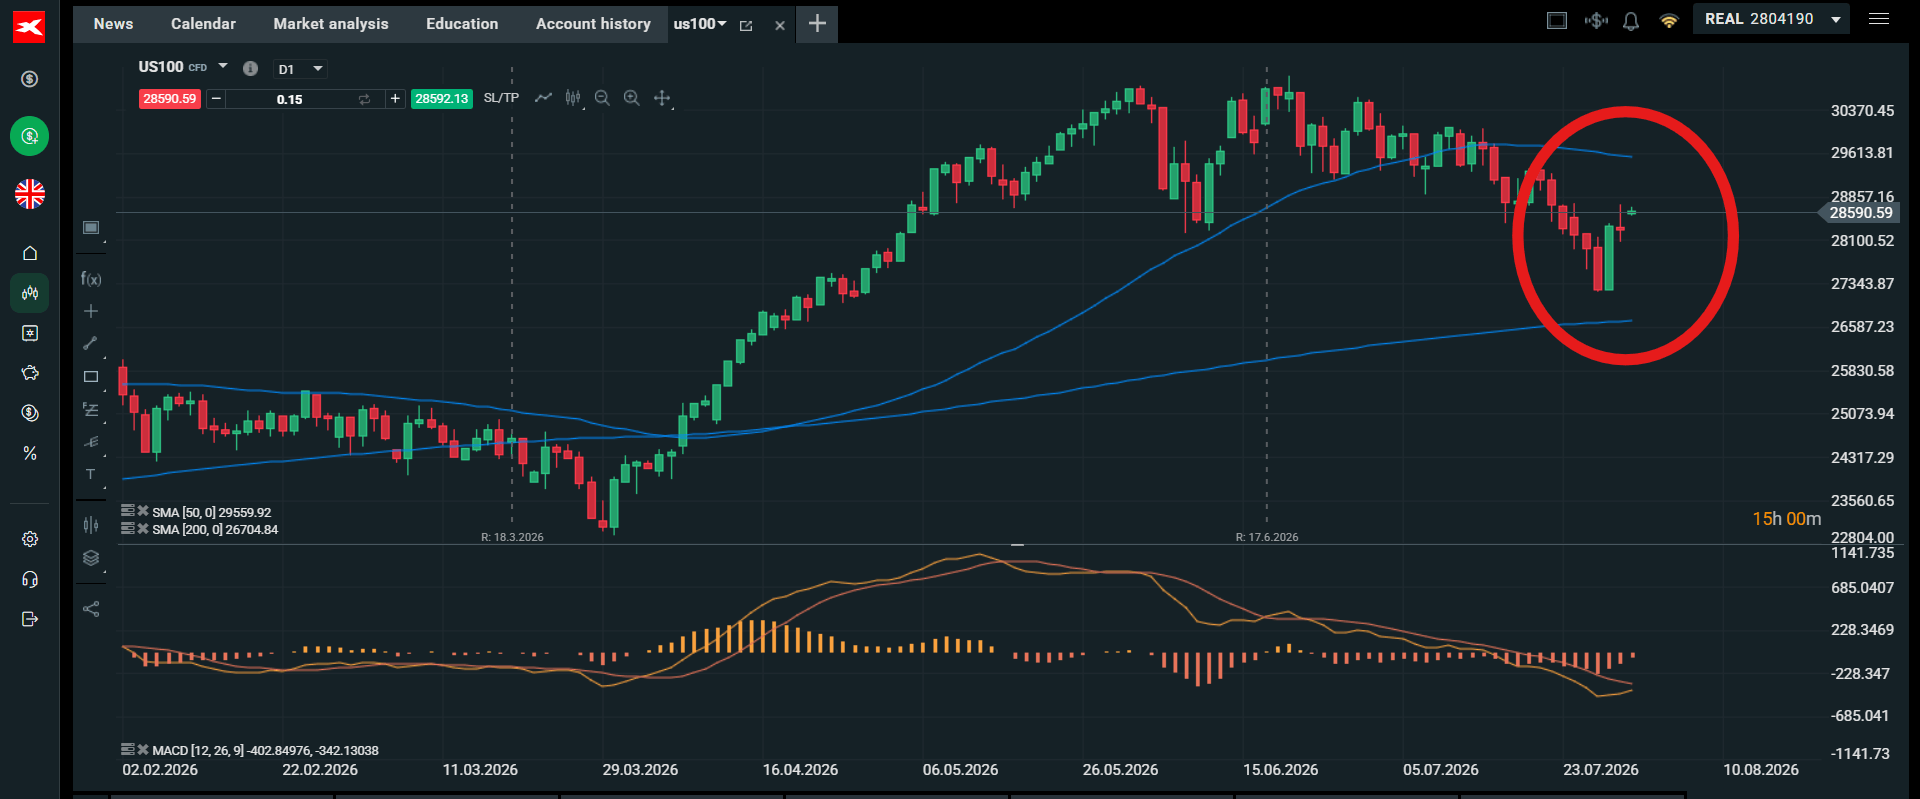
Last week three main narratives dominated price action as we rounded off July trading. The first was a week of two halves for the tech trade. The first half of the week saw severe tech deleveraging, which included a 17% sell off for South Koreaโ€™s Kospi index. Then came tech earnings, and a powerful rally on Thursday that drove Microsoft higher by 16%, and gave hope that the severe drawdown in the AI favourites, that started on 22nd June, could be at an end.

Nasdaq 100
Source: XTB

Microsoft winning the AI race

The rally in Microsoft is symbolic for a few reasons. Last weekโ€™s Q2 results showed that Copilot could be a big winner in enterprise AI. It increased the number of subscriptions to 30mn and is part of the Microsoft 365 suite of products. Thus, it is already well integrated into products that hundreds of millions of people use every day, and the growth trajectory is huge for Microsoft, which has now proven that it can monetize its AI investments.

Can chip stocks make a comeback?

Value in the tech space is shifting to some of the big Magnificent 7 names, after a bruising start to the year. However, there could also be a recovery in the chip sector. Several of the Magnificent 7 including Alphabet, Meta, Microsoft and Amazon are all increasing their AI capex plans for this year, which should give the AI trade another late summer burst of energy.

Did the AI trade reach a bottom?

Due to both of these factors, we could have seen the short-term bottom in the tech sell off as we march further into Q3. The question now, is there a strong rally ahead of us when August and September are traditionally the worst months for stock market returns?

USD/JPY in focus

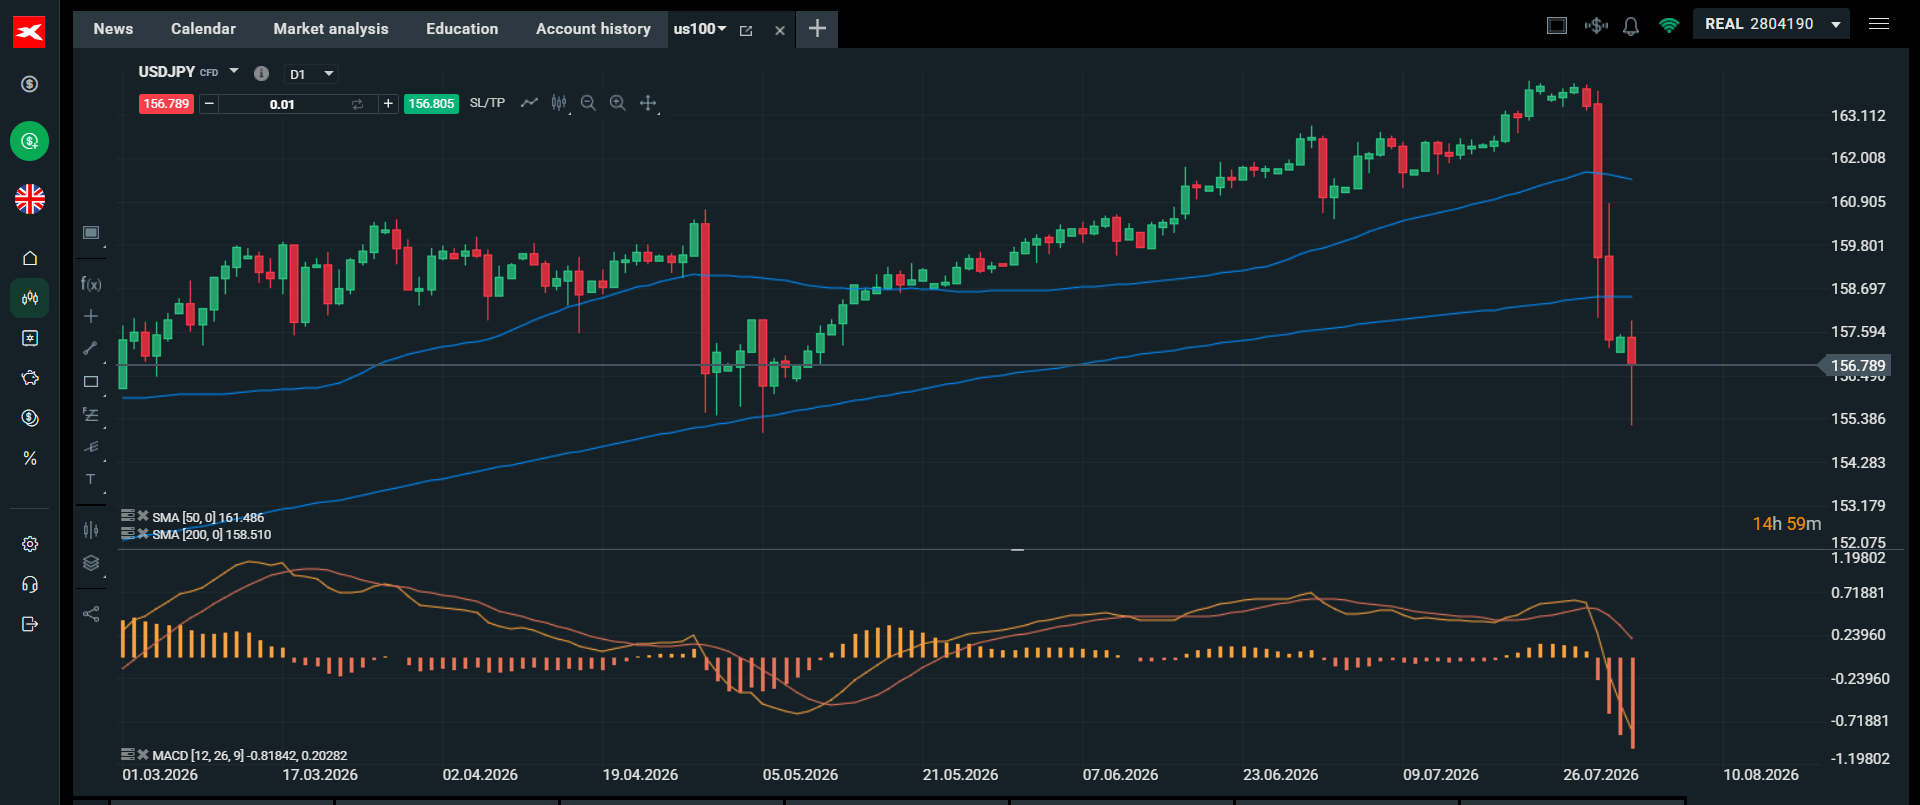
The second narrative that dominated the market last week was the intervention in the yen. USD/JPY fell more than 4% last week, At the start of the week, the yen is higher by another 0.5% vs the USD and is trading at 156.60. The intervention came after a surprise hold from the Bank of Japan sent the yen sharply lower. The confirmed intervention cost the Japanese authorities $50bn, with another $10bn of support coming from the US and potentially South Korea. This time the intervention worked, but the question is, for how long? FX intervention and manually propping up a currency does not have a strong track record of working in the long term, and this rate of FX intervention is unstainable over longer time periods. Thus, will the market test the resolve of the authorities? Although the yen is off to a strong start on Monday, if it does drop this week then it will put dramatic pressure on the Bank of Japan to raise interest rates in the coming months to try and naturally boost yen strength.

USD/JPY
Source: XTB

The fallout from the Fed

The third narrative from last week was Treasury yields. Long end yields surged, the US Treasury yield curve steepened sharply, the 2s-10s yield curve is 48bps, while the 2s-30s yield curve is at 98bps, up 18bps last week, which is a huge move in one week. The 10-year yield closed the week at 4.69%, while the 30-year yield rose to its highest level since 2007 and closed the week at 5.23%. The impact on the housing market could be severe and is worth watching in the coming months. Yields are rising in the US even though the Fed kept interest rates unchanged at last weekโ€™s meeting. When rates are on pause, it is natural for the yield curve to steepen, after all, inflation is above the target rate. However, it is the unrelenting rise in yields that could unnerve investors. Interetsingly, stress in the long end of the US yield curve did not impact the global equity market rally at the end of last week.

However, if yields do keep surging, then we could see pressure in the equity space. While the Fedโ€™s message was blamed for causing the volatility in the US Treasury curve, we think that this is unfair. Fed chair Kevin Warsh reiterated that the Fed would return US inflation back to the target rate, and there are some who think that he is nearly as hawkish as the three dissenting members of the FOMC who voted to hike rates last week. Interetsingly, Treasury yields are rising at the same time as the Fed is shifting to a potentially hawkish stance when there are signs that inflation is moderating and the labour market is weakening. PCE inflation was weaker than expected for Q2, and the labour market was much weaker than expected in June, we need to see if the pattern reoccurs for July.

However, yields are also rising because there is huge supply of debt. It is not just governments who are funding their activities with debt, the AI infrastructure build out is also increasingly funded by debt. When supply outstrips demand, yields have to rise to attract investors. Thus, we may not see bond yields moderate any time soon. The key questions that investors are asking as we start a new week, where will the oil price go next? Have tech stocks, specifically chip stocks, bottomed out, and will a sell off in long end Treasury yields hurt equities? Below, we look at the two main events to watch in the week ahead:

1, Non Farm Payrolls

While the focus on Monday is on an improving geopolitical backdrop and a falling oil price, the focus as we move through the week will be the US Non Fram Payrolls report, which will be another test of the resilience of the US labour market. This is a pivotal release for financial markets, and there are 4 things in this report that are worth watching. These include the payrolls number, the unemployment rate, wage growth and the labour force participation rate. This data will help to define the future of Fed policy, and could be a major market-moving event, especially since the Fed is no longer offering forward guidance. The Fed is particularly worried about demand side inflation fears and a wage-price spiral, so the wage data is worth watching closely. Economists currently expect a 91k increase in payrolls and for the unemployment rate to tick up a notch to 4.3%. If we get a major surprise in the data then USD/JPY is worth watching closely to see if an upside surprise weighs on the yen .

2, Earnings

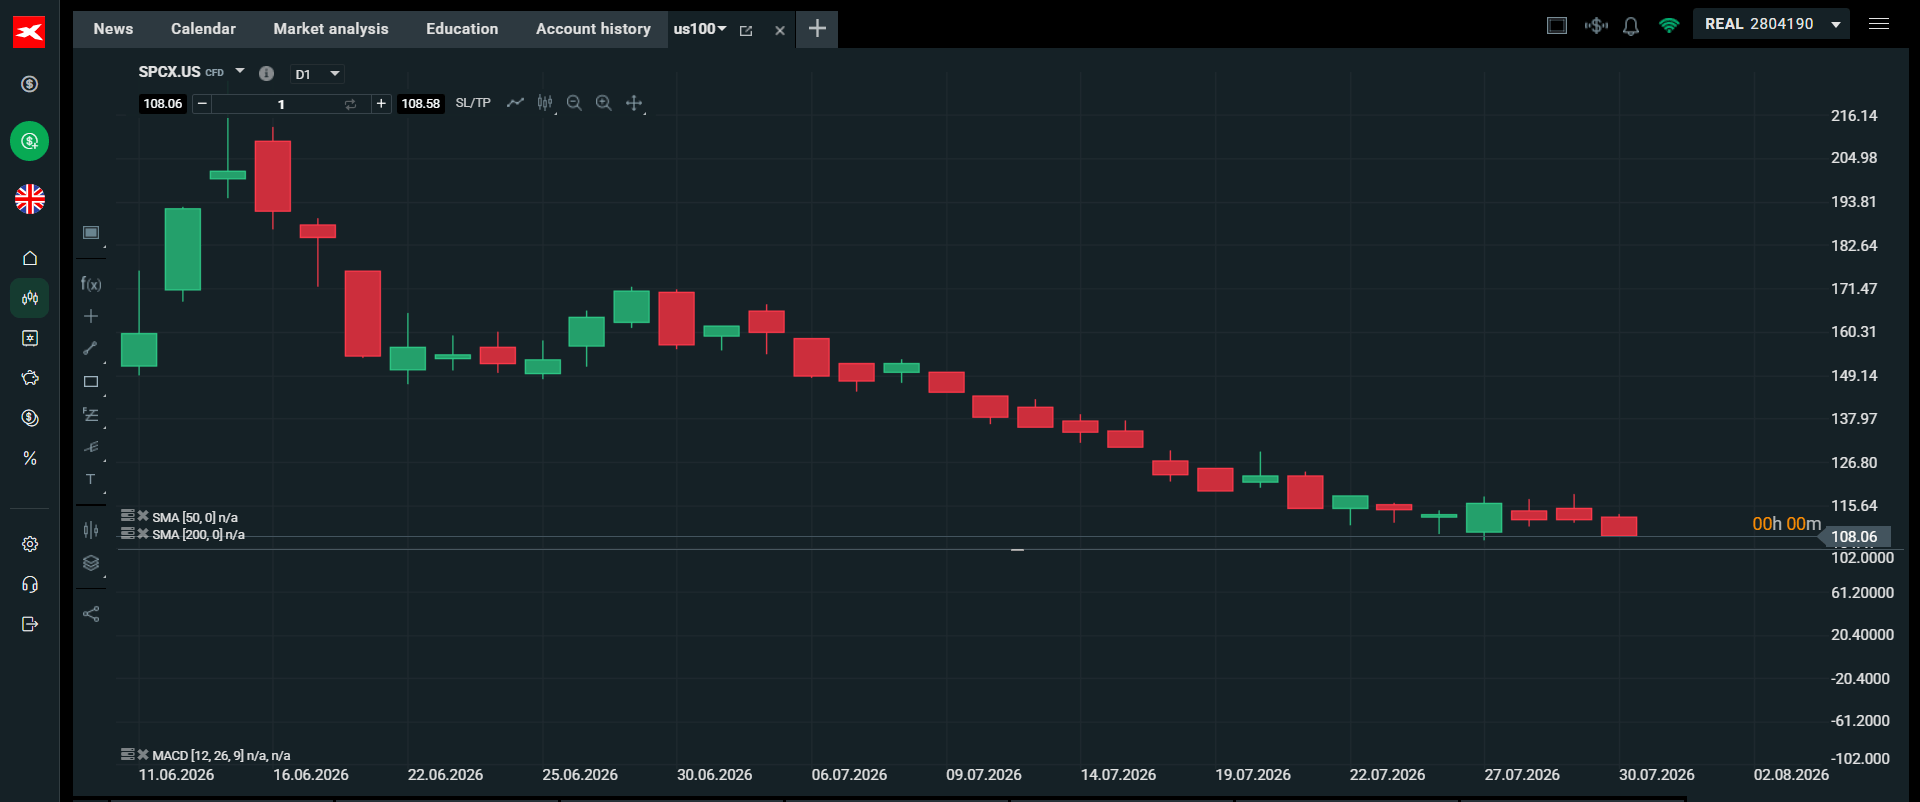
This is a massive week for earnings reports on both sides of the Atlantic. Tech earnings will be watched closely after strong reports for Microsoft and Amazon helped to spur a major rally. Apple did not impress with last weekโ€™s report, and its stock price slumped more than 7% on Friday, although it did show signs of stabilization overnight. Palantir, SpaceX and SanDisk are the highlights in the US earnings calendar for this week. SpaceXโ€™s share price dropped sharply last week and fell 3% on Friday. It closed the week at a record low below $110. The question now is, can the earnings report, especially forecasts of future revenue, help the stock price to recover?

SpaceX
Source: XTB

Currency Hedger No Comments

Swiss Franc declines against US Dollar amid hawkish Fed bets

  • The Swiss Franc weakens against the US Dollar amid firm Fed interest rate hike expectations.
  • The US and Iran announce ceasefire 2.0 as Tehran agrees to Hormuz reopening and nuclear terms.
  • Investors await the US NFP data for fresh cues regarding the Fed’s monetary policy outlook.

The Swiss Franc (CHF) trades lower against its major currency peers at the start of the week. The USD/CHF pair rises 0.15% to near 0.8082 as a market-sentiment revival following the announcement of a ceasefire in the Middle East has diminished the appeal of safe-haven assets.

Swiss Franc Price Today

The table below shows the percentage change of Swiss Franc (CHF) against listed major currencies today. Swiss Franc was the weakest against the Japanese Yen.

USDEURGBPJPYCADAUDNZDCHF
USD-0.01%0.13%-0.47%0.09%-0.13%-0.08%0.17%
EUR0.01%0.13%-0.51%0.10%-0.14%-0.03%0.15%
GBP-0.13%-0.13%-0.59%-0.06%-0.26%-0.16%0.04%
JPY0.47%0.51%0.59%0.51%0.27%0.40%0.55%
CAD-0.09%-0.10%0.06%-0.51%-0.23%-0.11%0.03%
AUD0.13%0.14%0.26%-0.27%0.23%0.10%0.29%
NZD0.08%0.03%0.16%-0.40%0.11%-0.10%0.21%
CHF-0.17%-0.15%-0.04%-0.55%-0.03%-0.29%-0.21%

The heat map shows percentage changes of major currencies against each other. The base currency is picked from the left column, while the quote currency is picked from the top row. For example, if you pick the Swiss Franc from the left column and move along the horizontal line to the US Dollar, the percentage change displayed in the box will represent CHF (base)/USD (quote).

Over the weekend, United States (US) President Donald Trump shelved planned attacks on Iran, clarifying that Tehran agreed to the nuclear deal and the reopening of the Strait of Hormuz.

At press time, S&P 500 futures are 0.6% higher to near 7,535, reflecting a risk-on mood. The US Dollar Index (DXY), which tracks the Greenbackโ€™s value against six major currencies, trades 0.1% lower to near 99.70.

Though the US Dollar Index is also down, it is trading higher against the Swiss Franc amid expectations that the Federal Reserve (Fed) will raise interest rates in the near term.

According to TD Securities, the strength of underlying US activity is increasingly calling into question how tight current Fed policy actually is, with the bank noting that โ€œrobust activity is also another sign that policy may not be that restrictive.โ€ At the same time, TD Securities cautions that inflation dynamics remain critical: โ€œIf core services inflation continues to prove sticky, that would likely be enough to motivate the Fed to tighten policy,โ€ its analysts warn, highlighting the risk that persistent price pressures in the services sector could still force additional action from the central bank.

Meanwhile, the CME FedWatch tool shows a 64.6% chance that the Fed will raise interest rates in the September policy meeting.

This week, investors will focus on a string of US economic data, notably the Nonfarm Payrolls (NFP) data for July, which will be released on Friday.

Currency Hedger No Comments

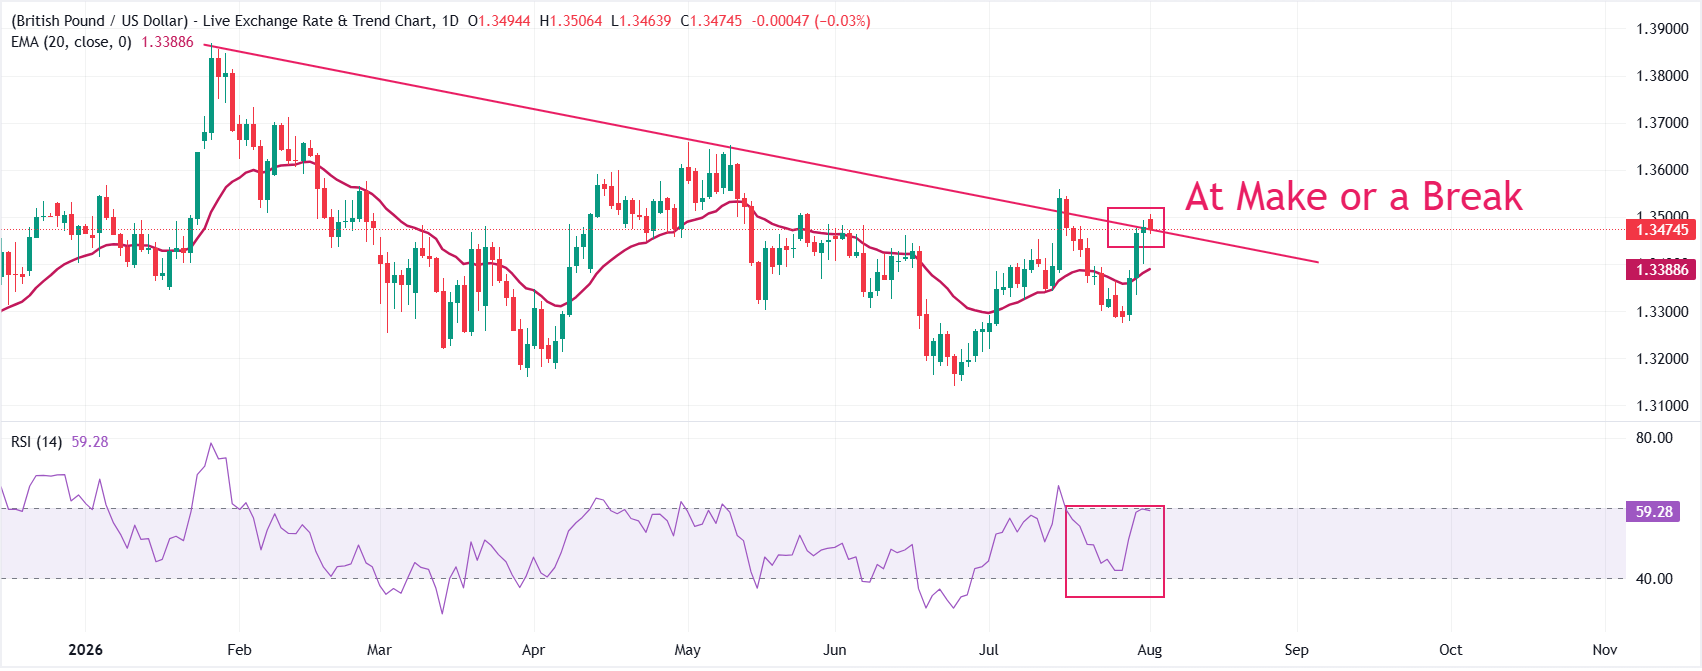
GBP/USD Price At make or a break around 1.3500

  • GBP/USD trades lower to near 1.3470 as the British Pound faces selling pressure.
  • The BoE left interest rates unchanged at 3.75% on Thursday.
  • Market sentiment turns risk-on as oil prices fall significantly.

The British Pound (GBP) underperforms its major currency peers, trading 0.1% lower at around 1.3470 against the US Dollar (USD) during the early European trading session on Monday. The GBP/USD declines as traders reconsider Bank of England (BoE) interest rate expectations, following the monetary policy announcement on Thursday.

Pound Sterling Price Today

The table below shows the percentage change of British Pound (GBP) against listed major currencies today. British Pound was the weakest against the Japanese Yen.

USDEURGBPJPYCADAUDNZDCHF
USD-0.09%0.04%-0.66%0.07%-0.15%-0.11%0.11%
EUR0.09%0.12%-0.60%0.16%-0.07%0.02%0.16%
GBP-0.04%-0.12%-0.67%0.01%-0.20%-0.09%0.06%
JPY0.66%0.60%0.67%0.66%0.42%0.53%0.65%
CAD-0.07%-0.16%-0.01%-0.66%-0.23%-0.13%-0.01%
AUD0.15%0.07%0.20%-0.42%0.23%0.09%0.29%
NZD0.11%-0.02%0.09%-0.53%0.13%-0.09%0.17%
CHF-0.11%-0.16%-0.06%-0.65%0.01%-0.29%-0.17%

The heat map shows percentage changes of major currencies against each other. The base currency is picked from the left column, while the quote currency is picked from the top row. For example, if you pick the British Pound from the left column and move along the horizontal line to the US Dollar, the percentage change displayed in the box will represent GBP (base)/USD (quote).

Analysts at Deutsche Bank stressed that the BoE was not โ€œedging towards a rate hike,โ€ a message that prompted a swift reassessment in market pricing. They note that investors โ€œdialed back expectations for BoE hikes,โ€ with the implied probability of a September move dropping from 60% to 30%. In parallel, Deutsche Bank highlights that โ€œ31bps of hikes [were] priced by year-end (-11.4bps on the day),โ€ underscoring how the latest policy signals have tempered the marketโ€™s conviction in further tightening this year.

Last week, the BoE left interest rates unchanged at 3.75%, with a 6-3 majority, and stated that interest rate hikes would be needed if Middle East risks persist and second-round effects of inflation start emerging.

However, BoE Governor Andrew Bailey signaled in the press conference that the current state of inflation is not as bad as it thought. “Encouraging that CPI is below where we thought it would be,โ€ Bailey said.

Meanwhile, the market sentiment is favorable for riskier assets, as oil prices have declined significantly due to a renewed ceasefire between the United States (US) and Iran. As of writing, S&P 500 futures are up 0.6% to near 7,535, reflecting a risk-on mood.

GBP/USD technical analysis

GBP/USD trades lower at around 1.3475, but reflects a bullish near-term bias as it holds above the 20-period exponential moving average (EMA), which is at 1.3389. The pair is at a critical level of 1.3470 where it could extend the advance or face a bearish reversal.

The Relative Strength Index (RSI) at 59 keeps a positive bias without yet signaling overbought conditions on the daily chart.

On the downside, the 20-day EMA around 1.3389 should let sellers press the pair lower. Looking up, the psychological level of 1.3500 is the key hurdle for British Pound bulls; a decisive break above that would improve the odds of further upside towards the July high at 1.3558.

Currency Hedger No Comments

EUR/USD Price – Gains traction above 1.1500, while remaining constrained below 100-day SMA

  • EUR/USD gains ground to around 1.1535 in Mondayโ€™s early Asian session. 
  • The bearish tone of the major pair prevails under the 100-day SMA. 
  • The initial support level is seen at 1.1530; the immediate resistance level to watch is 1.1570. 

The EUR/USD pair trades in positive territory near 1.1535 during the early European trading hours on Monday, bolstered by improved risk sentiment. The Euro (EUR) edges higher against the US Dollar (USD) after reports that US President Donald Trump had called off an attack on Iran and talks between the two sides would happen on Monday. Traders will closely monitor the developments surrounding US-Iran negotiations. 

Traders brace for the German Retail Sales data for June, which is due later on Monday. If the reports come in weaker than expected, this could drag the shared currency lower. On the US docket, the US ISM Manufacturing Purchasing Managers Index (PMI) data will be published. 

Chart Analysis EUR/USD

Technical Analysis:

In the daily chart, EUR/USD trades at 1.1533. The pair remains capped in the near term as spot holds below the 100-day simple moving average (SMA) at 1.1569, keeping the broader tone heavy despite the latest bounce. The Relative Strength Index (14) at 62.5 shows firm positive momentum, but with price still under the key trend average, this strength merely hints at a corrective rebound within a broader bearish backdrop.

On the downside, immediate support is aligned with the upper Bollinger Band at 1.1529, with the 20-day SMA middle band at 1.1430 and the lower band near 1.1331 marking deeper cushions if selling resumes. On the topside, a daily close above the 100-day SMA at 1.1569 would be needed to ease bearish pressure and open the way for a more sustained recovery toward higher levels.

Euro briefly lifted by French CPI as ECB commentary stays muted

Analysts at Scotiabank note that the Euro received โ€œa modest liftโ€ earlier in the session after French CPI data โ€œcame in well above expectations,โ€ but stress that the support quickly faded as โ€œthe impact was short-lived as broader themes took hold.โ€ They add that โ€œcomments from the ECB have been limited and the speaking calendar is empty over the next week or so,โ€ leaving the currency largely to trade on prevailing macro drivers rather than fresh policy signals.

Currency Hedger No Comments

EUR/JPY Price – Breaks below 179.50 as bearish bias prevails

  • EUR/JPY may retest initial support at its eight-month low of 179.37.
  • With the 14-day Relative Strength Index at 27.71, the decline’s pace may soon moderate.
  • The currency cross could rise toward its nine-day EMA at 184.07.

EUR/JPY extends its gains for the third successive day, trading around 179.40 during the Asian hours on Monday. The currency cross is extending a bearish near-term tone as price holds beneath both the nine-period and 50-period Exponential Moving Averages (EMAs).

The short-term EMA remains below the longer 50-period EMA, reinforcing downside pressure, while the 14-day Relative Strength Index (RSI) indicator at 27.71 slips into oversold territory, hinting that while sellers are in control, the pace of the decline could soon moderate.

The EUR/JPY cross may retest the initial support at the eight-month low of 179.37, reached on August 3. Further support lies at the nine-month low of 175.70.

On the upside, the EUR/JPY cross rises toward the nine-day EMA at 184.07, followed by 185.02. A break above these moving averages would cause a bullish shift and support the currency cross to explore the region around the all-time high of 187.95, which was recorded on April 17.

Chart Analysis EUR/JPY
EUR/JPY: Daily Chart
Currency Hedger No Comments

Japanese Yen jumps as US-Japan confirm joint intervention, hint further action

  • USD/JPY falls to around 156.45 in Mondayโ€™s early European session. 
  • Japan and the US confirm a joint JPY-buying intervention, signal more action. 
  • Trump said Iran talks would resume Monday after calling off planned strikes. 

The USD/JPY pair tumbles to near 156.45 during the early European trading hours on Monday. The Japanese Yen (JPY) climbs amid speculation that Japanese authorities may have intervened to prop up the currency again after coordinated action between the US and Japan last week.

Japanโ€™s Finance Minister Satsuki Katayama said on Monday that Japan and the United States (US) conducted coordinated Yen-buying intervention and will not hesitate to take further action, per Reuters. Katayama confirmed a rare bilateral action to halt the โ€ŒJPY’s slide to fresh 40-year lows. 

Meanwhile, US Treasury Secretary Scott Bessent said that Washington wouldnโ€™t hesitate to step into the market again. US President Donald Trump said on Sunday the US was helping Japan prop up the JPY as a sign of friendship and to help the world economy.

โ€œIt seems likely that authorities would intervene further in the coming days if the yen begins to unwind the recent move, as was the case in May of this year,โ€ Goldman Sachs Group Inc. strategists including Kamakshya Trivedi wrote in a note. โ€œWe continue to think intervention is an effective tool for authorities to buy some time before fundamental factors turn more positive.โ€

Uncertainty in the Middle East remains high despite hopes of a breakthrough between the US and Iran. Bloomberg reported on Monday that Trump said that a new round of Iran talks would begin Monday afternoon after he cancelled a planned attack on Iran partially in response to pleas from US allies in the Middle East, including Saudi Arabia. 

However, Iranian officials said that Trumpโ€™s claim that Tehran had requested a pause โ€œwas nothing but a new lie.โ€ Any signs of renewed escalation in the Middle East could boost the Greenback against the JPY in the near term.  

Yen seen as undervalued as Japan authorities urged to back firmer currency stance

Strategists at BNY Mellon note that official rhetoric is turning more supportive of the Yen, pointing out that U.S. Treasury Secretary Scott Bessent said on Thursday that the Japanese Yen โ€œlooks very undervalued and should strengthen further,โ€ while also stressing that โ€œexcessive volatility in the currency isnโ€™t healthy.โ€ In their view, โ€œreported intervention and a firmer BoJ message could change that quickly.โ€ BNY Mellon argues that stronger intervention would demonstrate that the authorities are prepared to resist further depreciation, while clearer policy guidance would โ€œreduce the credibility discount embedded in JPY assets.โ€

Currency Hedger No Comments

Euro holds near mid-1.1500s, highest level since June 17 as receding Fed hike bets hit USD

  • EUR/USD gains positive traction for the fifth straight day amid sustained USD selling bias.
  • A slump in oil prices ease inflation fears and tempers Fed hike bets, undermining the USD.
  • Aggressive JPY short-covering further weighs on the buck amid hopes for a US-Iran deal.

The EUR/USD pair builds on last week’s breakout momentum above the 1.1460-1.1470 horizontal barrier and attracts buyers for the fifth straight day on Monday. Spot prices climb to a fresh high since June 17, beyond mid-1.1500s during the Asian session and seem poised to appreciate further amid a broadly weaker US Dollar (USD).

In fact, the USD Index (DXY), with tracks the Greenback against a basket of currencies, prolongs last week’s retracement slide from the vicinity of the year-to-date as a slump in crude oil prices force traders to temper bets on extremeย Fedย tightening. US President Donald Trump said that he will order American forces to hold off on new strikes against Iran, claiming Mideast allies have reached the parameters of a deal to end the 5-month-old war. This, along with the OPEC+ decision on Sunday to increase production in September, is seen weighing heavily on crude oil prices.

Brown Brothers Harrimanโ€™s Elias Haddad argues that the recent strength in the Dollar is losing momentum, with the bank now judging that โ€œthe USD rally from May has run its course, with DXY poised to retreat back into a 96.00-100.00 range.โ€ BBH contends that the earlier โ€œtailwind to USD from resilient US economic activityโ€ is increasingly being offset by policy concerns, specifically that โ€œFed Chair Kevin Warsh failure to turn tough inflation rhetoric into a credible policyโ€ is โ€œincreasing the risk the Fed falls behind the curve in containing inflation.โ€

Apart from this, aggressive follow-through short-covering in the Japanese Yen (JPY) turns out to be another factor undermining the USD. The Euro, on the other hand, continues to draw support from resilient Eurozone inflation data, which backs the case for the European Central Bank (ECB) to raise interest rates again in September. This, in turn, validates the near-term positive outlook for the EUR/USD pair as traders now look forward to important US macro releases scheduled at the beginning of a new month, starting with the ISM Manufacturing PMI later this Monday, for fresh impetus.

Societe Generaleโ€™s Sam Cartwright argues that the latest inflation figures, taken together with the โ€œsolid 2Q26 GDP print,โ€ strengthen the policy case for further tightening. In his view, โ€œtodayโ€™s release should support another ECB rate hike in September,โ€ as resilient growth and slightly firmer price pressures give the central bank room to maintain a hawkish stance.

Currency Hedger No Comments

Rupee Near Four-Week High

The Indian rupee climbed to around 95.1 per dollar, extending last week’s gains to a near four-week high as lower oil prices reinforced optimism from the Reserve Bank of India’s sustained market intervention. Brent crude prices fell 4.7% to below $84 a barrel after US President Donald Trump said plans for an attack on Iran had been shelved to allow negotiations on a nuclear deal, easing concerns over India’s import bill and inflation outlook. The rupee rallied 1.2% last week, its strongest weekly gain since March, as the RBI’s near-daily dollar sales eased fears of a slide beyond 97 per dollar. Additional support came after RBI data showed measures to attract capital inflows had brought in about $41 billion, including $36.7 billion through foreign currency non-resident deposits, bolstering the central bank’s capacity to defend the rupee. Meanwhile, the RBI’s net foreign exchange forward book narrowed slightly to $103.3 billion in June, reflecting lower near-term dollar liabilities.