

The offshore yuan held its gains around 6.78 per dollar on Tuesday, as stronger-than-expected trade data highlighted the resilience of China’s export sector despite signs of an economic slowdown. Exports surged 19.4% year-on-year to a record USD 376.8 billion in May, driven by inventory building aimed at mitigating rising shipping and energy costs linked to the Gulf conflict, alongside robust demand for semiconductors and AI-related products. While the Middle East conflict has yet to significantly affect exports, weak domestic demand continues to leave the economy vulnerable to a deterioration in global conditions, reinforcing expectations for further policy easing. Meanwhile, imports jumped 27.4% to USD 271.4 billion, beating forecasts of a 25% increase as firms stepped up purchases of foreign chips and equipment. Consequently, China’s trade surplus widened to USD 105.4 billion, its highest level since January.

Trade of The Day – EUR/USD
Facts
- On Thursday (June 11), the ECB will announce its interest rate decision. Markets have almost fully priced in a rate hike.
- Nearly two additional rate hikes are priced in for the remaining months of the year (the second one at approx. 73%).
- On Wednesday (June 10), May CPI inflation data for the United States will be released.
- The EURUSD pair is oscillating around 1.15500, between two key support levels determined by the 61.8% and 78.6% Fibonacci retracements.
- The price is trading significantly below its three major moving averages: EMA 50 (1.16568), EMA 100 (1.16608), and EMA 150 (1.16464).
- The RSI (14) indicator stands at 39.1.
Recommendation
- Position: Short (SELL) on EURUSD at market price (1.15502).
- Take Profit (TP): 1.14700 (TP1), 1.14200 (TP2)
- Stop Loss (SL): 1.16300
Figure 1: EURUSD (10.12.2025 – 25.06.2026)
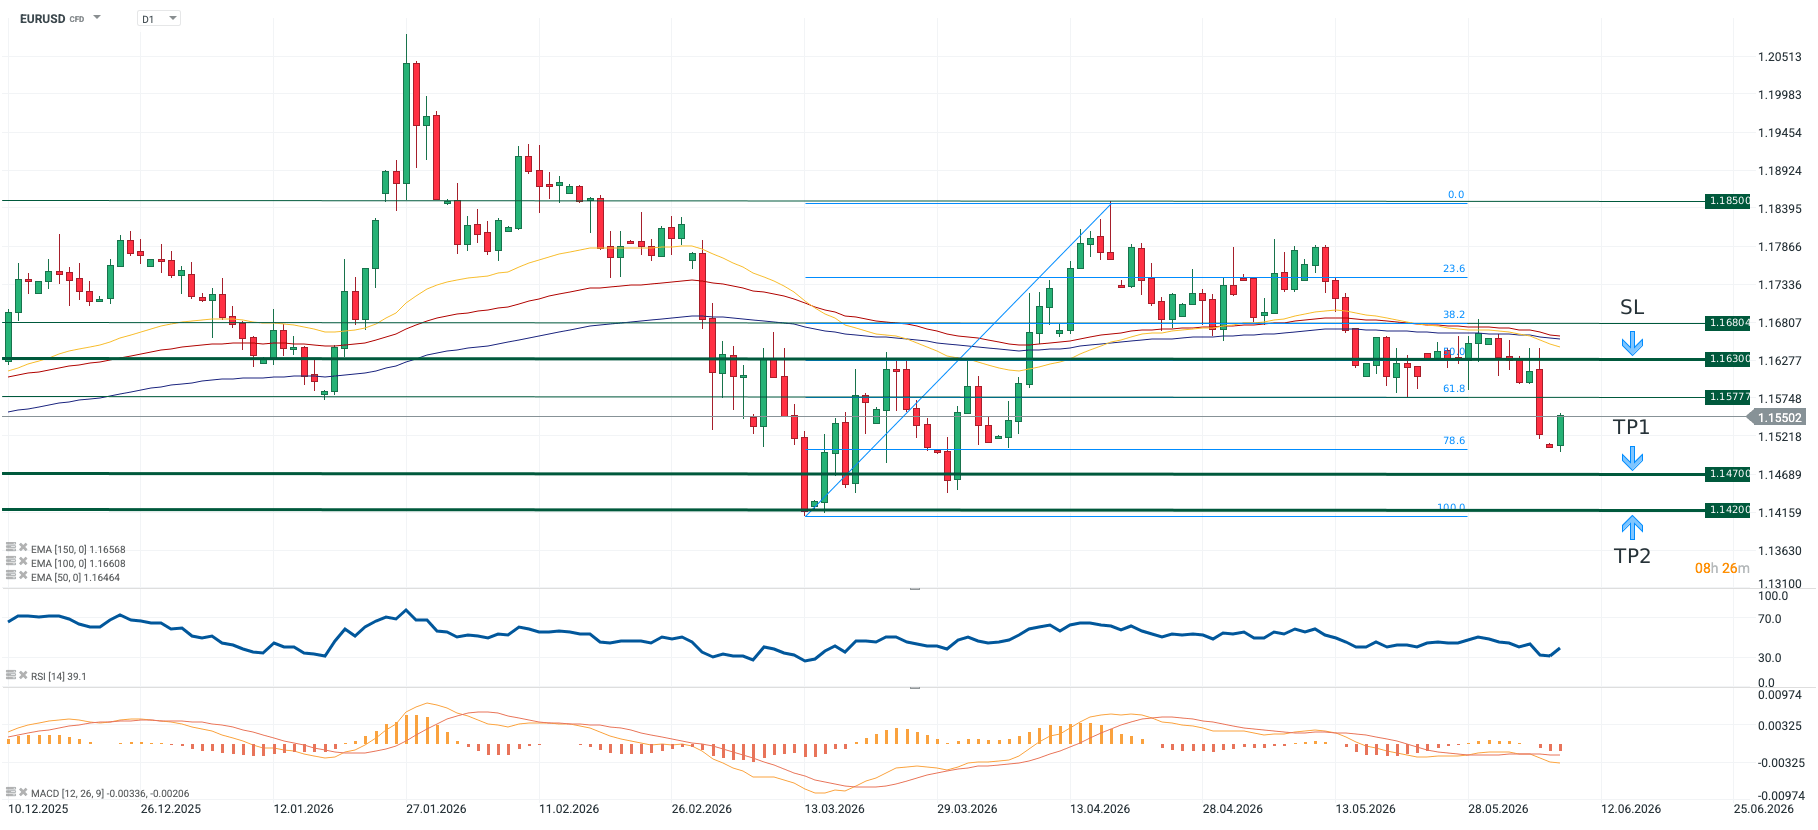
Source: xStation5, 08.06.2026 (15:34)
Opinion
The EURUSD pair has weakened significantly from its mid-April peak, when it approached the 1.18500 level. The key drivers behind this downward move are the prolonged negotiations between the US and Iran, alongside a substantial increase in market expectations for US interest rate hikes. Markets have now fully priced in a rate increase before the end of the year, following Friday’s release of very strong NFP (Non-Farm Payrolls) data from the US labor market. Figure 2: Change in Non-Farm Payrolls (NFP) and Unemployment Rate in the US (2023 – 2026)
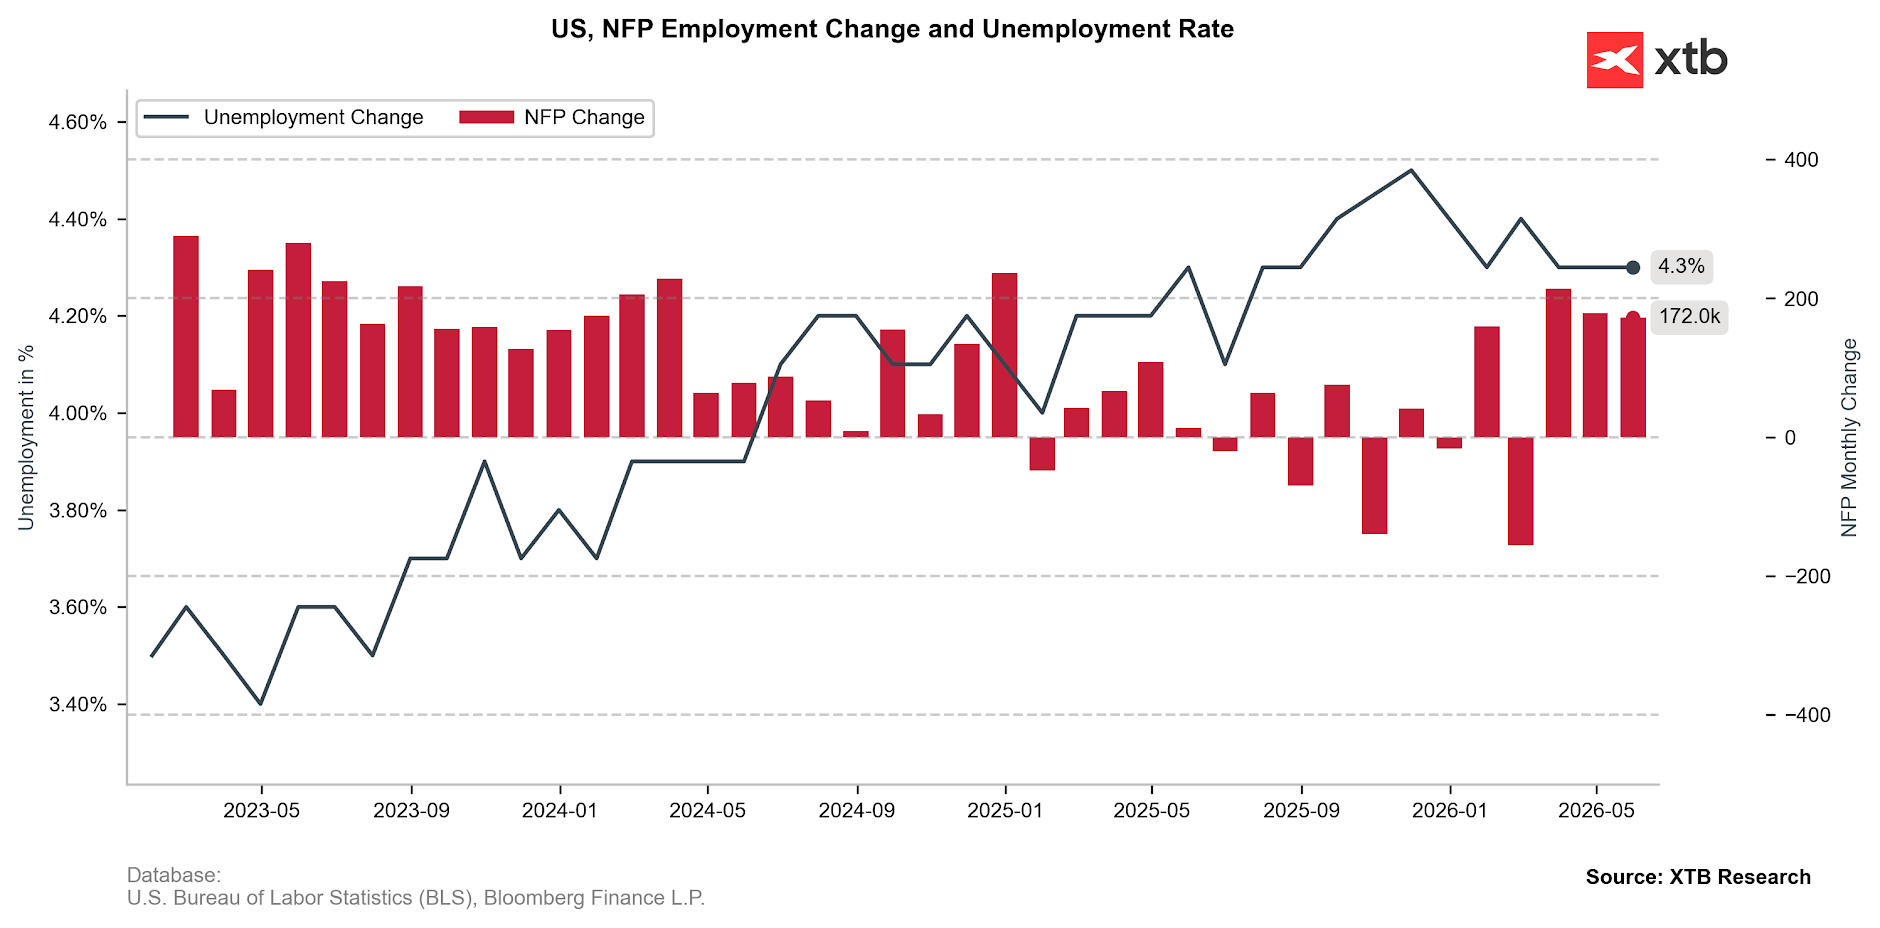
Source: XTB Research, 08.06.2026
Geopolitics and monetary policy should remain the primary focus for investors this week as well. Any headlines suggesting that a breakthrough in reopening the Strait of Hormuz is slipping away could weigh on the EURUSD pair, a dynamic already observed during this morning’s trading session. Paradoxically, the Euro’s decline could also be fueled by Thursday’s anticipated interest rate hike from the ECB. Since this move is already nearly 100% priced in by the markets, investor attention will shift away from the decision itself and onto the accompanying rhetoric. Frankly speaking, if the ECB were to hold rates for any reason, it would trigger a massive sell-off in the Euro. However, the single currency could also be weakened by President Christine Lagarde herself, who will take the podium on Thursday afternoon to address and potentially challenge market assumptions regarding the central bank’s upcoming steps.
Lagarde has rarely accustomed us to being overly transparent or hawkish in her communications. Consequently, any signs of her emphasizing economic stagnation risks could be interpreted by markets as dovish – especially if inflation concerns are given a slightly lower priority than they were a month ago. Speaking of inflation, Wednesday’s US CPI print for May is a crucial milestone. Further growth in price pressures is expected. The core gauge, which excludes highly volatile food and energy prices, will be critical, as it will reveal the extent to which the energy shock has filtered into other sectors of the economy. From a technical analysis perspective: The pair has broken below the 61.8% Fibonacci retracement level (1.15777) as well as the EMA 50, 100, and 150 moving averages, justifying further declines. The MACD histogram is systematically deepening its lows in negative territory, and the RSI (14) still has ample room to slide before hitting oversold territory.
Methodology
The recommendation was prepared based on a fundamental analysis of the respective economies (including monetary policy in both the Eurozone and the US), as well as a technical analysis of the EURUSD chart. The direction of the recommendation was determined by assessing the monetary policy divergence between the Fed and the ECB, confirmed by the medium-term downward trend on the chart. Take Profit and Stop Loss levels were determined using Fibonacci retracements and key horizontal support/resistance levels (TP1 between Fibo 78.6% and Fibo 100.0%, TP2 directly at the Fibo 100.0% level, and the SL at the Fibo 50.0% level).
Euro: Downtrend extends toward 1.1445 against US Dollar – UOB
UOB’s Quek Ser Leang and Lee Sue Ann note that EUR/USD plunged to a three‑month low around 1.1520 after breaking several key supports. In the near term, they see scope for a further drop toward 1.1490, while over the next 1–3 weeks, the pair is expected to continue weakening toward 1.1445, with resistance now capped around 1.1575/1.1600.
Momentum points to further Euro losses
“24-HOUR VIEW: Our view of range-trading last Friday was incorrect, as EUR nose-dived during the early NY session, breaking a couple of firm support levels on the way. EUR closed at 1.1519, down sharply by 0.78%. While the sharp and rapid decline appears excessive, there are no signs of stabilisation yet. Today, as long as 1.1575 (minor resistance is at 1.1535), EUR could drop toward 1.1490. That said, any further decline is unlikely to reach 1.1445 for now. “
“1-3 WEEKS VIEW: After holding the view that “EUR is neutral, and it is likely to trade between 1.1590 and 1.1685” for more than a week, we indicated last Thursday (04 Jun, spot at 1.1605) that “downward momentum is increasing, and if EUR breaks and holds below 1.1590, it would increase the risk of a decline toward the significant support at 1.1555.” We added, “the likelihood of EUR breaking clearly below 1.1590 will remain intact as long as 1.1655 (‘strong resistance’ level) is not breached.” Last Friday, EUR not only broke below 1.1590, but also breached 1.1555, plunging to a low of 1.1516. Given the sharp boost in downward momentum, EUR is likely to continue to weaken toward 1.1445. On the upside, the ‘strong resistance’ level is now at 1.1600 instead of 1.1655. In the near-term, 1.1575 is already a firm resistance level.”

British Pound: Growth risks and politics weigh against US Dollar – BBH
Brown Brothers Harriman’s Elias Haddad (BBH) highlights downside risks for the Pound as UK GDP is expected to contract in Q2 and markets price further Bank of England (BoE) hikes due to second-round inflation effects. Haddad forecasts GBP/USD lower and warns that domestic politics, including the Makerfield by-election and potential leadership challenges, could exacerbate any Pound undershoot.
Soft growth and political risk pressure Sterling
“UK April GDP is due Thursday. Real GDP is expected to fall -0.1% m/m vs. +0.3% in March and track below the Bank of England’s (BOE) baseline Q2 forecast of +0.1% q/q. PMI data indicate UK real GDP could contract by -0.2% q/q in Q2.”
“Nevertheless, the swaps curve implies 64bps of BOE rate hikes to between 4.25% and 4.50% in the next twelve months because of upside risk to second-round effects in price and wage-setting stemming from the energy shock. A first full 25bps BOE rate rise is priced-in for the September 17 meeting.”
“We expect GBP/USD to fall to 1.3100, reflecting a stronger US growth outlook relative to the UK. BOE rate hikes in a sluggish growth, high inflation environment, is not bullish for GBP but should help cushion the downside.”
“The UK political backdrop can amplify a GBP undershoot. Attention is increasingly shifting to the June 18 Makerfield by-election.”
GBP holds losses below 1.3350 amid Middle East turmoil
- GBP/USD posts modest losses near 1.3340 in Monday’s early European session.
- Intensified geopolitical tensions in the Middle East weigh on the British Pound.
- BoE’s Bailey signaled the central bank is in “no rush” to raise interest rates.
The GBP/USD pair trades with mild losses around 1.3340 during the European trading hours on Monday. Ongoing tensions in the Middle East and rising bets of a US interest rate hike provide some support to the US Dollar (USD) against the British Pound (GBP).
The BBC reported on Monday that the Israel Defense Forces (IDF) said that it struck military targets in western and central Iran, hours after Iran fired a salvo of missiles at northern Israel. Iranian officials said that any attack from Israel against Lebanon or Iran would be met with a “crushing and comprehensive response.”
Additionally, Iran’s ambassador to Moscow, Kazem Jalali, said that the Strait of Hormuz will be open but under new conditions to be set by Iran and Oman, including a transit fee, per Reuters. Escalating tensions in the Middle East could boost a safe-haven currency such as the Greenback and act as a headwind for the major pair in the near term.
The US economy posted a third straight month of strong job gains in May, with the US Nonfarm Payrolls (NFP) rising by 172K in May, the Bureau of Labor Statistics reported on Friday. This figure followed the 179K increase (revised from 115K) and was better than the forecast of 85K. This robust jobs data has reignited expectations that the Fed may raise the interest rate later this year, lifting the USD.
On the UK’s front, Bank of England (BoE) governor Andrew Bailey delivered dovish remarks, saying that the UK central bank is in no rush to raise interest rates while the outcome of the Iran war remains uncertain and the UK’s growth rate stays weak.
Financial markets had expected the BoE to cut interest rates twice this year to 3.25%. Since the US-Iran war began, the situation has reversed, and now a rise of 25 basis points (bpd) before December is forecast, according to CNBC.
EUR/USD Price Rises toward 1.1550 after rebounding from channel bottom
- EUR/USD may retest the lower boundary of the descending channel around 1.1510.
- The 14-day Relative Strength Index at 35 suggests persisting downside pressure.
- The initial resistance appears at the nine-day EMA of 1.1591.
EUR/USD rebounds after registering 0.75% losses in the previous day, trading around 1.1530 during the Asian hours on Monday. The daily chart technical analysis indicates an ongoing bearish bias as the pair is positioned near the lower boundary of the descending channel pattern.
The EUR/USD pair is preserving a bearish near-term bias as spot holds under both the nine-day and 50-day Exponential Moving Averages (EMAs). The 14-day Relative Strength Index (RSI) at 35 is edging closer to oversold territory, hinting that while downside pressure persists, the pace of the recent decline could slow as sellers approach stretched conditions.
The EUR/USD pair may retest the lower boundary of the descending channel around 1.1510. A break below the channel would strengthen the bearish bias and put downward pressure on the pair to test the 10-month low of 1.1411, recorded on March 13.
On the upside, the primary barrier lies at the nine-day EMA of 1.1591, followed by the 50-day EMA of 1.1654. Next resistance lies at the upper boundary of the descending channel around 1.1710; a break above it would expose a nearly four-month high of 1.1849, reached on April 17.
(The technical analysis of this story was written with the help of an AI tool.)
Euro Price Today
The table below shows the percentage change of Euro (EUR) against listed major currencies today. Euro was the strongest against the Swiss Franc.
| USD | EUR | GBP | JPY | CAD | AUD | NZD | CHF | |
|---|---|---|---|---|---|---|---|---|
| USD | -0.14% | -0.05% | -0.02% | -0.01% | -0.07% | -0.22% | 0.02% | |
| EUR | 0.14% | 0.08% | 0.13% | 0.12% | 0.06% | -0.07% | 0.14% | |
| GBP | 0.05% | -0.08% | 0.04% | 0.03% | -0.07% | -0.16% | 0.04% | |
| JPY | 0.02% | -0.13% | -0.04% | -0.03% | -0.10% | -0.20% | -0.01% | |
| CAD | 0.01% | -0.12% | -0.03% | 0.03% | -0.07% | -0.19% | -0.02% | |
| AUD | 0.07% | -0.06% | 0.07% | 0.10% | 0.07% | -0.11% | 0.09% | |
| NZD | 0.22% | 0.07% | 0.16% | 0.20% | 0.19% | 0.11% | 0.18% | |
| CHF | -0.02% | -0.14% | -0.04% | 0.01% | 0.02% | -0.09% | -0.18% |
The heat map shows percentage changes of major currencies against each other. The base currency is picked from the left column, while the quote currency is picked from the top row. For example, if you pick the Euro from the left column and move along the horizontal line to the US Dollar, the percentage change displayed in the box will represent EUR (base)/USD (quote).

NZD/USD Price Recovers from two-month low, retakes 0.5800 amid bearish setup
- NZD/USD attracts some buyers after touching a two-month low during the Asian session.
- Geopolitical risks and Fed rate hike bets support the USD, capping the upside for the pair.
- The technical setup favors bears and warrants caution before positioning for further gains.
The NZD/USD pair stages a modest recovery following an Asian session dip to the 0.5780 region, or a two-month low, as the US Dollar (USD) enters a bullish consolidation phase on Monday. Spot prices climb back above the 0.5800 mark in the last hour, though any meaningful appreciation still seems elusive.
The Israel-Iran conflict has entered a dangerous new phase, with both sides exchanging attacks across multiple fronts, keeping geopolitical risks in play. Furthermore, Friday’s upbeat US Nonfarm Payrolls (NFP) report reaffirmed market bets that the US Federal Reserve (Fed) will hike interest rates in 2026, which assists the USD to hold steady near a two-month top and should cap the NZD/USD pair.
From a technical perspective, the recent failure near the 0.6000 psychological mark constituted the formation of a bearish double top pattern on the 4-hour chart. A subsequent breakdown through the 200-period Simple Moving Average (SMA) near the 0.5900 mark and the neckline support near the 0.5825-0.5820 area suggests that the path of least resistance for the NZD/USD pair remains to the downside.
Moreover, the Moving Average Convergence Divergence (MACD) indicator remains in negative territory, hinting that downside pressure persists. Meanwhile, the Relative Strength Index (RSI) hovers around 28, showing oversold conditions that may slow, but not yet reverse, the current decline. Hence, any further recovery is likely to confront immediate resistance near the 200-period SMA at 0.5895.
The NZD/USD pair would need to reclaim this level to ease the prevailing bearish structure. Momentum readings from both MACD and RSI sit in negative and oversold zones, respectively, acting as a warning that although the downfall is stretched, any recovery attempts are likely to encounter selling interest before a sustained base is formed.
(The technical analysis of this story was written with the help of an AI tool.)
NZD/USD 4-hour chart
US Dollar Price Last 7 Days
The table below shows the percentage change of US Dollar (USD) against listed major currencies last 7 days. US Dollar was the strongest against the New Zealand Dollar.
| USD | EUR | GBP | JPY | CAD | AUD | NZD | CHF | |
|---|---|---|---|---|---|---|---|---|
| USD | 1.05% | 0.86% | 0.61% | 1.01% | 1.76% | 2.90% | 2.00% | |
| EUR | -1.05% | -0.20% | -0.46% | -0.04% | 0.70% | 1.86% | 0.94% | |
| GBP | -0.86% | 0.20% | -0.24% | 0.15% | 0.90% | 2.06% | 1.12% | |
| JPY | -0.61% | 0.46% | 0.24% | 0.43% | 1.19% | 2.30% | 1.37% | |
| CAD | -1.01% | 0.04% | -0.15% | -0.43% | 0.73% | 1.86% | 0.97% | |
| AUD | -1.76% | -0.70% | -0.90% | -1.19% | -0.73% | 1.15% | 0.26% | |
| NZD | -2.90% | -1.86% | -2.06% | -2.30% | -1.86% | -1.15% | -0.92% | |
| CHF | -2.00% | -0.94% | -1.12% | -1.37% | -0.97% | -0.26% | 0.92% |
The heat map shows percentage changes of major currencies against each other. The base currency is picked from the left column, while the quote currency is picked from the top row. For example, if you pick the US Dollar from the left column and move along the horizontal line to the Japanese Yen, the percentage change displayed in the box will represent USD (base)/JPY (quote).

Indian Rupee declines due to rising hawkish Fed bets, renewed Middle East war
- The Indian Rupee opens on a negative note against the US Dollar.
- The US Dollar gains as surprisingly strong US NFP numbers boost hawkish Fed bets.
- Renewed Israel-Iran war has prompted oil prices.
The Indian Rupee (INR) starts the week on a negative note against the US Dollar (USD), with the USD/INR pair rising to near 95.30. The pair gains at open as surprisingly upbeat United States (US) Nonfarm Payrolls (NFP) data for May has strengthened the US Dollar, and rising oil prices due to re-escalating conflicts between Iran and Israel have weakened the Indian Rupee.
During the press time, the US Dollar Index (DXY), which tracks the Greenback’s value against six major currencies, holds onto Friday’s gains around 100.00, the highest zone seen in two months.
Upbeat US NFP data prompts hawkish Fed bets
On Friday, the US Bureau of Labor Statistics (BLS) reported surprisingly upbeat official employment data for May. The US NFP arrived significantly higher at 172K against 85K estimates. Meanwhile, the April reading was also revised higher to 179K from 115K. The Unemployment Rate remained steady at 4.3%, as expected. Strong job growth data, compounded with already high inflationary pressures, have resulted in a significant increase in hawkish Federal Reserve (Fed) bets.
The CME FedWatch tool shows that the possibility of the Fed delivering at least one interest rate hike this year has increased to 73.8% from 45.2% seen a week ago.
Oil prices jump on renewed Middle East conflicts
The attacks from Israeli Defense Forces (IDF) in western and central Iran over the weekend, despite US President Donald Trump urging Israeli Prime Minister Benjamin Netanyahu not to retaliate against Iran’s attacks, have renewed fears of an all-out war in the Middle East.
Iran fired ballistic missiles at Israeli military targets over the weekend in retaliation for Israeli aggression in Lebanon.
Rising hostilities in the Middle East have raised concerns over the US-Iran peace deal, prompting fears of a prolonged closure of the Strait of Hormuz, which has resulted in a sharp increase in oil prices. As of writing, the MCX Crude Oil contract expiring on June 18 is up 4.6% to near 9,020.
Currencies from economies, such as India, which rely heavily on oil imports to meet their energy needs, tend to underperform in a high oil price environment.
FIIs continue to remain net sellers in Indian stock market
So far in June, Foreign Institutional Investors (FIIs) have remained net sellers on all trading days, and offloaded their stake worth Rs. 30,814.47 crore. Overseas investors also remained net sellers in May and pared their stake worth Rs. 55,963.33 crore. Foreign investors are dumping their investments in the Indian stock market due to growing concerns over India Inc.’s earnings projections amid higher oil prices.
Technical Analysis: USD/INR attarct bids near 95.00
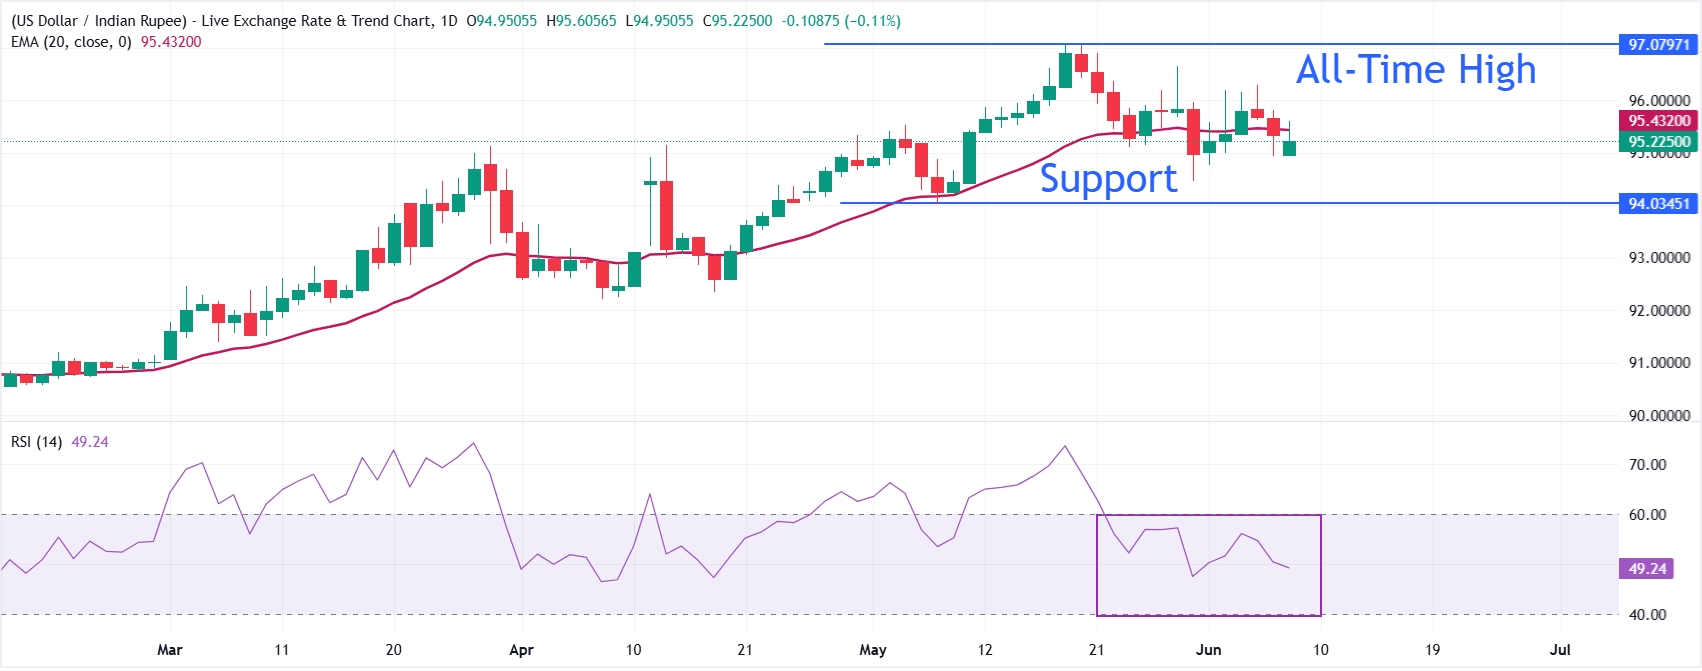
USD/INR trades higher at around 95.30 with a mildly bearish near-term bias, holding just under its 20-day exponential moving average (EMA) at 95.4320. The pair has retreated from recent highs and the loss of traction against this short-term EMA hints that upside momentum is fading, while the Relative Strength Index (RSI) around 49 suggests neutral momentum rather than a clear directional push.
On the downside, immediate focus is on whether sellers can keep the pair capped beneath the 20-day EMA at 95.4320, which now acts as the first area of supply limiting rebounds. A sustained daily close back above this moving average would ease the current pressure and open the door to a further slippage towards the May 7 low around 94.00. Looking up, the pair needs to return above the 20-day EMA to ease downside pressure, and a further rally above the June 4 high at 96.30 would allow it to reclaim the all-time high around 97.10.
