Currency Hedger No Comments

Indian Rupee opens lower as Trump demands war compensation

  • The Indian Rupee falls further against the US Dollar as oil prices extend the advance.
  • US President Trump demands reparations for the war, as Iran did the same.
  • Investors await the CPI data for July from both India and the US.

The Indian Rupee (INR) opens on a cautious note against the US Dollar (USD) on Tuesday. Theย USD/INRย pair rises further to near 95.40 as surging oil prices due to escalating fears of a prolonged global supply disruption have weakened the Indian currency.

In the opening session, the MCX Crude Oil contract expiring on August 19 trades 0.45% higher to near Rs. 7,835, closer to its weekly high.

Trump also demands reparations for war

On Monday, United States (US) President Donald Trump also demanded compensation for war casualties in the Middle East from Iran, through a post on Truth Social, in a direct answer to Iran’s own call for compensation, as a key condition for reopening the Strait of Hormuz, a vital passage to almost one-fifth of global energy supply.

US President Trump added that Iran should be held “responsible for the damages and death” caused to the people of Lebanon, Syria, Yemen and Gaza.

Over the weekend, Iranโ€™s Mohammad Bagher Zolghadr, secretary of the council, set out six conditions for the Hormuz reopening.

Both sides demanding compensation for war damages have heightened uncertainty over the truce in the near term, boosting oil prices.

Currencies from economies, such as India, which rely heavily on oil imports to meet their energy needs, tend to underperform in a high-oil-price environment.

India-US CPI data comes under the spotlight

This week, the major trigger for the Indian Rupee and the US Dollar will be respective Consumer Price Index (CPI) data for July from their economies, which will be released on Wednesday.

India inflation holds steady as DBS flags mixed food trends and benign core

Economists at DBS Group Research note that key โ€œinflation and trade numbers are due in the second week of August,โ€ with โ€œheadline inflation in Julyโ€ฆ largely steady at 4.4% YoY vs June.โ€ They point out that โ€œhigh frequency data on food staples point to a rise in pulses, sugar, milk and edible oils, while vegetables have stabilized,โ€ adding that โ€œa catch-up in rainfall in July has helped boost sowing activity.โ€ On the price side, DBS highlights that โ€œadjustments in domestic retail fuel products (non-subsidized LPG was up 10% YoY in July) are also likely to reflect in the utilities and fuel segments.โ€ Even so, they expect underlying pressures to remain contained, with โ€œcore readingsโ€ฆ benign at sub-4% in July, helped also by moderation in precious metals in the period.โ€

In the US, both headline and core CPI are expected to have cooled down, with figures seen arriving lower at 3.4% and 2.5% Year-on-Year (YoY), respectively.

Signs of US inflationary pressures cooling down would ease fears ofย Federal Reserveย (Fed) interest rate hikes further.ย This week, financial markets have rolled back hawkish Fed after the release of the US Nonfarm Payrolls (NFP) data for July, which showed a reduction in the overall labor force against estimates of a fresh addition of 80K workers.

Technical Analysis: USD/INR holds key 60-day EMA
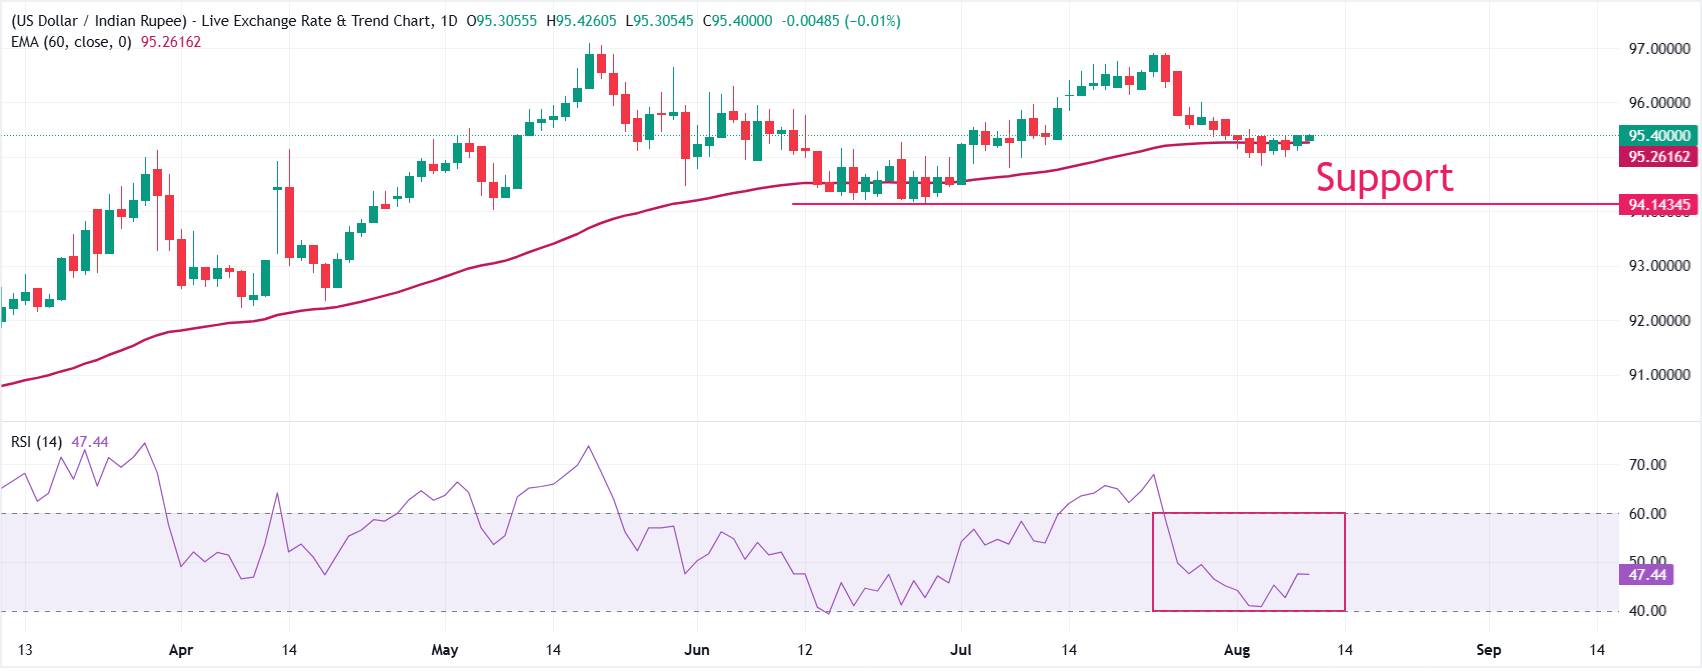
In the daily chart, USD/INR trades at 95.40. The pair holds above the 60-day exponential moving average (EMA) at 95.26, keeping a modest bullish near-term bias as price respects this dynamic support zone.

Momentum is less conclusive, with the 14-day Relative Strength Index (RSI) hovering near 47, hinting at a consolidative tone rather than strong directional conviction, but the preservation of levels above the EMA favors mild upside while this floor holds.

On the downside, initial support is seen at the 60-day EMA at 95.26, followed by the June 26 low at 94.15. With no clearly defined overhead technical barriers in the immediate dataset, any sustained advance above the recent close would likely be driven by momentum shifts, while a daily close back below 95.2616 would weaken the current constructive bias and expose a broader corrective phase.

Currency Hedger No Comments

Australian Dollar declines against New Zealand Dollar following RBA decision

  • AUD/NZD falls as the Australian Dollar weakens following the Reserve Bank of Australia’s latest interest rate decision.
  • The RBA kept the Official Cash Rate unchanged at 4.35% for the second consecutive meeting.
  • New Zealand Prime Minister Christopher Luxon called an urgent caucus meeting Wednesday to address growing speculation about his leadership.

AUD/NZD pares its daily gains, trading around 1.1960 during the Asian hours on Tuesday. The Australian Dollar (AUD) has drifted lower following the Reserve Bank of Australiaโ€™s (RBA) latest monetary policy decision, keeping the currency cross on a weaker footing. As widely anticipated by financial markets after second-quarter inflation figures came in lower than projected, the RBA opted to leave the Official Cash Rate unchanged at 4.35% for its second consecutive meeting.

RBA statement eyed for fresh guidance on inflation and growth

Brown Brothers Harrimanโ€™s Elias Haddad highlighted that the communications will be critical, noting that โ€œThe RBAโ€™s August Statement on Monetary Policy will shed light on the bankโ€™s inflation and growth outlook.โ€ This detailed update is expected to help investors refine their views on how long the RBA can sustain its current hawkish stance and what that implies for the Australian Dollarโ€™s carry appeal over the remainder of the year.

Meanwhile, central bank policy across the Tasman faces its own set of complications. Rising oil prices, driven by uncertainty over the potential reopening of the Strait of Hormuz, have sparked fresh debate on how the Reserve Bank of New Zealand (RBNZ) might approach its September policy meeting. Markets are exercising caution ahead of New Zealandโ€™s third-quarter inflation expectation figures, particularly after the Q2 data showed an unexpected acceleration.

Compounding the regional uncertainty, New Zealand Prime Minister Christopher Luxon has called an urgent, in-person caucus meeting for Wednesday morning to confront growing speculation surrounding his leadership. Following a turbulent week marked by reports of MPs receiving calls about a potential leadership challenge, Luxon is acting decisively to suppress internal dissent before it metastasizes into a campaign-defining issue for the National Party.

Currency Hedger No Comments

FX Weekly: Yen Returns to Losses, Dollar Under Pressure

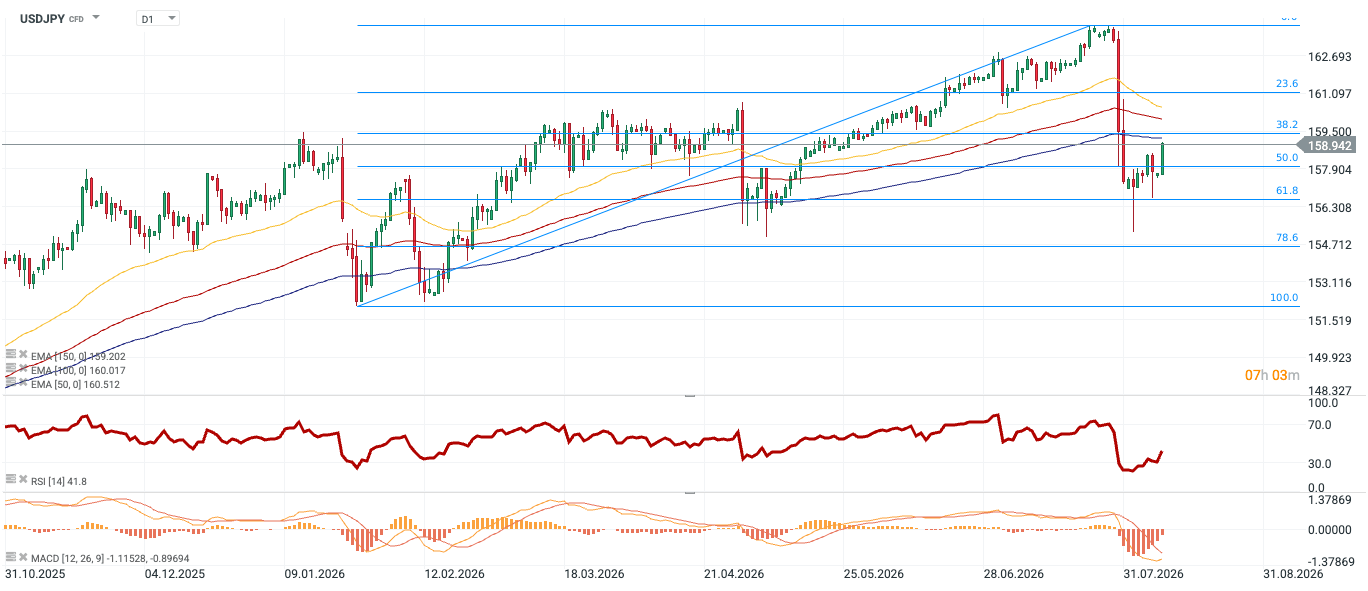
Following a record intervention by the Japanese Ministry of Finance and the US Department of the Treasury, the yen strengthened by over 5%, recovering losses incurred over the last 5 months, since the outbreak of the war in Iran. After reaching a local low below the 156 level, the USDJPY pair has returned to growth.

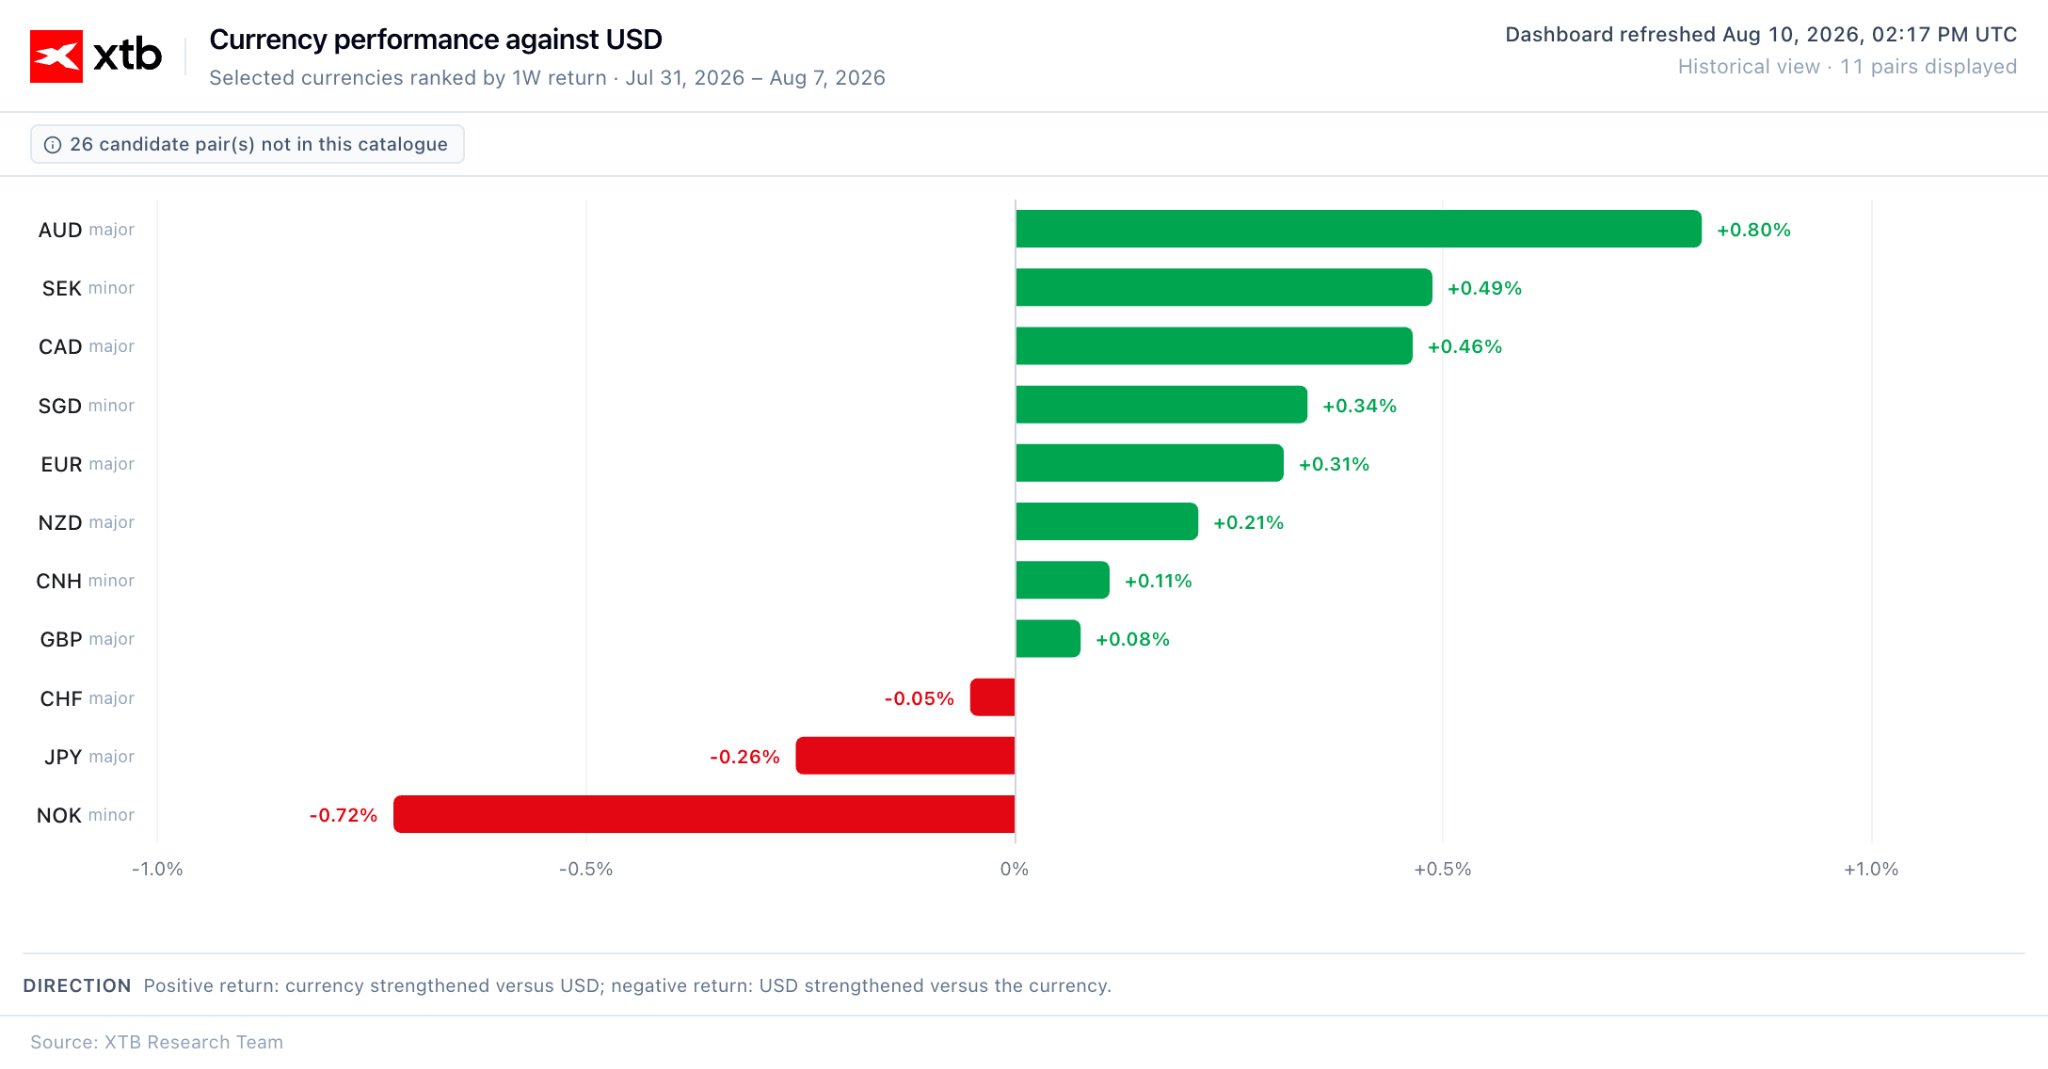
Figure 1: Weekly Performance of Selected Currencies [vs. USD] (31.07 – 07.08)

Source: XTB Research, 10.08.2026

Japanese Yen (JPY)

The fundamentals have not changed significantly and continue to exert pressure on the Japanese currency. The key issue remains the carry trade, or trading on the interest rate differential. As long as the discrepancy between the projected interest rate levels in the United States and Japan remains significant, even interventions amounting to nearly 90 billion dollars may prove insufficient to permanently reverse the trend. Figure 2: USDJPY (31.10.2025 – 10.08.2026)

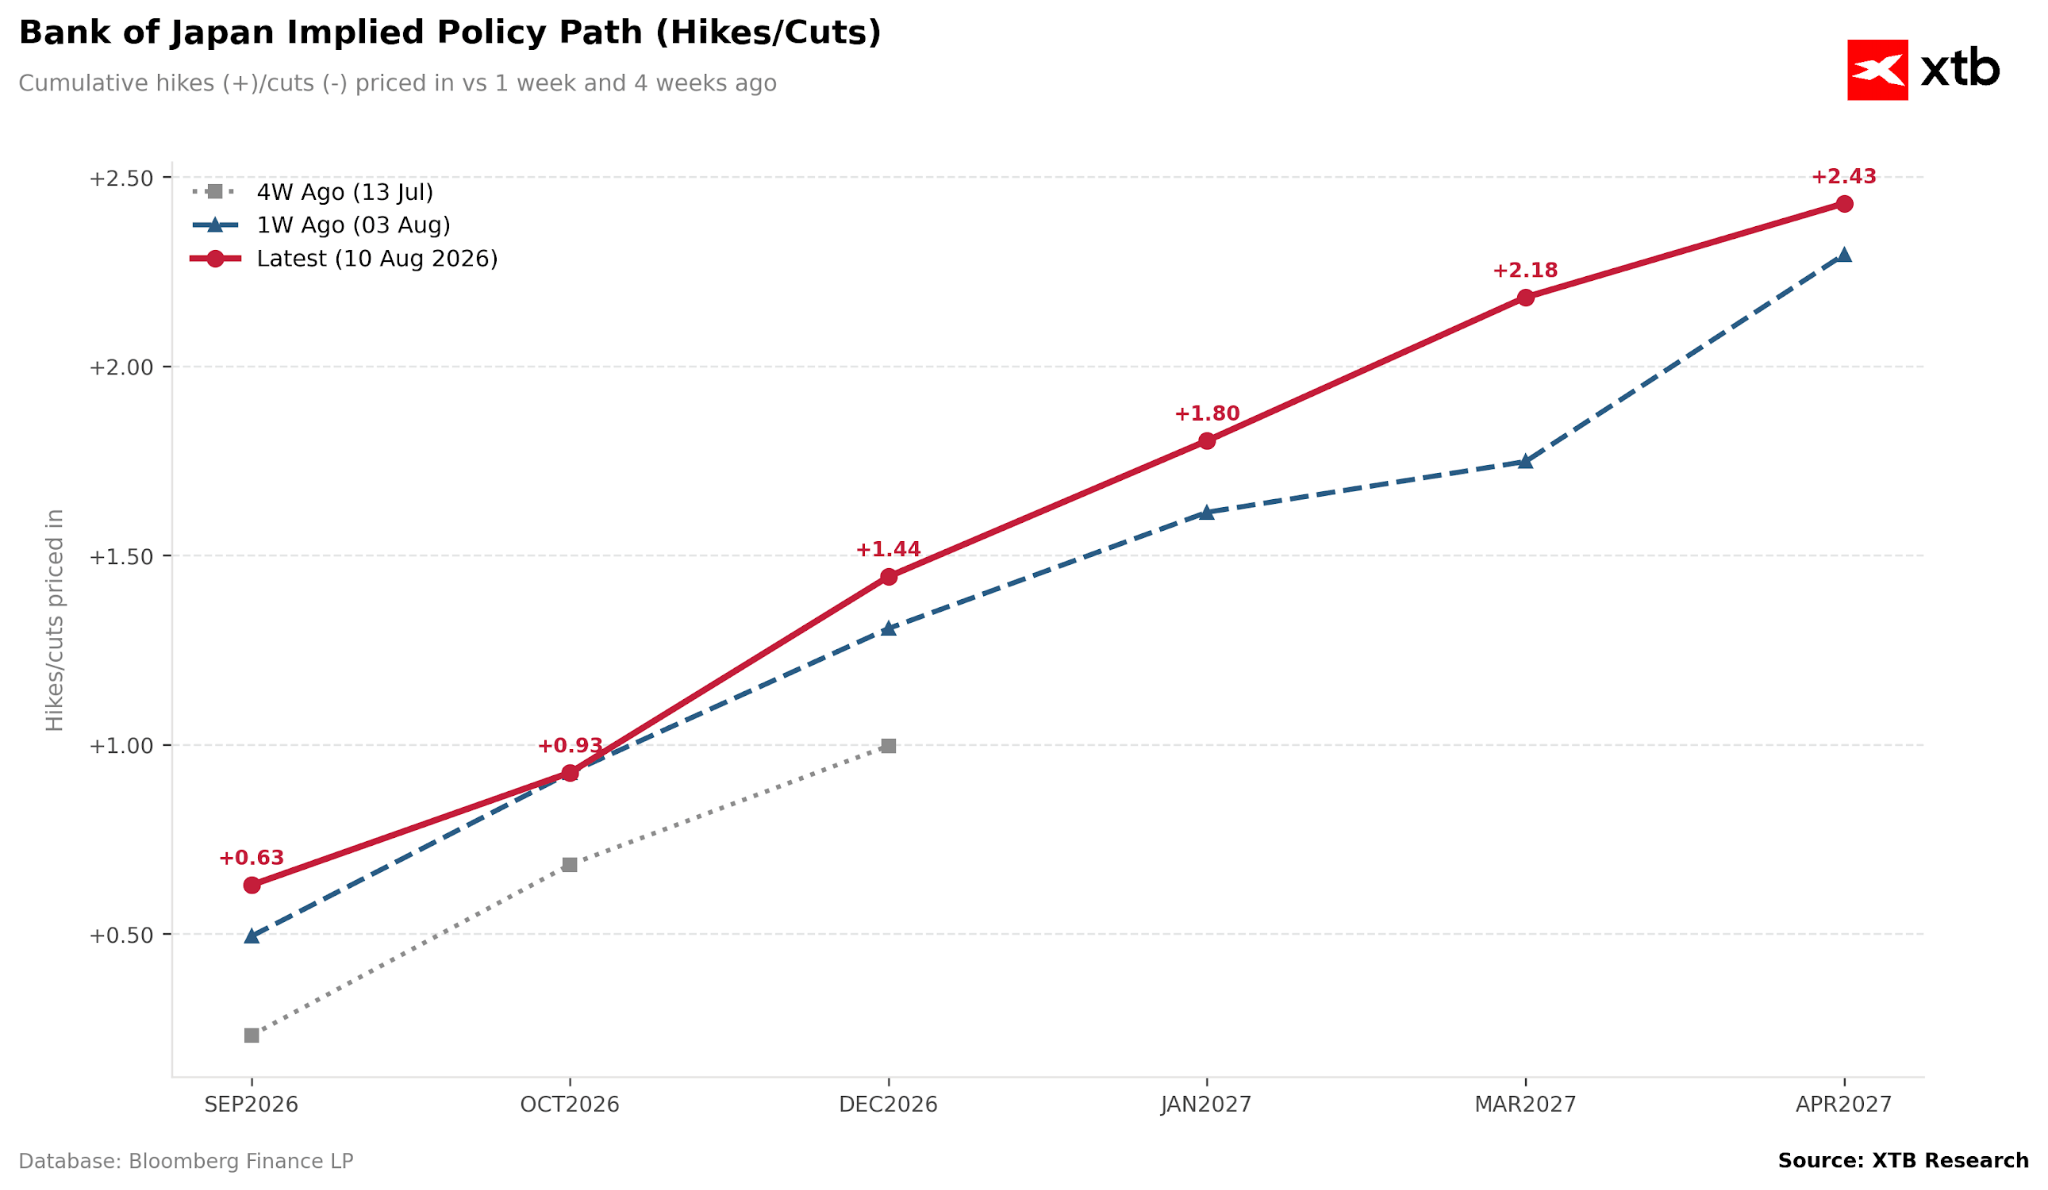
Source: xStation, 10.08.2026 Currently, the interest rate differential between both sides of the ocean stands at 2.675%. Market valuations suggest that it will narrow slightly in the coming months, reaching approximately 2.35% in July 2027. However, it seems that investors expect more decisive action from the Bank of Japan, with the next opportunity appearing only on 18 September. A decision to raise interest rates then could serve as a significant declaration for the market, leading to increased bets on subsequent hikes in the following months. Currently, such a move is priced at approximately 60%.

Figure 3: Bank of Japan Implied Policy Path (Hikes/Cuts) (2026-2027)

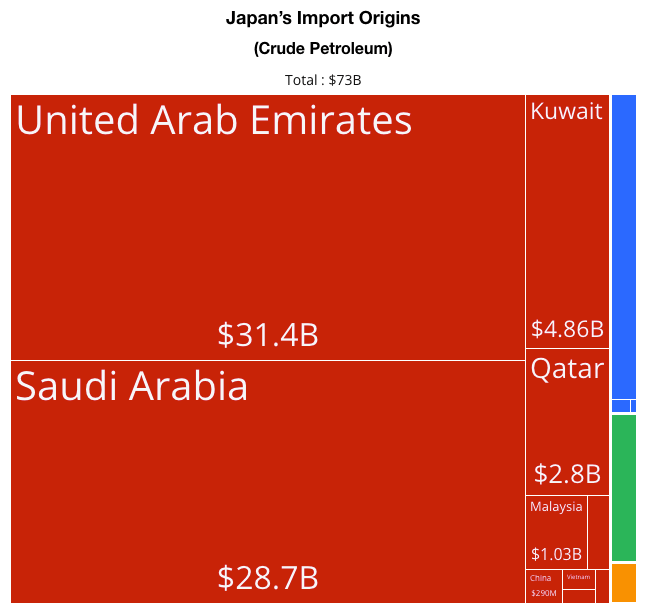
Source: XTB Research, 10.08.2026 In the meantime, the market’s attention will focus on the United States and the developing situation in the Middle East. Japan is almost entirely dependent on imports for its energy needs, and under standard conditions, nearly 90% of its crude oil comes from the Middle East. Figure 4: Japan’s Crude Oil Import Structure (2024)

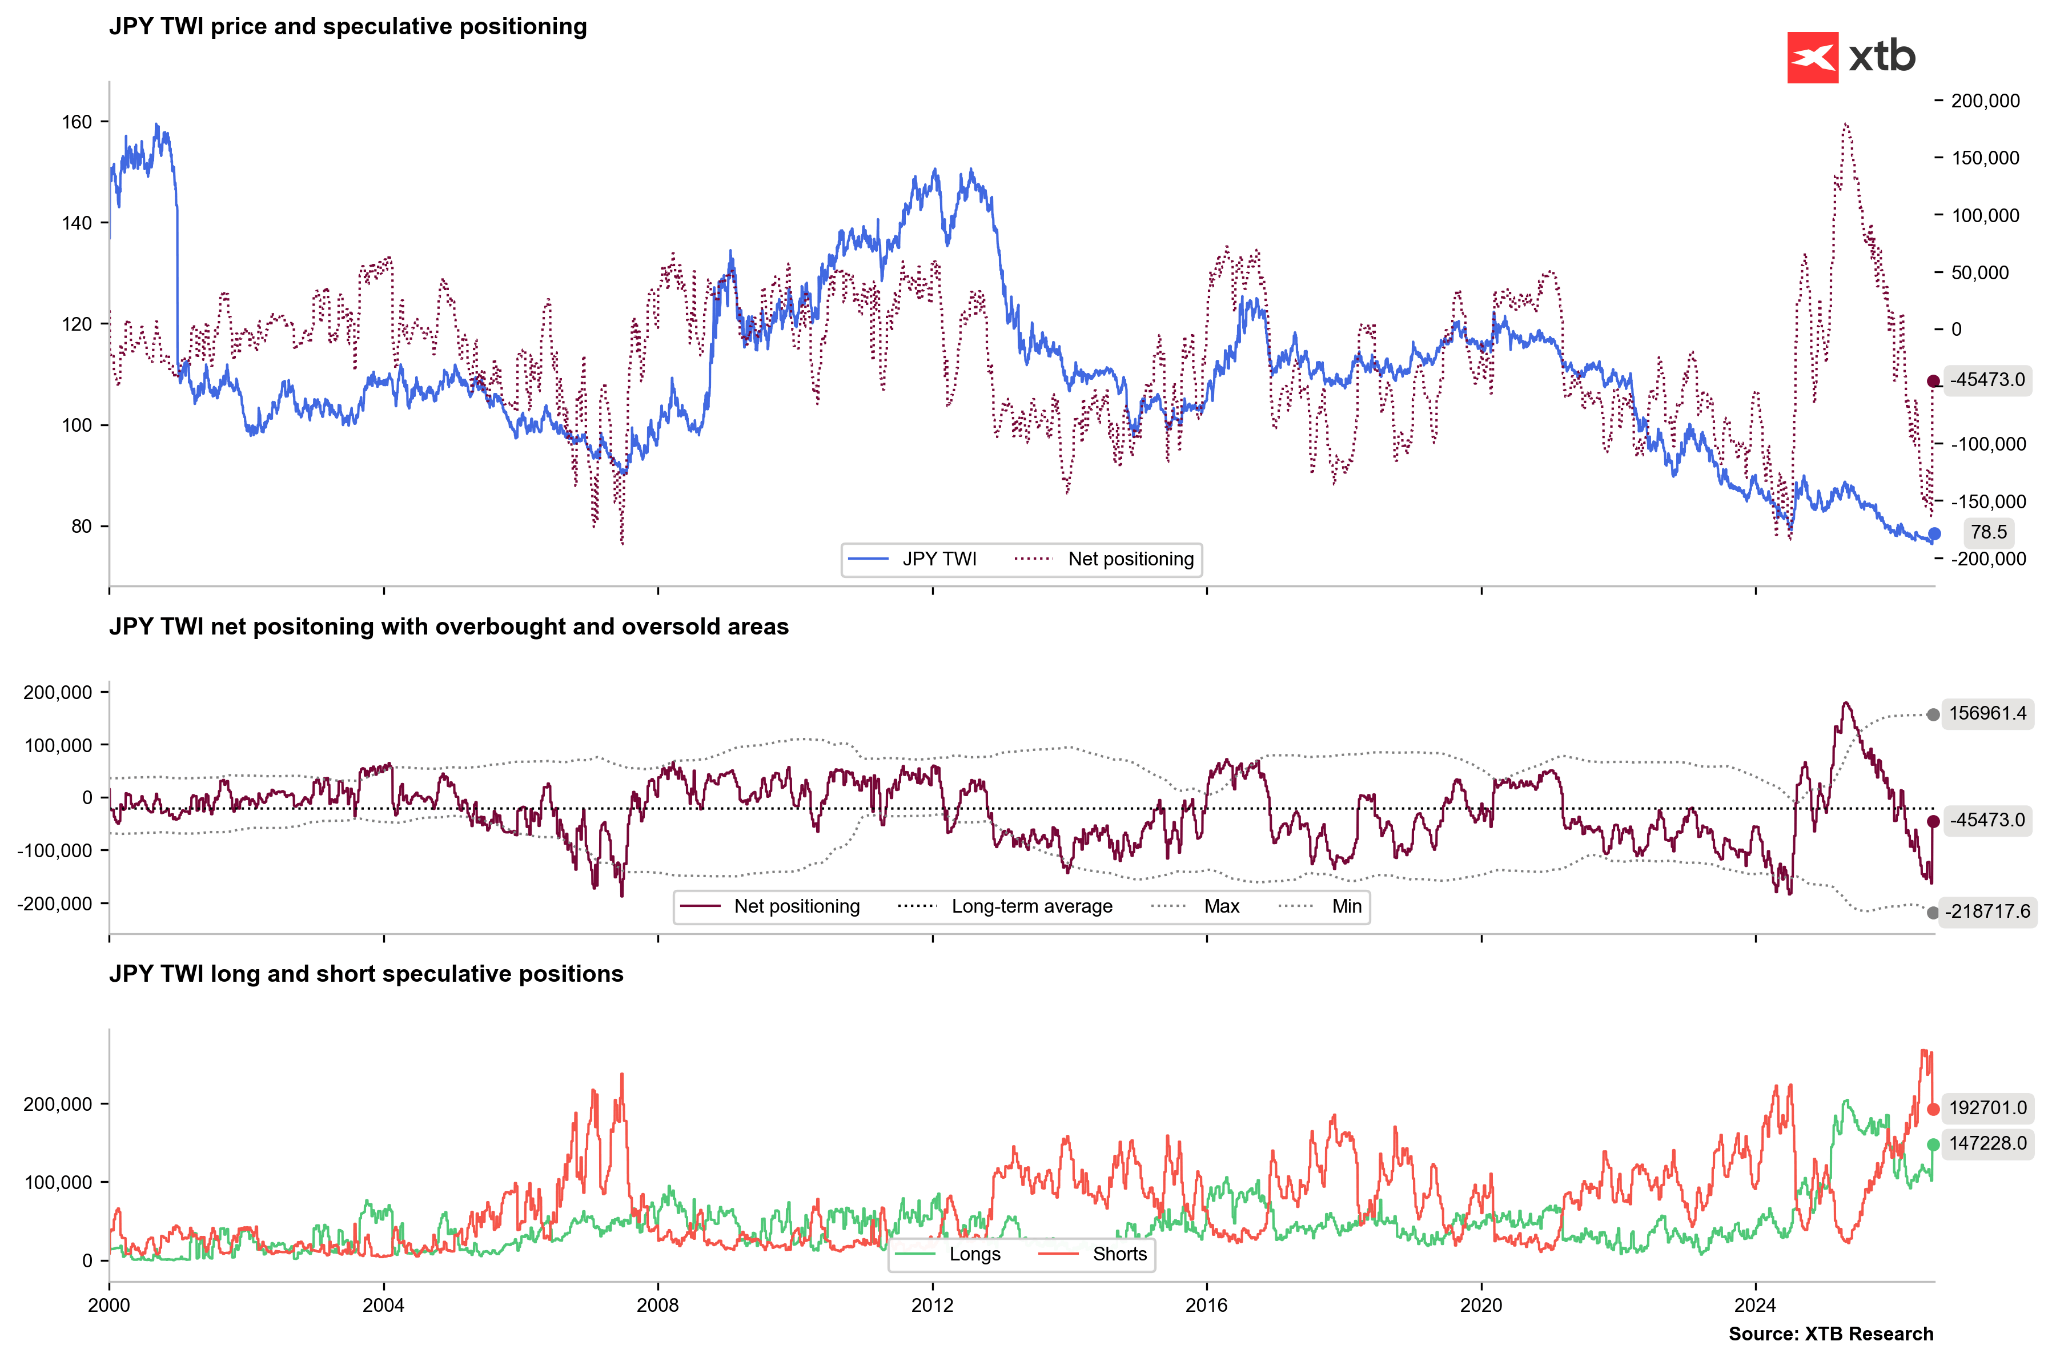
Source: OEC, 10.08.2026 However, further interventions cannot be ruled out, which the markets seem to fear. Positioning on the yen has changed significantly after many investors withdrew speculative short positions for fear of further actions aimed at defending the exchange rate. Figure 5: Yen Positioning (2000 – 2026)

Source: XTB Research, 10.08.2026

US Dollar (USD)

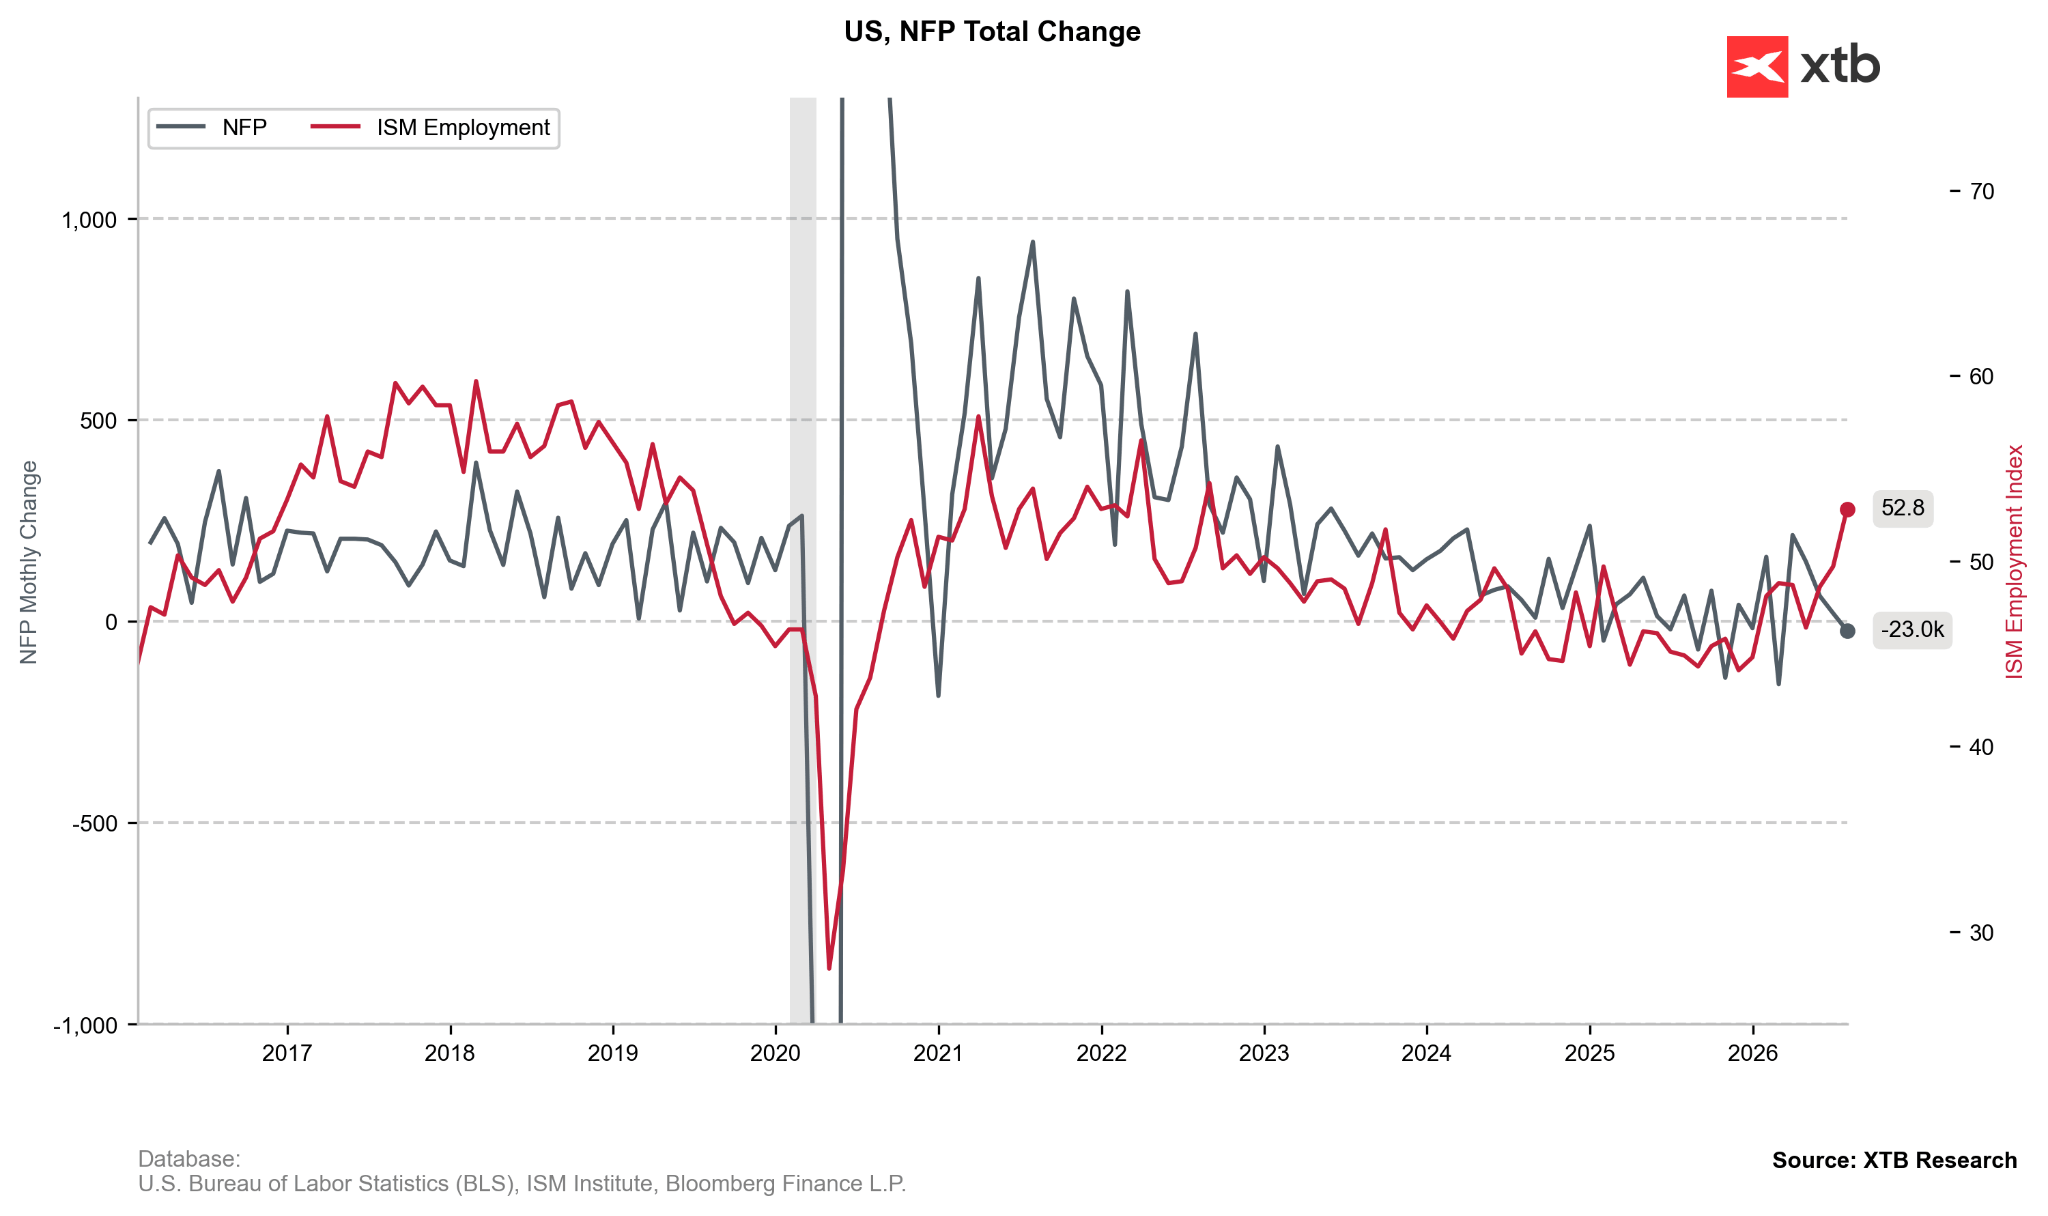
The July NFP report has been published. The number of new jobs in the US economy fell by 23 thousand, missing expectations by 5 standard deviations. Although extreme phenomena occur much more frequently in the world of macroeconomics (the so-called fat tails), assuming the data follows a normal distribution, we would have to wait 290,000 years for another such reading. Figure 6: NFP and Employment Component in ISM PMI (2016 – 2026)

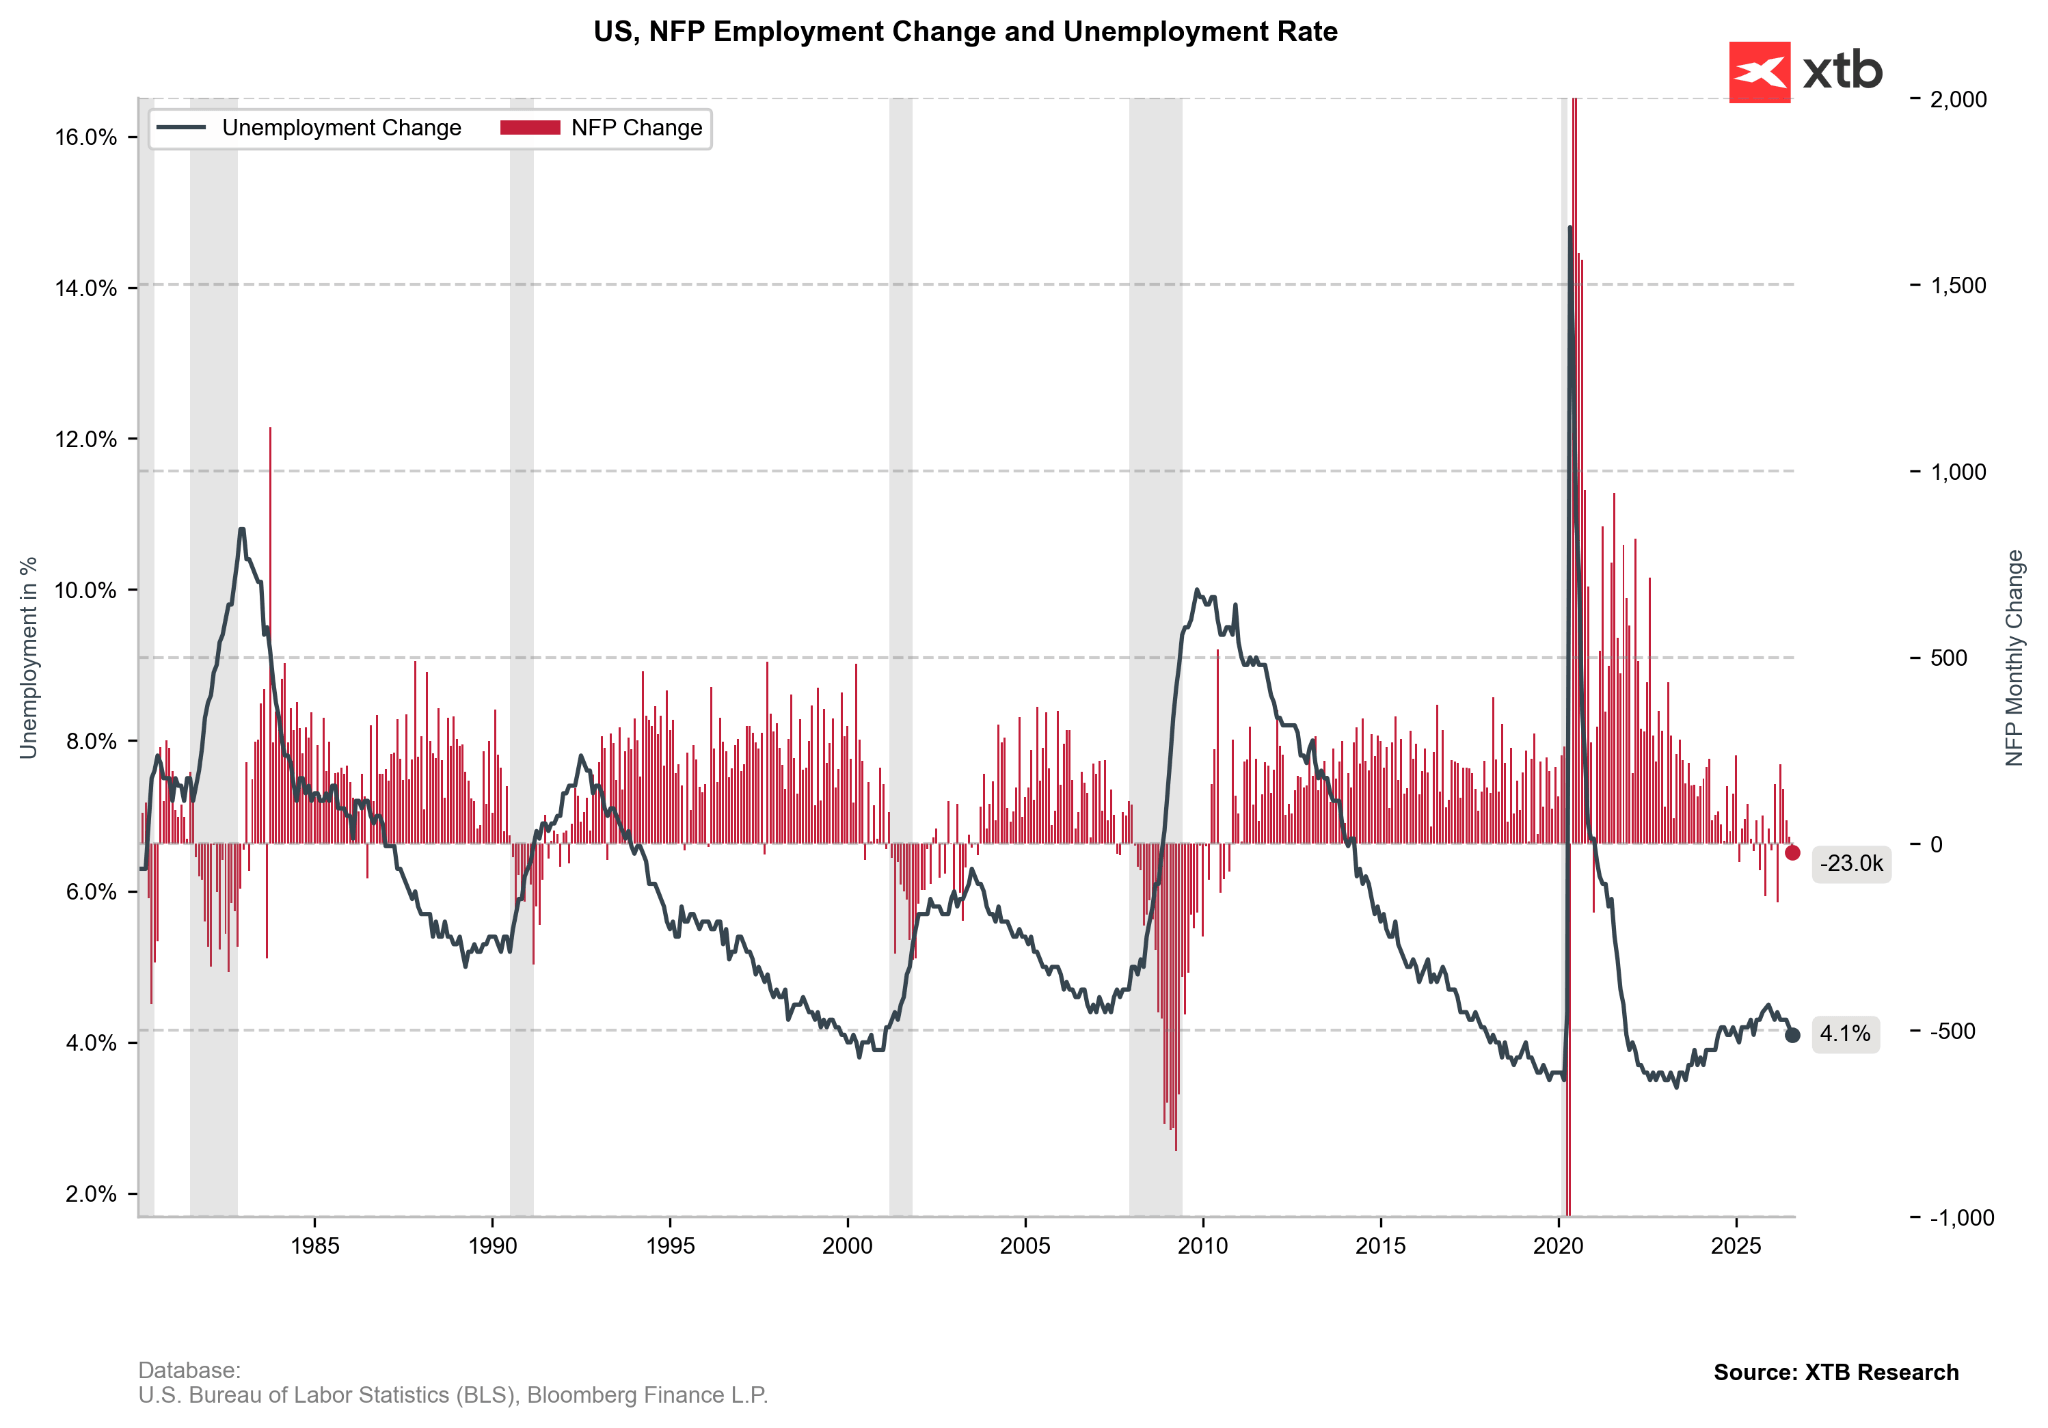
Source: XTB Research, 10.08.2026 The market reaction was certainly noticeable, though not as strong as many might have expected. The dollar’s losses were limited by, among other things, a decline in the unemployment rate (to 4.1%) and problems with seasonal adjustment of the data (the decline resulted mainly from a lower number of jobs in the public education sector). Figure 7: NFP and Unemployment Rate (1980 – 2026)

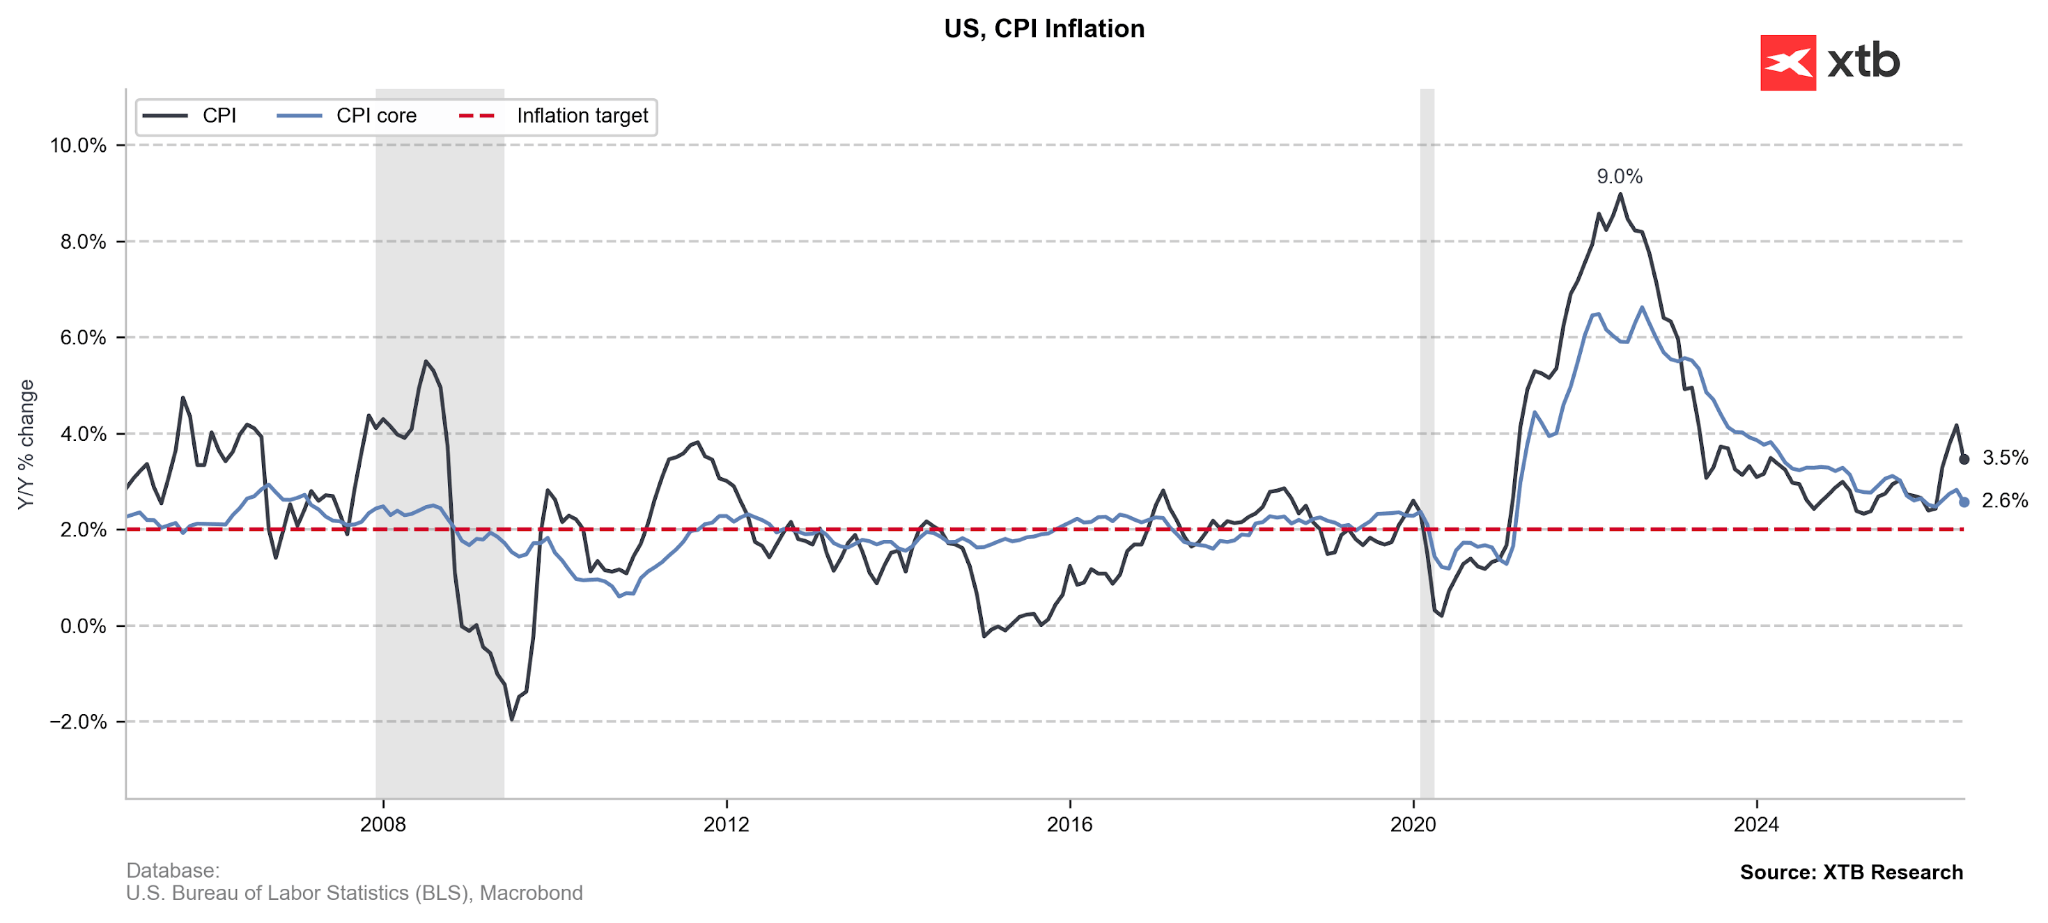
Source: XTB Research, 10.08.2026 It is worth noting, however, that higher energy prices have affected companies in the retail, leisure, and hospitality sectors (this despite the World Cup ending in July). Investors are currently unsure which direction the Fed will take in September; looking at market valuations, the chances of a hike can be compared to a coin toss. All eyes are on the July inflation reading scheduled for Wednesday. If, despite rising oil and gas prices, it shows similar values to June, we expect the committee led by Kevin Warsh to refrain from a hike until the next meeting. Figure 8: US CPI Inflation (2004 – 2026)

Source: XTB Research, 10.08.2026 For Warsh himself, this would be an exceptionally comfortable situation. In the event of intensifying inflation concerns, the committee would be almost forced to raise rates, especially in the face of revived discussions regarding the Fed’s independence. The topic returned to the table after further threats from Donald Trump directed at Lisa Cook, one of the FOMC decision-makers. These appeared more than a month after the Supreme Court deemed the president’s recent actions in this area unlawful.

Currency Hedger No Comments

EUR/JPY Price Remains below 183.00 as bearish bias prevails

  • EUR/JPY could find primary support at the nine-day EMA at 183.34.
  • The 14-day Relative Strength Index at 47.63 indicates prevailing bearish bias.
  • The initial barrier lies at the 50-day EMA at 184.57.

EUR/JPY depreciates after registering modest gains in the previous day, trading around 183.80 during the Asian hours on Tuesday. The Relative Strength Index (14) at 47.63 sits just below the neutral 50 line, hinting at ongoing bearish momentum without yet reaching oversold conditions.

The EUR/JPY cross is holding a mildly bearish near-term bias as it remains below the 50-day Exponential Moving Average (EMA) while it is positioned just above the nine-day EMA. This configuration suggests the cross is caught between short-term support and overhead trend resistance, with price action vulnerable to further downside while the longer EMA caps the topside.

The initial support lies at the nine-day EMA at 183.34. A successful break below the short-term moving average would reinforce the bearish bias and put downward pressure on the EUR/JPY cross to fall toward the eight-month low of 179.37, reached on August 3, followed by the nine-month low of 175.70.

On the upside, the EUR/JPY cross could rise toward the primary resistance at the 50-day EMA at 184.57. Further advances above the medium-term moving average would cause a bullish emergence and support the currency cross to explore the region around the all-time high of 187.95, which was recorded on April 17.

Markets edge toward BoJ tightening as hike odds firm into year-end

BNYโ€™s Wee Khoon Chong notes that policy expectations have shifted meaningfully, with โ€œmarkets now pricing in roughly a 50% chance of a 25bp BoJ hike in September and a full hike by year-end,โ€ underscoring the growing conviction that the BoJ will move further away from its ultra-accommodative stance over the coming months.

Chart Analysis EUR/JPY
EUR/JPY: Daily Chart
Currency Hedger No Comments

GBP clings to gains against US Dollar, US CPI in focus

  • The British Pound trades firmly at around 1.3500 against the US Dollar.
  • Investors await the US CPI data for July and the UK Q2 GDP data.
  • The Fed is not expected to raise interest rates in September anymore.

The British Pound (GBP) holds onto two-day gains marginally at around 1.3500 against the US Dollar (USD) during the Asian trading session on Tuesday. The GBP/USD pair remains firm as the British Pound outperforms despite financial markets pricing out the possibility of an interest rate hike by the Bank of England (BoE) in the near term.

Pound Sterling Price This week

The table below shows the percentage change of British Pound (GBP) against listed major currencies this week. British Pound was the strongest against the Japanese Yen.

USDEURGBPJPYCADAUDNZDCHF
USD0.08%-0.18%0.89%-0.14%0.08%0.12%0.29%
EUR-0.08%-0.27%0.79%-0.29%-0.06%-0.06%0.11%
GBP0.18%0.27%1.01%-0.03%0.21%0.23%0.36%
JPY-0.89%-0.79%-1.01%-0.71%-0.47%-0.59%-0.39%
CAD0.14%0.29%0.03%0.71%0.25%0.12%0.47%
AUD-0.08%0.06%-0.21%0.47%-0.25%0.00%0.14%
NZD-0.12%0.06%-0.23%0.59%-0.12%-0.00%0.15%
CHF-0.29%-0.11%-0.36%0.39%-0.47%-0.14%-0.15%

The heat map shows percentage changes of major currencies against each other. The base currency is picked from the left column, while the quote currency is picked from the top row. For example, if you pick the British Pound from the left column and move along the horizontal line to the US Dollar, the percentage change displayed in the box will represent GBP (base)/USD (quote).

Strategists at Rabobank point out that โ€œfor the UK, the market is currently pricing in a reduced expectation of a rate hike by the end of the year,

This week, the major trigger for the British currency will be the preliminary United Kingdom (UK) Q2 and the June month Gross Domestic Product (GDP) data, which will be released on Thursday. In the April-June period, the UK economy is expected to have grown at a moderate pace of 0.4% vs. the previous reading of 0.6%. On a monthly basis, the GDP is seen contracting by 0.1%.

Meanwhile, the US Dollar Index (DXY) trades almost flat at press time, holding onto Mondayโ€™s recovery move at around 99.80. The USD Index is expected to remain sideways as investors await the United States (US) Consumer Price Index (CPI) data for July, which will be released on Wednesday.

US inflation seen firming but not reaccelerating in July

Brown Brothers Harrimanโ€™s Elias Haddad expects the upcoming US July CPI report to show inflation “firm modestly but stop short of signaling a renewed acceleration in inflation.” He notes that “headline CPI is expected to rise +0.1% m/m vs. -0.4% in June and ease to 3.4% y/y vs. 3.5% in June,” while “core CPI is expected to rise +0.2% m/m vs. 0.0% in June and ease to 2.5% y/y vs. 2.6% in June.” The data are due Wednesday and, in Haddadโ€™s view, should confirm a gradual cooling in underlying price pressures rather than a renewed upswing.

The US inflation data will have a significant impact on the Federal Reserve’s (Fed) interest rate expectations, as the July monetary policy statement showed heightened concerns among policymakers toward upside inflation risks.

Lately, traders have priced out the possibility of a Fed interest rate hike in the September meeting after the release of weak US Nonfarm Payrolls (NFP) data for July.

GBP/USD Technical Analysis

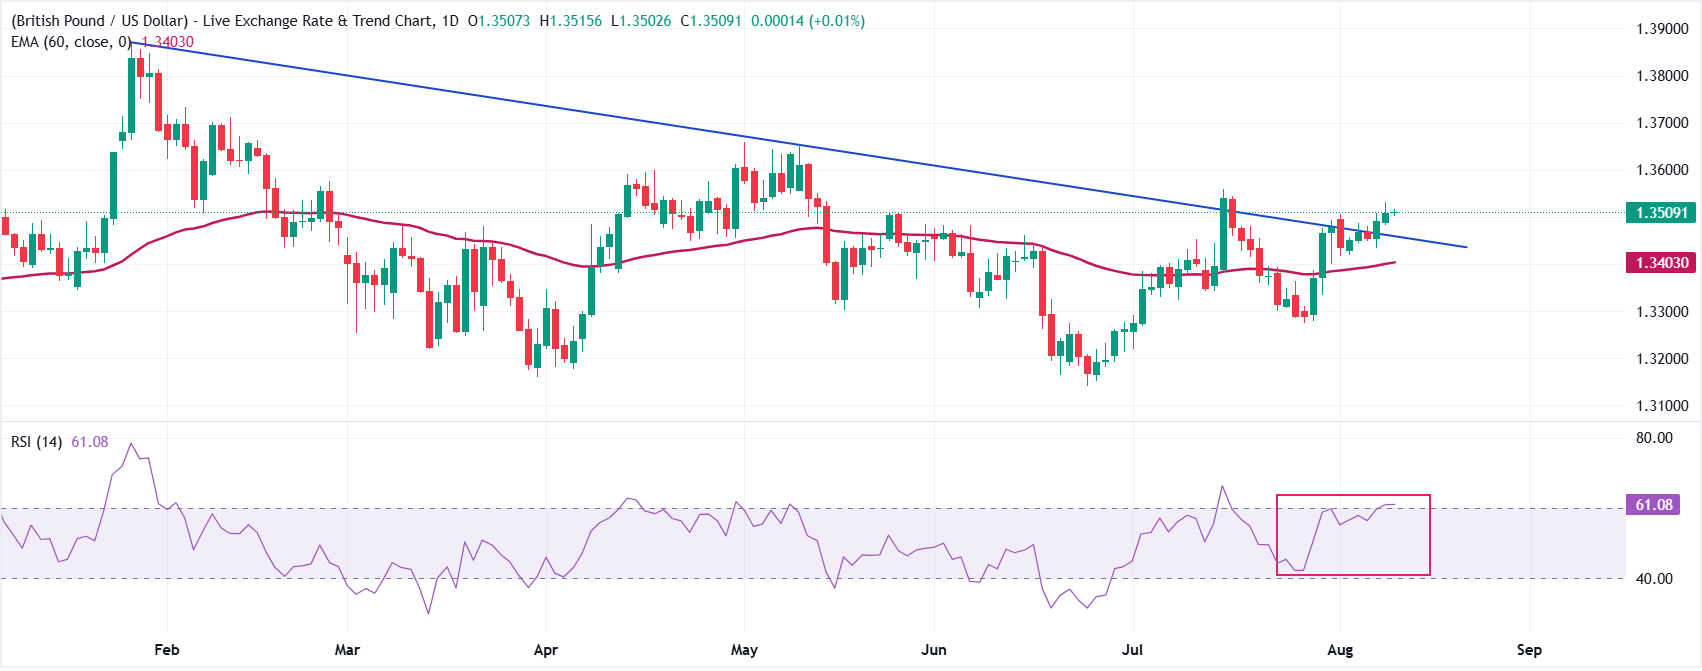
In the daily chart, GBP/USD trades at 1.3500, retaining a bullish near-term tone as spot holds above the 60-day exponential moving average (EMA) at 1.3403 and the broken downward resistance trend line now offering support around 1.3456. The Relative Strength Index (14) at 61.1 leans into positive territory, suggesting buyers remain in control while momentum is not yet stretched into overbought conditions.

On the downside, immediate support emerges at the former trend-line cap turned floor near 1.3456, followed by the 60-day EMA at 1.3403, where a deeper pullback would be expected to attract fresh demand. As long as GBP/USD defends these layers of underlying support, the pair would likely continue to favor the topside, with bulls eyeing further gains above the recent 1.3509 close in the sessions ahead.

Currency Hedger No Comments

Canadian Dollar sits near two-month top vs USD amid bullish oil prices

  • USD/CAD languishes near a two-month low as bullish oil prices continue to underpin the Loonie.
  • Geopolitical uncertainties, inflation risks and Fed hike bets support the USD and help limit losses.
  • Traders also seem hesitant and await the latest US inflation figures before placing directional bets.

The USD/CAD pair is seen consolidating its recent losses to a two-month low, touched last week, and trading below mid-1.3900s during the Asian session on Tuesday. Traders now seem hesitant to place aggressive directional bets amid a mixed fundamental backdrop and ahead of the crucial US inflation figures.

The US-Iran standoff dampens hopes for a swift reopening of the Strait of Hormuz, which, along with restricted shipping traffic through the Bab el-Mandeb Strait, continues to fuel supply concerns and supports crude oil prices. Moreover, Friday’s upbeat Canadian employment details seem to underpin the commodity-linked Loonie and act as a headwind for the USD/CAD pair, though a modest US Dollar (USD) strength helps limit the downside.

Investors remain worried about inflation risks stemming from volatile oil prices, which might force the US Federal Reserve (Fed) to adopt a more hawkish stance. In fact, traders are still pricing in a greater possibility that the US central bank will hike interest rates at least once by the end of this year. This, along with geopolitical uncertainties, assists the safe-haven buck in preserving the previous day’s modest gains and acts as a tailwind for the USD/CAD pair.

Traders, however, opt to wait for more cues about the Fed’s future policy path before positioning for the next leg of a directional move. Hence, the focus will remain glued to the US Consumer Price Index (CPI) and the Producer Price Index (PPI), due for release on Wednesday and Thursday, respectively. The crucial data, along with further developments surrounding the Middle East crisis, should provide a fresh impetus to the USD and the USD/CAD pair.

USD/CAD daily chart

Chart Analysis USD/CAD

Technical Analysis

The USD/CAD pair trades just above the 100-day Simple Moving Average (SMA) at 1.3918, with a break below this level likely to expose the recent closing area around 1.3900. On the flip side, spot prices would need to clear recent swing highs to extend the advance, while the close proximity of price to the 100-day SMA hints at a consolidation phase rather than an aggressive trend move.

Currency Hedger No Comments

Japanese Yen holds range in thin holiday trading amid intervention speculations

  • Japanese Yen holds steady during Mountain Day holiday while markets weigh potential intervention amid thin liquidity.
  • The BoJ may raise rates in September to counter inflation from a weak yen and rising oil.
  • A weak July US payrolls report created headwinds for the US Dollar, introducing rate uncertainty following dovish policy repricing.

USD/JPY moves little after posting nearly 1% gains in the previous day, trading around 159.30 during the Asian hours on Tuesday. The pair moved little today, trading in tight ranges as market volumes remained thin with Japanese markets closed for the Mountain Day holiday.

The Japanese Yen (JPY) has retraced about half of the gains made during its recent intervention-driven rally, directly testing the resolve of officials in both Tokyo and Washington to support the currency.

According to a Reuters analyst, Japan’s decision not to follow through on its joint intervention, especially by failing to amplify Friday’s US Dollar (USD) weakness following soft US jobs data, suggests a passive strategy designed merely to slow the Dollar’s rise rather than fundamentally reverse the Yen’s multi-year decline. This distinction is critical for market positioning, as investors remain heavily short on the Yen, holding the largest net-short positions since early 2024. With liquidity reduced, analysts note that Tuesday’s holiday in Japan could serve as a prime strategic window for authorities to launch another intervention.

Meanwhile, monetary policy expectations in Japan continue to shift. According to Jiji Press, the Bank of Japan (BoJ) may consider another interest rate increase at its upcoming September 17โ€“18 meeting, following its rate hike in June, to combat growing inflationary risks. Domestic prices face upward pressure from rapid growth in artificial intelligence-related demand, the Yen’s ongoing depreciation, and elevated global crude oil prices. A September hike would mark an accelerated timeline for the central bank, upending the consensus among financial market participants who had previously anticipated rate increases roughly once every six months.

Yen rates market leans toward BoJ lift-off by year-end

BNYโ€™s Wee Khoon Chong notes that rate expectations have shifted meaningfully, with markets now โ€œpricing in roughly a 50% chance of a 25bp BoJ hike in September and a full hike by year-end,โ€ underscoring growing conviction that the BoJ will begin normalising policy over the coming months.

The USD/JPY pair holds losses as the US Dollar (USD) faces headwinds following a weaker-than-expected July payrolls report. The soft labor data sparked a dovish shift in market expectations, reintroducing two-sided policy risk into a market that had previously expected the Federal Reserve (Fed) to keep interest rates strictly on hold.

However, the US Dollar may regain its ground as geopolitical tension has driven a sharp rally in crude oil, which in turn has pushed Treasury yields higher. Concerns are growing that the Federal Reserve (Fed) may feel compelled to raise rates sooner rather than later, even against the backdrop of a cooling labor market.

Investors are now closely watching upcoming inflation data this week to gauge the Fed’s next move, with the CME FedWatch Tool showing that market-implied odds of a 25-basis-point Fed rate hike in September have climbed above 51%, up from 44.4% just a day prior.

Barkin flags uneasy labor tone but strong earnings keep Fed bias hawkish

Barkinโ€™s latest remarks strike a cautiously uneasy tone on the labor market, with the description of โ€œlow hire, low fireโ€ and a โ€œsector in weak balanceโ€ pointing to softer job dynamics despite no acute stress. The FXS Speechtracker score of 5.4/10 sits slightly below the historical average of 5.8/10, underscoring a modestly less confident stance, even as Barkin highlights โ€œquite strongโ€ and โ€œgrowing nicelyโ€ corporate earnings and explicitly watches those earnings for linkages to the job market. Overall, the mix of labor unease and solid corporate performance suggests a nuanced policy bias that is less upbeat than the established baseline but not decisively dovish for the Dollar.

The FXS Fed Sentiment Index fell by 1.68 points to 137.01, signaling a pullback in hawkish tone relative to recent communications. However, with the FXS Fed Sentiment Index still well above the neutral 100 mark, the Fed remains firmly in hawkish territory despite the softer labor rhetoric captured in the FXS Speechtracker.

Currency Hedger No Comments

New Zealand Dollar remains confined in a range vs USD amid Iran risks, ahead of US CPI

  • NZD/USD struggles to gain any meaningful traction amid mixed fundamental cues.
  • Geopolitical risks, inflation fears and Fed rate hike bets support the safe-haven USD.
  • The RBNZโ€™s hawkish tilt limits the downside for the NZD as traders await the US CPI.

The NZD/USD pair seesaws between tepid gains/minor losses during the Asian session on Tuesday and currently trades just below the 0.5900 mark. Spot prices, however, remain confined within a familiar range held over the past week or so, awaiting a fresh catalyst before the next leg of a directional move. Hence, the focus will remain on further developments surrounding the Middle East crisis and the latest US inflation figures this week.

The crucial US Consumer Price Index (CPI) and the Producer Price Index (PPI) are due for release on Wednesday and Thursday, respectively, which will be looked for more cues about the US Federal Reserve’s (Fed) future policy path. This, in turn, will play a key role in influencing the near-term US Dollar (USD) price dynamics and provide some meaningful impetus to the NZD/USD pair. In the meantime, the mixed fundamental backdrop is holding back traders from placing aggressive bets on the USD.

The disappointing US Nonfarm Payrolls (NFP) report forced investors to scale back their expectations for an immediate interest rate hike by the Fed. However, inflation risks stemming from volatile oil prices due to the Iran war underpin prospects for at least one Fed rate hike in 2026. The outlook remains supportive of elevated US Treasury bond yields, which, along with fading hopes for a US-Iran deal, continues to act as a tailwind for the safe-haven Greenback and caps the NZD/USD pair.

Iran ruled out any future negotiations with Trump and said that it will wait until the US Presidentโ€™s term ends on January 20, 2029, to resume talks, dampening hopes for a swift reopening of the Strait of Hormuz. Moreover, traffic through the Bab el-Mandeb Strait remains choked due to the Iran-backed Houthis’ naval blockade against Saudi Arabia. This favors USD bulls, though the Reserve Bank of New Zealand’s (RBNZ) hawkish tilt could limit deeper losses for the NZD/USD pair.

Strategists at BBH remain constructive on the Kiwi, arguing that โ€œNZD has room to keep edging higher against most major currencies.โ€ They point to โ€œabove target inflation, more favorable domestic growth outlook, and a policy rate near the lower-end of the RBNZโ€™s neutral range (2.20%-4.10%)โ€ as factors that โ€œargue for additional RBNZ rate hikes.โ€ Reflecting this backdrop, BBH notes that โ€œthe swaps curve price in nearly 100bps of cumulative tightening over the next twelve months to 3.50%,โ€ reinforcing the view that policy expectations continue to offer support for the currency.

NZD/USD 4-hour chart

Chart Analysis NZD/USD

Technical Analysis

The NZD/USD pair continues to consolidate in an over one-week-old range, leaving the near-term bias neutral. The focus remains on whether spot prices can sustain a move away from the 0.5880 area to define the next directional leg. A sustained push higher would open the way for a test of recent minor intraday highs, while a break lower from the current congestion zone would expose prior four-hour lows as the next bearish objective.