


The dollar index steadied around 101.5 on Friday after coming under pressure in the previous session, but remained on track for a weekly gain as markets continued to expect the Federal Reserve to raise interest rates later this year. On Thursday, the greenback weakened after the latest US PCE inflation report came in broadly in line with expectations. Although inflation remains well above the Fed’s 2% target, the data helped ease concerns about a sharper-than-anticipated pickup in price pressures. Even so, markets are pricing in an 80% chance of a Fed rate hike in December following last week’s hawkish pause, while the probability of a September increase stands at around 63%. New York Fed President John Williams also said on Thursday that inflationary pressures are likely to moderate this year but remain uncomfortably high.

Yen Stays Near 40-Year Low
The Japanese yen traded around 161.7 per dollar on Friday, hovering near its weakest level since 1986 despite data showing Tokyo’s core inflation accelerated for the first time in eight months, reinforcing expectations that the Bank of Japan will continue raising interest rates. On Wednesday, BOJ Governor Kazuo Ueda reaffirmed his commitment to further rate hikes in line with economic, inflation, and financial developments. A day later, hawkish board member Naoki Tamura also advocated raising rates every few months. The BOJ is due to announce its next policy decision on July 31. The yen remained under pressure despite repeated verbal warnings from Japan’s Finance Ministry and record currency intervention in recent weeks, as a stronger dollar and the wide interest rate differential with the US continued to weigh on the currency while the Federal Reserve is expected to raise rates later this year.

Offshore Yuan Heads for 2nd Weekly Loss
The offshore yuan weakened to around 6.80 per dollar on Friday and was on track for a second consecutive weekly loss, remaining under pressure from a broadly strong US dollar. The greenback continued its momentum after the Federal Reserve recently adopted a more hawkish stance, leading markets to price in a 75% probability of a rate hike as early as September. Meanwhile, the People’s Bank of China unveiled plans to introduce overnight reverse repo operations on June 29–30 as part of the next phase of its monetary policy framework reform. This will complement the existing seven-day reverse repo rate, bringing the PBOC’s policy toolkit more closely in line with those of major central banks, including the Federal Reserve. On the economic front, fiscal expenditure rose 0.8% year-on-year to CNY 11.39 trillion ($1.59 trillion) in the first five months of 2026. Central government spending increased 6.5% to CNY 1.68 trillion, while local government expenditure fell 0.1% to CNY 9.71 trillion.

Chart of The Day – AUD/USD down despite strong Austarlian job market data
n labour market proved more resilient than expected, with the unemployment rate falling to 4.4% from a five-year high of 4.5% , while employment increased by 40.3k , comfortably beating expectations for a gain of around 30k . At the same time, household spending surprised to the upside, rising 1.3% in May versus market expectations of just 0.5% . For investors, the key takeaway is that the combination of a strong labour market, resilient consumers and still-elevated inflation complicates the case for an early policy easing by the Reserve Bank of Australia (RBA). Money markets continue to price roughly an 80% probability that the RBA will leave interest rates unchanged in August , but the latest data has strengthened the arguments in favour of another rate hike. For the Australian dollar, this provides potential support from a relatively hawkish central bank, although the medium-term direction of the AUD will depend on upcoming inflation and labour market data.
Labour market: Headline numbers beat expectations
The latest figures from the Australian Bureau of Statistics (ABS) showed that the unemployment rate declined to 4.4% , after previously rising to 4.5% , its highest level in five years. This was an important surprise, as economists had expected unemployment to remain unchanged at 4.5%. Employment increased by 40.3k , significantly outperforming market forecasts. At the same time, around 18.3k people lost their jobs, leaving the overall balance of the labour market firmly positive. The ABS also noted that the backlog of people waiting to start new jobs eased during May, helping boost employment and reduce unemployment. One weaker aspect of the report was a 1.1% decline in hours worked . According to the ABS, this was largely due to Australians catching up on leave that had not been taken during April. At first glance, the report appears very strong: unemployment is falling, employment is rising, and consumers are spending more. These are typically supportive conditions for both the Australian dollar and government bond yields. However, the decline in hours worked and sluggish employment growth over recent quarters suggest the labour market may not be as strong beneath the surface as the headline figures imply. The economy could be approaching a turning point, but it has not reached one yet. For the RBA, the latest data still do not provide sufficient evidence that economic conditions are cooling sustainably.
RBA faces a difficult balancing act
The Reserve Bank of Australia has a dual mandate: maintaining inflation within its 2–3% target range while supporting full employment. The latest economic releases suggest that the Australian economy remains too resilient for the central bank to comfortably shift toward a more dovish stance. The next set of inflation and labour market data for June will therefore be crucial, as it will represent the final major batch of macroeconomic information before the RBA’s August policy meeting. The RBA recently left its cash rate unchanged at 4.35% , following three consecutive 25-basis-point rate hikes in 2026. Since the beginning of the year, the official cash rate has increased from 3.60% to 4.35% . For financial markets, the August meeting remains finely balanced. Money markets still assign roughly an 80% probability to a pause , but stronger employment data and the rebound in household spending make such a decision less straightforward.
Inflation remains the key risk
Australia’s headline CPI inflation eased to 4.0% YoY in May , down from 4.2% in April. At first glance, this appears to be encouraging news for the RBA. However, much of the improvement was driven by the Australian government’s temporary reduction in fuel excise taxes. Automotive fuel prices declined 11.9% in May , following a 7.0% decline in April. More importantly, the trimmed mean inflation rate —the RBA’s preferred measure of underlying inflation—rose to 3.6% from 3.4% , indicating that underlying price pressures remain persistent after excluding the most volatile components. For traders, this is the critical part of the inflation story. Unless core inflation begins to decline more convincingly, the RBA may have little choice but to maintain its hawkish rhetoric or even consider another rate increase.
Household spending rebounds
Another important feature of the latest data release was the 1.3% increase in household spending during May . This marked a sharp recovery following declines of 1.1% in April and 1.7% in March . The figure significantly exceeded expectations of a 0.5% increase , suggesting Australian consumers remain surprisingly resilient despite elevated living costs, higher energy bills and rising mortgage repayments. Part of the increase reflected the normalisation of airline ticket refunds following disruptions related to the Middle East conflict. Nevertheless, the broader picture remains unchanged: household spending has yet to show signs of a meaningful slowdown. For the RBA, this creates another challenge. A resilient labour market continues to support household incomes, helping sustain consumption and making it more difficult to return inflation to target.
Mortgage holders remain under pressure
Since the beginning of 2026, the RBA’s cash rate has increased from 3.60% to 4.35% . Three consecutive quarter-point rate hikes have added approximately AUD 342 to the average monthly repayment on a typical AUD 736,000 mortgage. On an annual basis, this translates into roughly AUD 4,128 in additional borrowing costs. Should the RBA deliver a fourth rate increase, Compare the Market estimates average monthly repayments would rise by a further AUD 114 . Combined with the previous hikes, annual mortgage servicing costs would increase by around AUD 5,472 . This is particularly important for investors because household finances remain one of the key transmission channels of monetary policy in Australia. The paradox is that despite mounting pressure on borrowers, consumer spending has yet to weaken materially. This increases the likelihood that the RBA continues to view the economy as too resilient.
Labour shortages remain widespread
Despite record migration levels, Australian businesses continue to report significant labour shortages. According to ABS data, job vacancies remain 45% above pre-pandemic levels and have stayed above 325,000 vacancies for five consecutive years. The most acute shortages remain in healthcare and social assistance , where vacancies are 90% higher than before the pandemic. Manufacturing vacancies are 78% higher , electricity, gas, water and waste services are 76% above pre-pandemic levels, while mining vacancies remain 58% higher . This matters because persistent labour shortages tend to keep wage pressures elevated. As long as businesses continue competing for workers, wage inflation could remain stronger than desired even if overall economic growth slows. For the RBA, this means the labour market may stay too tight for underlying inflation to return quickly to target. For investors, it raises the probability that monetary policy will remain restrictive for longer.
Implications for the Australian dollar – AUD/USD chart
The latest labour market report is broadly supportive for the Australian dollar because it reinforces the case for higher interest rates for longer. Stronger employment, lower unemployment and resilient consumer spending all reduce the scope for the RBA to pivot toward easier monetary policy. For currency pairs such as AUD/USD , AUD/JPY and EUR/AUD , the key question is whether markets begin shifting expectations from a rate pause toward another hike. If rate hike probabilities continue to increase, the Australian dollar could receive additional support through the interest rate channel. At the same time, the Australian dollar remains highly sensitive to global risk sentiment, commodity prices and developments in China. Consequently, stronger domestic macroeconomic data alone may not be sufficient to generate a sustained uptrend if global conditions become less supportive for cyclical currencies. The main conclusion for investors is straightforward: the latest labour market report has reduced expectations of an early dovish shift by the RBA while significantly increasing the importance of the next inflation release.
Looking at the AUD/USD chart, the pair has fallen below the 200-period EMA (red line), which has generally acted as a springboard for rebounds since April 2025. The key question now is whether this latest decline marks the beginning of a more durable trend reversal or simply a deeper correction similar to previous pullbacks. The nearest major support is located around 0.67 , corresponding to the March swing lows, while the 200-period EMA near 0.70 now represents the primary resistance level.
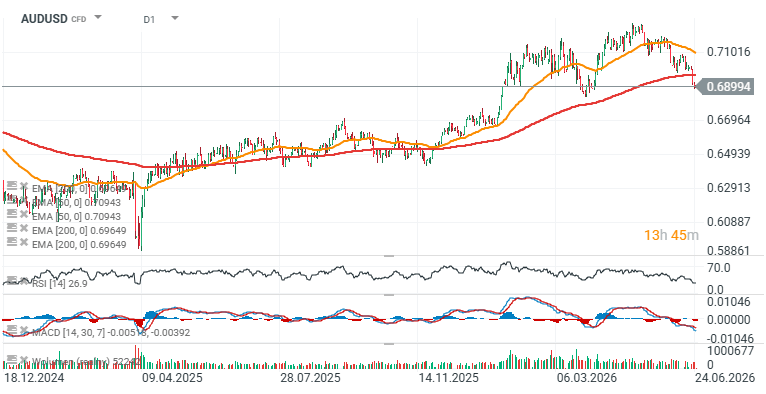
Source: xStation5
Japanese Yen bears turn cautious amid intervention fears, modest USD pullback
- USD/JPY trades with a mild negative bias and is undermined by a combination of factors.
- Easing inflationary concerns temper Fed rate hike bets and prompt some USD profit-taking.
- Intervention fears lend support to the JPY and weigh on the pair ahead of the US PCE data.
The USD/JPY pair edges lower during the Asian session on Thursday, albeit it lacks follow-through and finds support ahead of the 161.50 level. Nevertheless, spot prices remain well within striking distance of a 40-year high as traders look forward to the US Personal Consumption Expenditures (PCE) Price Index for a fresh impetus.
The crucial inflation data will dictate the Federal Reserve’s (Fed) policy path, which, in turn, will play a key role in influencing the US Dollar (USD) price dynamics and determining the next leg of a directional move for the USD/JPY pair. In the meantime, the recent decline in Crude Oil prices has eased inflationary concerns, prompting traders to scale back their bets on Fed interest rate increases. This, in turn, triggers a modest USD pullback from its highest level since May 2025, touched on Wednesday, and acts as a headwind for the USD/JPY pair.
Apart from this, heightened speculation about joint US-Japan intervention offers some support to the Japanese Yen (JPY) and further caps the upside for the currency pair. In fact, Japan’s Finance Minister Satsuki Katayama and US Treasury Secretary Scott Bessent agreed to take steps on currencies if necessary. Also, Japan’s Chief Cabinet Secretary Minoru Kihara said on Tuesday that he will take appropriate action against the foreign exchange moves if needed. This, along with a hawkish Bank of Japan (BoJ), offers some respite to the JPY bulls.
In fact, the Summary of Opinions from the BoJ’s June meeting showed that policymakers debated mounting inflation risks, with some calling for faster interest rate increases to raise borrowing costs to near levels deemed neutral to the economy. Furthermore, BoJ board member Naoki Tamura said earlier today that it is important to push the policy rate closer to the neutral level, which is about 2%. This is still lower than the Fed’s 3.5% to 3.75% target rate, however, which keeps the JPY carry trade in play and helps limit the downside for the USD/JPY pair.

Canadian Dollar strengthens as US Dollar decline despite hawkish Fed outlook
- USD/CAD loses ground as the US Dollar weakens despite rising expectations of later Fed rate hikes.
- CME FedWatch tool indicates that markets are now pricing in an 83.1% probability of rate hikes by the end of December.
- The Canadian Dollar struggles as easing US-Iran tensions cool the global oil market.
USD/CAD halts its winning streak that began on June 10, trading around 1.4230 during the Asian hours on Thursday. The currency pair depreciate as the US Dollar (USD) declines despite rising market expectations of Federal Reserve (Fed) interest rate hikes later this year.
Traders are positioning for tighter monetary policy after Federal Reserve Chairman Kevin Warsh signaled a firm focus on taming inflation, noting that the broader economy remains on a stable footing. Reflecting this hawkish shift, the CME FedWatch tool shows that markets are now pricing in an 83.1% probability of rate hikes by the end of December.
Traders focus now shifts to the upcoming US Personal Consumption Expenditures (PCE) data release, where headline inflation is expected to heat up to 4.1% YoY in May from April’s 3.8%, and core PCE is projected to edge higher to 3.4% YoY.
The commodity-linked Canadian Dollar (CAD) is struggling against its US counterpart as easing geopolitical tensions between the US and Iran cool the global oil market. Lower crude prices directly hit the Canadian economy, as Canada is the largest exporter of crude oil to the United States.
Global oil supplies are rapidly improving following breakthrough progress in US-Iran peace efforts, which has restored shipping confidence and encouraged tankers to transit the critical Strait of Hormuz with their tracking signals activated.
Underscoring this supply surge, US Energy Secretary Chris Wright stated at the Reuters Global Energy Forum in New York that roughly 20 million barrels of oil exited the Strait within a single 24-hour window, marking a clear return to normal operational flows.
Shipping data confirms this rebound, showing that three previously stranded tankers carrying 5 million barrels of crude finally exited the Gulf on Wednesday under the interim diplomatic deal. Available supply is expected to expand even further due to a temporary US waiver that permits the purchase of already-loaded Iranian oil.
Compounding the pressure on the Canadian Dollar, Canada’s 10-year government bond yield fell to a three-month low of 3.36% in late June, as signs of cooling underlying domestic inflation reinforce expectations that the Bank of Canada (BoC) will refrain from raising interest rates for the rest of the year.
Australian Dollar remains subdued following labor data
- AUD/USD loses ground as the Australian Dollar holds losses following domestic labor market data.
- Australia’s Unemployment Rate ticked down to 4.4% from 4.5%, as the economy added a strong 40.3K jobs in May.
- CME FedWatch tool indicates markets are now pricing in an 83.1% probability of rate hikes by the end of December.
AUD/USD continues its losing streak for the eighth consecutive day, trading around 0.6900 during the Asian hours on Thursday. The pair remains subdued as the Australian Dollar (AUD) holds losses following the release of domestic labor market data.
According to the latest data from the Australian Bureau of Statistics (ABS), Australia’s labor market showed strong signs of recovery in May, highlighted by the Unemployment Rate trickling down to 4.4% from April’s 4.5%. This drop aligned perfectly with market expectations. The most striking takeaway from the report was the net Employment Change, which saw an influx of 40.3K jobs. This easily surpassed the consensus forecast of a 25K increase and marked a sharp turnaround from the 40.7K jobs lost during the previous month.
Under the hood, the data reveals that while the overall Participation Rate held steady at 66.7%, the workforce expansion was primarily driven by part-time roles. Part-Time Employment surged by 35.2K positions, completely reversing the 19K decline seen in April. Full-Time Employment also bounced back, albeit more modestly, adding 5.2K jobs following a notable drop of 21.7K in the prior reading.
The AUD/USD pair weakens as the US Dollar (USD) may continue its winning streak amid rising market expectations of Federal Reserve (Fed) interest rate hikes later this year. Traders are positioning for tighter monetary policy after Federal Reserve Chairman Kevin Warsh signaled a firm focus on taming inflation, noting that the broader economy remains on a stable footing. Reflecting this hawkish shift, the CME FedWatch tool shows that markets are now pricing in an 83.1% probability of rate hikes by the end of December.
Traders await the upcoming US Personal Consumption Expenditures (PCE) data release due later in the day, where headline inflation is expected to heat up to 4.1% YoY in May from April’s 3.8%, and core PCE is projected to edge higher to 3.4% YoY.

British Pound holds gains above 1.3150, US PCE inflation data looms
- GBP/USD rebounds to around 1.3175 in Thursday’s Asian session.
- UK PM Keir Starmer resigned on Monday, throwing UK politics into sudden turmoil.
- Traders will keep an eye on the US PCE Price Index report for May, which is due on Thursday.
The GBP/USD pair recovers some lost ground to near 1.3175 during the Asian trading hours on Thursday. However, the potential upside for the major pair might be limited amid UK political instability and rising expectations of US interest rate hikes this year. Traders await the US May Personal Consumption Expenditures (PCE) inflation data on Thursday for fresh impetus.
UK Prime Minister Keir Starmer resigned on Monday, throwing the country into yet another political crisis. Starmer stepped down under intense pressure following Andy Burnham’s victory in the Makerfield by-election last week. His Labour Party will now need to select a new leader to lead the country.
Traders will closely monitor what Burnham’s policy would look like. Analysts warned that Burnham’s preferred expansionary fiscal stance, higher taxation, and increased gilt issuance could weigh on the British Pound (GBP) against the US Dollar (USD).
The US PCE Price Index report for May will take center stage on Thursday. The headline PCE is expected to show a rise of 4.1% YoY in May, compared to 3.8% in April. The core CPE inflation is projected to show an increase of 3.4% YoY in May, versus 3.3% prior. Any signs of easing inflation in the US could undermine the Greenback and create a tailwind for the major pair.
Meanwhile, traders reassess the timing of possible US rate hikes after the Federal Reserve’s (Fed) hawkish signal. Markets have priced in nearly a 34.2% probability of a 25 basis points (bps) hike at the July meeting, up from 8.5% a week ago, and 66.4% for September, up from 29.1%, according to the CME FedWatch tool.
