The Swiss Franc clings to losses near 0.8088 against the US Dollar amid hawkish Fed bets.
The Fed is highly anticipated to deliver at least one interest rate hike this year.
Investors await the US S&P Global PMI and Swiss ZEW Survey – Expectations data.
The Swiss Franc (CHF) holds onto Monday’s losses around 0.8088 against the US Dollar (USD) during the Asian trading session on Tuesday. The Swiss Franc pair faces selling pressure due to continued outperformance by the US Dollar amid firm expectations that the Federal Reserve (Fed) will hike interest rates this year.
At press time, the US Dollar Index (DXY), which tracks the Greenback’s value against six major currencies, ticks higher at around 101.05, the highest level seen in over a year.
According to the CME FedWatch tool, the odds of the Fed hiking interest rates this year are almost 87%.
Hawkish Fed bets have been intensified as the Federal Open Market Committee (FOMC) Economic Projections report, released last week, showed that nine out of 19 policymakers have projected an interest rate hike this year. It appears a sharp turnaround as none of the officials favored a hike this year in March’s Economic Projections report.
For more cues on the United States (US) interest rate outlook, investors await the US Personal Consumption Expenditure Price Index (PCE) data for May, which will be released on Thursday.
In Tuesday’s session, investors will focus on the preliminary US S&P Global PMI data for June. The Services PMI is expected to arrive higher at 51.0 from 50.7 in May.
On the Swiss Franc front, investors await the ZEW Survey – Expectations data for June, which will be released on Wednesday.
USD/JPY holds steady following the previous day’s late pullback from the 162.00 neighborhood.
Intervention fears keep the JPY bears on the back foot and act as a headwind for spot prices.
Economic concerns and the wide US-Japan rate differential offer support amid a bullish setup.
The USD/JPY pair enters a bullish consolidation phase during the Asian session on Tuesday and currently trades just above 161.50 amid mixed fundamental cues. Spot prices, however, remain well within striking distance of a 40-year peak, around the 162.00 neighborhood set in July 2024, as traders remain on edge amid fears that Japanese authorities will step in to prop up the Japanese Yen (JPY).
Local broadcaster TBS reported that Japan’s Finance Minister Katayama held an online meeting with US Treasury Secretary Bessent to discuss the JPY’s sharp decline and potential intervention. Adding to this, Japan’s Chief Cabinet Secretary Minoru Kihara said that he will take appropriate action against the foreign exchange (FX) moves if needed. This holds back JPY bears from placing fresh bets and caps the upside for the USD/JPY pair.
However, economic risks stemming from the Middle East conflict and energy supply disruptions through the Strait of Hormuz continue to undermine the JPY. Apart from this, a persistently wide Japan-US rate differential keeps the JPY bulls on the back foot. The US Dollar (USD), on the other hand, stands firm near its highest level since May 2025, lending additional support to the USD/JPY pair.
Last week’s sustained breakout through the previous intervention zone, around the 160.50-160.60 area, comes on top of the recent solid bounce from the 200-day Exponential Moving Average (EMA) and keeps the broader uptrend intact. That said, the Relative Strength Index (14) is hovering in overbought territory near 70, which hints at risk of consolidation or a corrective pause rather than a confirmed near-term top for the USD/JPY pair.
Meanwhile, the Moving Average Convergence Divergence (MACD) indicator remains positive above the zero line, reinforcing the underlying upward pressure. In the meantime, the structural pivot around 160.60-160.50 should protect the immediate downside. Moreover, the 200-day EMA at 156.47 should provide a deeper layer of trend support if a sharper corrective pullback unfolds amid elevated RSI readings.
(The technical analysis of this story was written with the help of an AI tool.)
USD/JPY daily chart
Japanese Yen Price Last 30 days
The table below shows the percentage change of Japanese Yen (JPY) against listed major currencies last 30 days. Japanese Yen was the strongest against the New Zealand Dollar.
USD
EUR
GBP
JPY
CAD
AUD
NZD
CHF
USD
1.73%
1.49%
1.66%
2.90%
2.62%
3.16%
2.85%
EUR
-1.73%
-0.24%
-0.09%
1.12%
0.88%
1.42%
1.11%
GBP
-1.49%
0.24%
0.21%
1.43%
1.16%
1.68%
1.39%
JPY
-1.66%
0.09%
-0.21%
1.17%
0.99%
1.51%
1.10%
CAD
-2.90%
-1.12%
-1.43%
-1.17%
-0.17%
0.33%
-0.04%
AUD
-2.62%
-0.88%
-1.16%
-0.99%
0.17%
0.53%
0.22%
NZD
-3.16%
-1.42%
-1.68%
-1.51%
-0.33%
-0.53%
-0.31%
CHF
-2.85%
-1.11%
-1.39%
-1.10%
0.04%
-0.22%
0.31%
The heat map shows percentage changes of major currencies against each other. The base currency is picked from the left column, while the quote currency is picked from the top row. For example, if you pick the Japanese Yen from the left column and move along the horizontal line to the US Dollar, the percentage change displayed in the box will represent JPY (base)/USD (quote).
The dollar index traded around 101 on Tuesday, hovering near its highest level since May 2025 as investors assessed signs of progress in US-Iran peace talks while continuing to gauge the outlook for Federal Reserve interest rate hikes this year. In a key development, Washington granted Tehran a 60-day license to sell oil on international markets, boosting expectations of a faster recovery in global supply. Meanwhile, markets remain positioned for Fed rate hikes following the central bank’s hawkish stance last week and upward revisions to its inflation projections. Both Deutsche Bank and BofA Global Research have updated their forecasts to include a rate increase in September. Investors are now focused on this week’s PCE report, which contains the Fed’s preferred inflation measure and could offer fresh clues on underlying price pressures.
ING’s Francesco Pesole sees a decent risk that EUR/USD will need to test 1.140 as lingering post-Fed Dollar momentum plays out before any renewed upward pattern. He argues that positive US-Iran headlines and improved Eurozone terms of trade should limit downside, while upcoming confidence data and Purchasing Managers’ Index (PMI) are not expected to be major drivers for EUR/USD.
Euro faces 1.140 test risk
“In line with our USD view above, we see a decent risk that EUR/USD will have to test 1.140 on the back of a long tail of post-Fed USD momentum before re-entering any upward pattern.”
“At the same time, positive headlines from the US-Iran negotiations suggest the depth of the next leg lower should be more limited; the commodity terms of trade for the eurozone have recovered more than half of the initial war-related drop.”
“On the data side, we’ll see eurozone confidence data and PMIs today and tomorrow. Still, the surveys may not yet reflect the interim peace deal and could still signal a less optimistic mood.”
“We don’t expect those to be a key driver of EUR/USD, which remains very heavily dominated by the USD leg
GBP/USD edges up above 1.3200 as Prime Minister Keir Starmer announces his resignation.
The decision was widely expected with his leadership in question, following a severe defeat in local elections in May.
Andy Burnham, the Mayor of Manchester, emerges as the best-positioned candidate to replace Starmer.
The British Pound (GBP) nudged up above 1.3200 against the US Dollar (USD) on Monday and maintains a mild positive tone, despite news that Sir Keir Starmer resigned as Prime Minister of the United Kingdom and Leader of the Labour Party.
Starmer appeared outside 10 Downing Street earlier on Monday to announce his resignation, adding that he will remain in charge until the party decides on a new leader and pledging support to whoever is the next PM.
The decision was widely expected by the market, as his position as prime minister was seriously called into question after a severe defeat in the local elections in England, Scotland and Wales that delivered a sound victory to Nigel Farage’s Reform UK populist party.
Starmer’s weakness increased last week as the Manchester Mayor, Andy Burnham, the best-positioned Labour leader to replace him, won a seat in parliament, the requirement to become the next prime minister. Later on the day, Burnham is expected to be at Westminster today to be sworn in as MP for Makerfield.
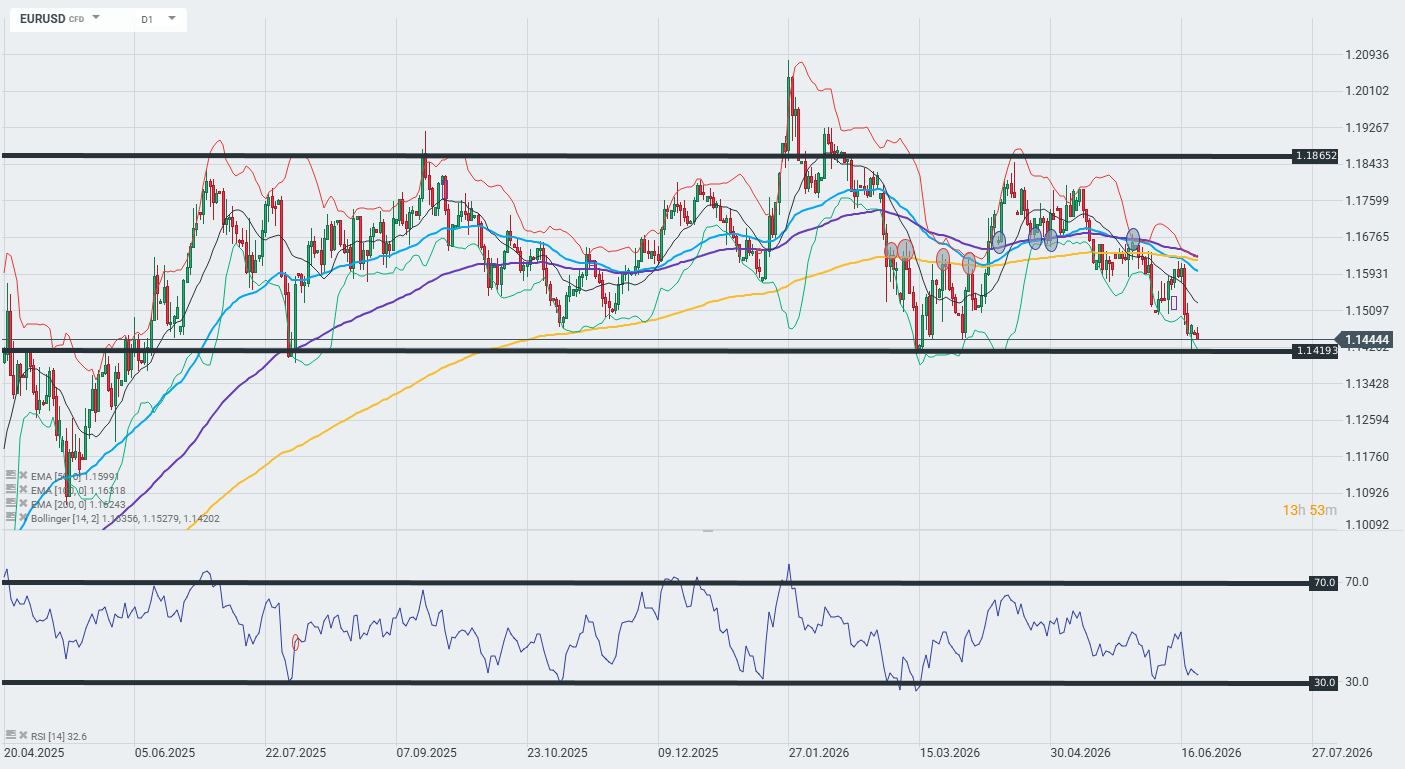
EUR/USD: The dollar takes centre stage — geopolitics, the Fed and the ECB are driving the pair EUR/USD has come under strong selling pressure, testing key support around 1.1440–1.1420 — a level clearly visible on the chart as a broad, horizontal zone of demand, which has repeatedly halted sell-offs over recent months.
Geopolitics: the US–Iran relationship and the Strait of Hormuz
Today, 22 June, technical talks are taking place in Switzerland between the US, Iran, Pakistan and Qatar, and both sides have agreed on a ‘roadmap’ to finalise the agreement within 60 days. However, tensions remain due to the fact that Iran has once again closed the Strait of Hormuz just before the talks began, and Trump is not backing down from his threats to resume attacks — this is fuelling volatility in the energy markets and limiting the euro’s appreciation. Geopolitical de-escalation is, in theory, a tailwind for the euro (capital outflows from safe-haven assets such as the USD), but until the negotiations are concluded, it will be difficult to weaken the dollar on a sustained basis.
Fed: Are we expecting rate hikes?
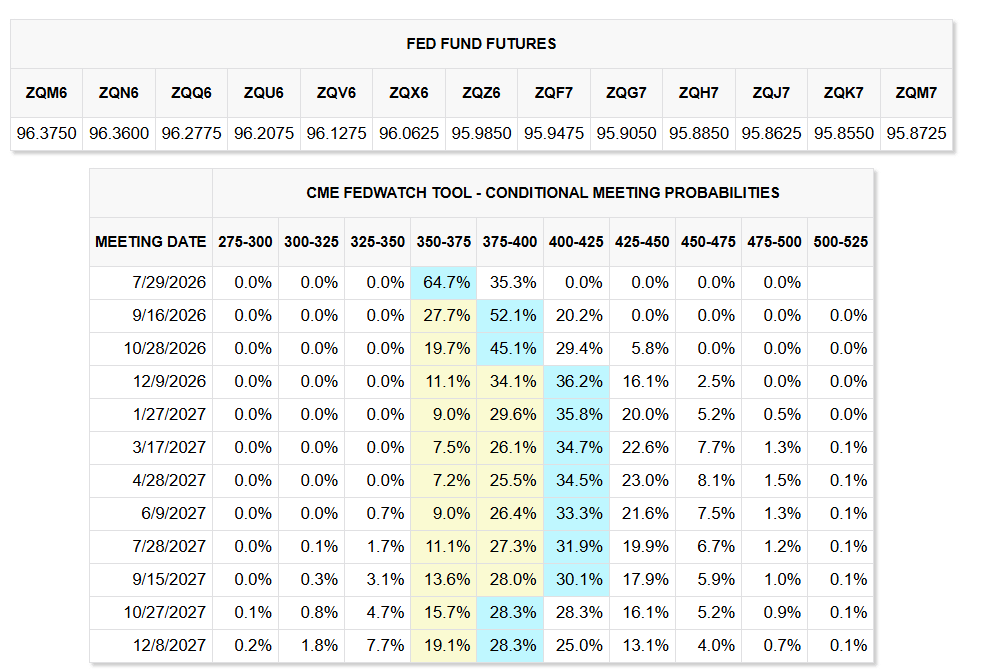
The Fed Fund Futures table and the CME FedWatch Tool clearly show how expectations have evolved. For the upcoming meeting on 29 July 2026 the market is pricing in a 64.7% probability that rates will remain in the 350–375 bps range, whilst the chances of a rise to 375–400 bps stand at 35.3%. At its meeting on 16–17 June 2026 — the first chaired by the new Fed chair, Kevin Warsch — the FOMC unanimously kept rates at 3.50–3.75% , leaving them unchanged for the fourth consecutive time. However, this is not the main news. The key message comes from the new dot-plot projections: 9 out of 18 Fed officials now expect at least one rate hike in 2026, whilst 6 of them anticipate two or more hikes — this is a dramatic shift from March, when none of the committee members had forecast any rises.
The media projection for the interest rate at the end of 2026 now stands at 3.8% — 0.16 percentage points above the current level — which the market interprets as a clear shift towards tightening. Inflationary pressure, fuelled by a surge in oil prices resulting from the US–Iran conflict, has forced the Fed to revise its stance: almost half of the FOMC does not believe that simply maintaining interest rates will be sufficient to bring inflation down to the 2% target.
Derivatives markets are already pricing in ~60% chance of at least one rate rise before the end of the year , with the highest probability at the September or October meeting. This is fundamentally a bullish environment for the dollar — and directly explains the pressure on EUR/USD visible on the chart. The prospect of higher US interest rates, coupled with divergence from the ECB (deposit rate of 2.25%), is widening the yield spread in favour of the USD. The Fed Funds Futures table confirms this picture: from the December 2026 meeting onwards, the probability of rates in the 400–425 bps range is increasing, which means that the market is gradually pricing in a cycle of rate rises — not cuts.
ECB: The rate rise is a backdrop, not a catalyst
On 11 June, the ECB raised the deposit rate by 25 basis points to 2.25% — in line with expectations. The bank also raised its inflation forecast for 2026 to 3.0% from the previous 2.6%. However, this move had already been fully priced in by the market and does not provide direct support for the EUR — as can be seen in the chart, where the pair continues to weaken despite the rate rise. The interest rate differential between the Fed (4.25–4.50 per cent) and the ECB (2.25 per cent) continues to strongly favour the dollar, and the ECB’s rate rise alone does not alter this arithmetic to a sufficient extent.
What can be seen on the EUR/USD D1 chart
The EUR/USD daily chart shows the pair testing critical support at ~1.1420–1.1444 — a level that has been defended several times by the bulls since spring 2025. The RSI(14) at 32.6 is close to the oversold zone (the 30 threshold), signalling a potential technical rebound. However, the moving average configuration is bearish: the price has broken below the EMA50 (1.1599) and the EMA100 (1.1682) and is approaching the EMA200 (1.1824) from below — all three moving averages above the price are forming dynamic resistance. The Bollinger Bands indicate the lower band at 1.1420, which coincides with the support zone.
Outlook for the coming days:
If the 1.1420 support level holds and US–Iran talks confirm progress, the RSI may rebound and the pair could move back towards 1.15–1.16. A break below 1.1420 would pave the way for a test of 1.13+. As long as the Fed remains ‘hawkish-cautious’ and negotiations on the Middle East front remain volatile, any rebound in the EUR is likely to be short-lived.
GBP/USD trades lower to near 1.3220 on renewed UK political uncertainty.
US President Trump says UK PM Starmer could resign on failing to fix immigration and energy issues.
The Fed is expected to deliver at least two interest rate hikes this year.
The GBP/USD pair recovers some of its early losses, but is still 0.1% down to near 1.3220 during the early European trading session on Monday. The pair remains under pressure amid renewed United Kingdom (UK) political uncertainty after comments from United States (US) President Donald Trump that Prime Minister (PM) Keir Starmer could resign on failing to fix immigration and energy issues.
“Keir Starmer will resign as Prime Minister of The United Kingdom. He failed badly on two very important subjects- IMMIGRATION AND ENERGY (OPEN NORTH SEA OIL!). I wish him well!,” US President Trump wrote in a post on Truth Social.
Meanwhile, calls from Labour lawmakers against PM Starmer continuing UK leadership have also accelerated, following Andy Burnham’s strong win in the Makerfield constituency in north-west England.
A Reuters report has shown that UK PM Starmer could decide as early as Monday whether to remain in office and fight a leadership contest or begin the process of stepping down.
Also, an upbeat US Dollar (US) due to increased expectations that the Federal Reserve (Fed) could deliver two interest rate hikes this year is also keeping Cable under pressure. According to the CME FedWatch tool, the odds of the Fed delivering at least two interest rate hikes this year is 58.5%, a sharp increase from 17.1% seen a week ago.
Hawkish Fed bets have strengthened following the first monetary policy announcement on Wednesday under new Chairman Kevin Warsh.
GBP/USD technical analysis
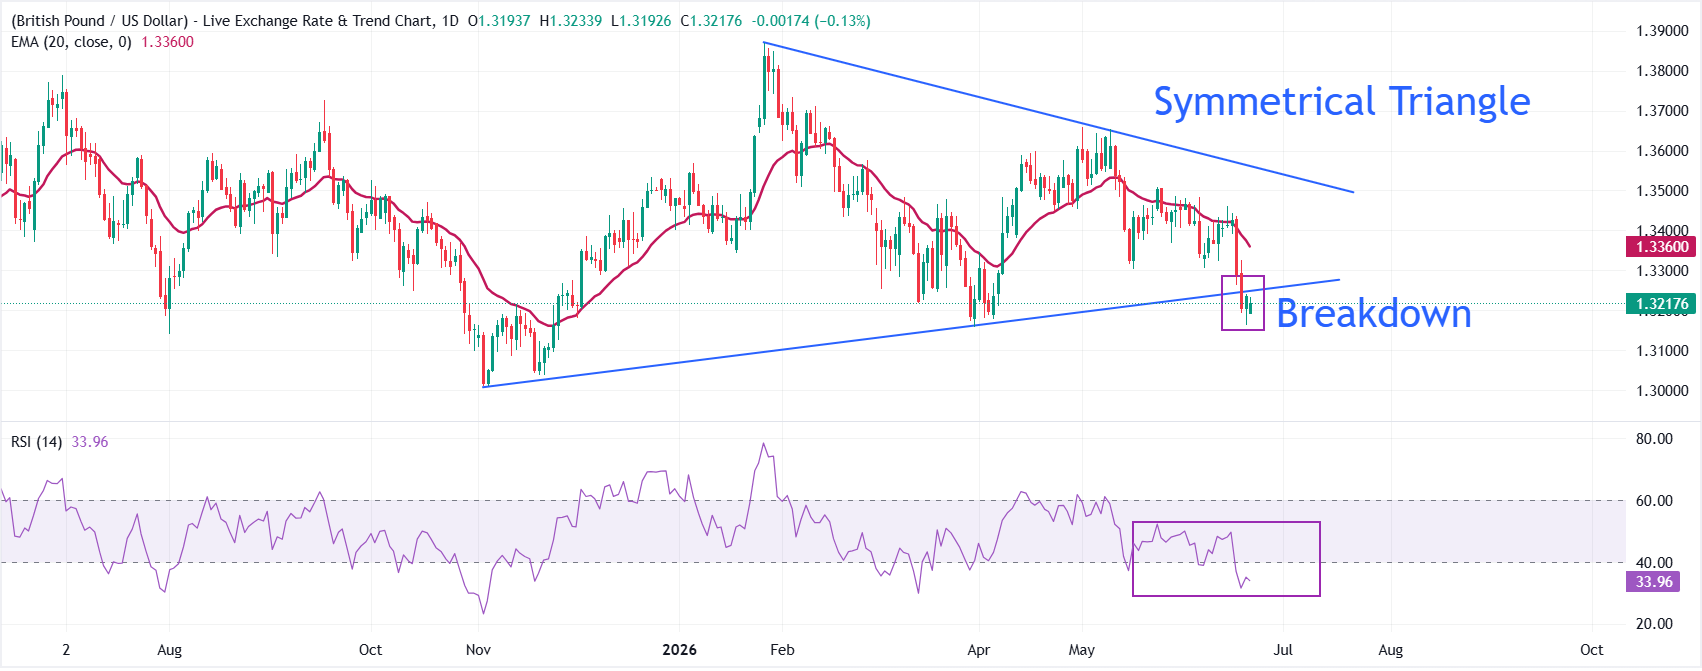
Bias: GBP/USD trades lower at around 1.3218 at press time. The pair maintains a bearish near-term tone as it holds below the 20-period Exponential Moving Average (EMA) at 1.3360. Also, a breakdown of the Symmetrical Triangle strengthens the bearish bias. The Relative Strength Index (RSI) near 34 hovers just above oversold territory, hinting at a dominant downside momentum.
Resistance: On the topside, initial resistance is seen at the broken rising trend-line region near 1.3250, followed by the 20-period EMA at 1.3360.
Support: On the downside, the pair could slide towards the November 25 low at 1.3096 if it resumes its decline below the June 19 low at 1.3163. The pair could extend its decline towards the psychological support at 1.3000 once it falls below 1.3096.
United Overseas Bank’s (UOB) Quek Ser Leang and Lee Sue Ann highlight that EUR/USD remains under pressure after briefly dipping to 1.1416 before rebounding. They see scope for short-term consolidation between 1.1435 and 1.1495 as oversold conditions unwind, but maintain a bearish bias toward 1.1410, and warn that a break of the 1.1390/1.1410 support zone could open the way to 1.1210.
Oversold Euro pauses within range
“24-HOUR VIEW: When EUR was at 1.1460 in the early Asian session last Friday, we indicated that “conditions are deeply oversold, but there is scope for EUR to drop below the support at 1.1445.” However, we held the view that “the major support at 1.1410 is unlikely to come under threat.” EUR subsequently dropped to a low of 1.1416, rebounding to close at 1.1468 (+0.10%). Downward momentum is slowing, and conditions are unwinding from oversold levels. In other words, instead of continuing to decline, EUR is more likely to consolidate today, probably between 1.1435 and 1.1495”
“1-3 WEEKS VIEW: Last Thursday (18 Jun, spot at 1.1505), we highlighted that while EUR “is expected to remain under pressure, but it may need some time to consolidate before making a move to 1.1445.” After EUR dropped to 1.1450, we highlighted on Friday (19 Jun, spot at 1.1460) that “a breach of 1.1445 will not be surprising, and the next technical target is 1.1410.” EUR subsequently declined to a low of 1.1416 before rebounding. While there is still scope for EUR to decline to 1.1410, oversold short-term conditions could lead to 1-2 days of consolidation first. Overall,
To provide the best experiences, we use technologies like cookies to store and/or access device information. Consenting to these technologies will allow us to process data such as browsing behavior or unique IDs on this site. Not consenting or withdrawing consent, may adversely affect certain features and functions.
Functional
Always active
The technical storage or access is strictly necessary for the legitimate purpose of enabling the use of a specific service explicitly requested by the subscriber or user, or for the sole purpose of carrying out the transmission of a communication over an electronic communications network.
Preferences
The technical storage or access is necessary for the legitimate purpose of storing preferences that are not requested by the subscriber or user.
Statistics
The technical storage or access that is used exclusively for statistical purposes.The technical storage or access that is used exclusively for anonymous statistical purposes. Without a subpoena, voluntary compliance on the part of your Internet Service Provider, or additional records from a third party, information stored or retrieved for this purpose alone cannot usually be used to identify you.
Marketing
The technical storage or access is required to create user profiles to send advertising, or to track the user on a website or across several websites for similar marketing purposes.