The offshore yuan edged higher to around 6.88 per dollar on Friday, trimming gains from the previous session as market sentiment improved on growing hopes for the reopening of the Strait of Hormuz. Iran and Oman are said to be developing a protocol to “monitor transit” through the strategic waterway, a move aimed at easing regional tensions.
Elsewhere, countries such as India and the Philippines are actively negotiating with Tehran to ensure the safe passage of vessels, while also forming small diplomatic circles and exploring barter-style agreements. Meanwhile, China and Pakistan are advocating for their own multi-point diplomatic plan, as Iran maintains tight control over the shipping lane. Domestically, RatingDog data showed China’s composite PMI fell to 51.5 in March from 55.4 in February 2026, as both manufacturing (50.8 vs 52.1) and services (52.1 vs 56.7) sectors slowed. Over the week, the yuan is poised for a weekly gain, breaking a four-week losing streak.
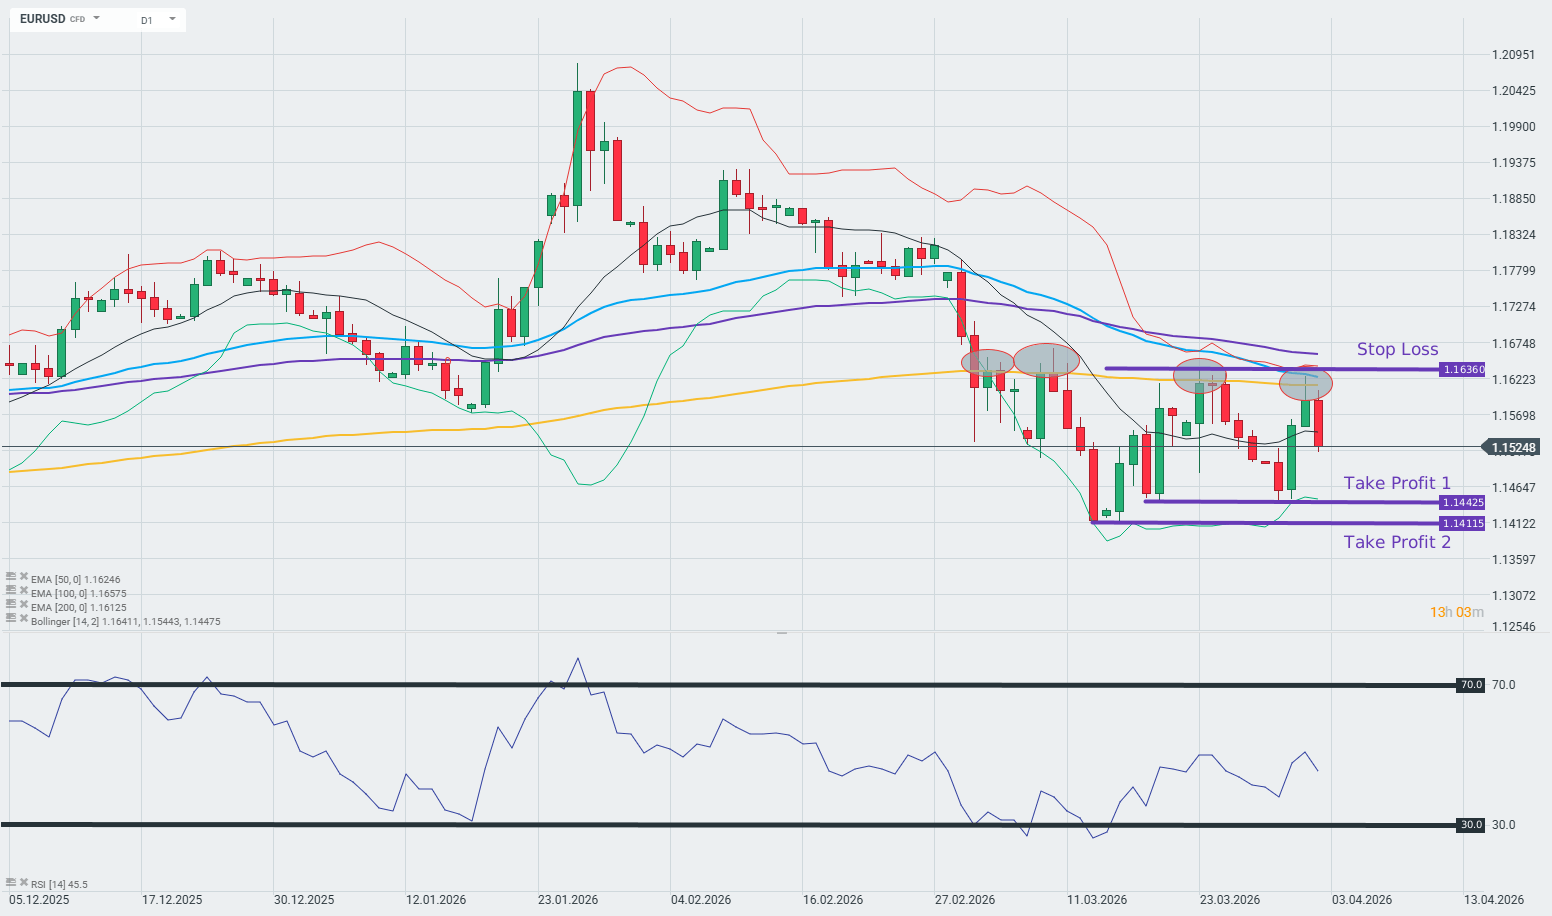
The EUR/USD exchange rate failed to close above the 200-day EMA on yesterday’s daily candle
The price remains below the 50-, 100-, and 200-day exponential moving averages (EMA)
Recommendation:
Trade: Short position on the EUR/USD pair at market price
Take Profit 1: 1.14425
Take Profit 2: 1.14115
Stop: 1.16360
Opinion:
From a technical perspective, the EURUSD pair remains in a structural downtrend, which is a key argument for maintaining short positions. The price consistently remains below the 200-, 100-, and 50-day exponential moving averages (EMA), which form dynamic resistance and confirm the dominance of supply over demand in the medium term. Prices are moving within a bearish flag pattern (a trend continuation pattern), and current attempts at a rebound are being stifled by successive resistance levels marked by the downward-sloping EMAs, which technically indicates further potential for the euro-dollar exchange rate to depreciate.
An additional and significant catalyst for the dollar’s strengthening is the escalation of the armed conflict in the Middle East, directly driven by the Trump administration’s actions. In his Wednesday address to the nation, the president announced that within the next 2–3 weeks, the United States would strike Iran “extremely hard,” promising simultaneous attacks on all Iranian power plants, which—as Trump stated—“will set the country back to the Stone Age.” The escalation of the military operation codenamed “Operation Epic Fury” is generating a classic flight-to-safety effect—primarily toward the dollar—which, combined with the euro-dollar’s technical weakness, creates a consistent environment conducive to the continuation of the downward trend in the EURUSD pair
Methodology and assumptions: This recommendation is based on a technical analysis of the EURUSD chart. Classical technical analysis was used to assess the situation and analyze the trend. The target level—take profit 1—was set at the level of previous price reactions, using price action methodology. Take profit 2, on the other hand, is based on the location of last month’s local low. The protective stop-loss order was set above the most recent local high using price action methodology.
The Overbalance analysis aims to identify three financial instruments, analyzed primarily on the daily/four-hour (D1/H4) timeframe. The analysis uses only the Overbalance methodology, which helps determine where a trend may continue or where it may reverse. Today’s analysis covers three instruments, evaluated solely in terms of 1:1 correction structures.
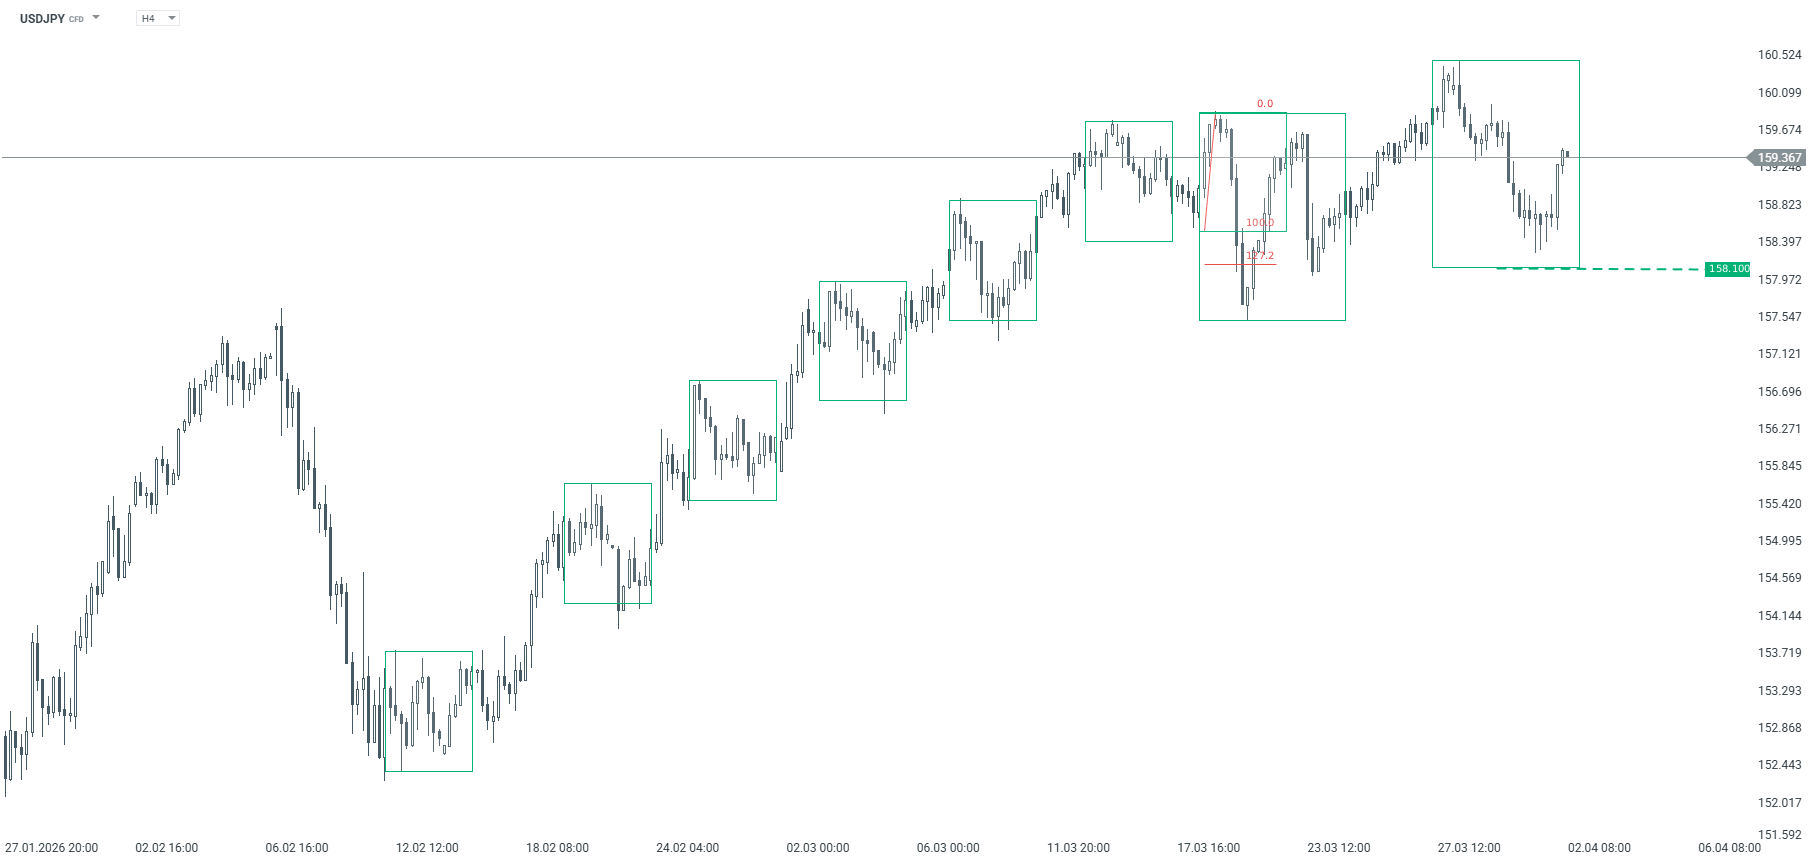
USDJPY Since February 12, the USDJPY has been trading in a strong uptrend. Initially, the movement was controlled by a 1:1 corrective pattern with a range of approximately 140 pips; however, in mid-March, a deeper correction occurred, after which the market established a new high. As a result, the current largest corrective pattern has a range of approximately 240 pips. At this point, the key support level is 158.10, derived from the lower boundary of this pattern. As long as this level holds, the uptrend remains in place. A break below it, however, could open the way for a larger correction or even a trend reversal.
USDJPY – H4 chart. Source: xStation
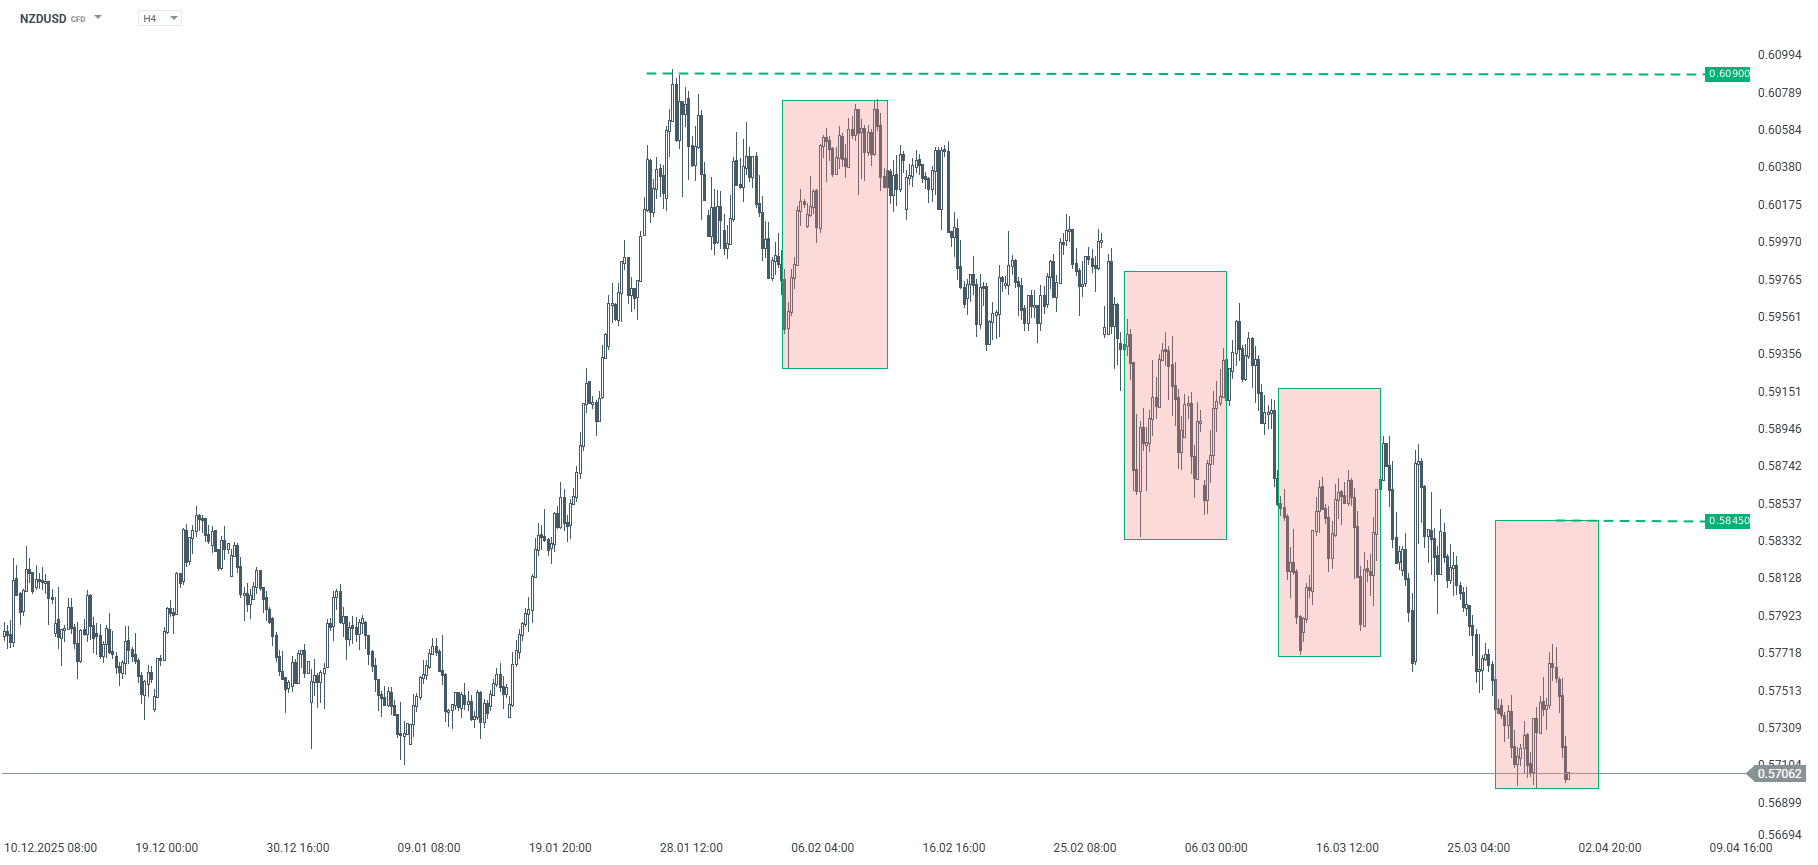
NZDUSD The NZDUSD pair has been trending downward since late January. We are currently seeing an upward corrective move. If the correction continues, the key resistance level remains at 0.5845, where the upper boundary of the 1:1 correction pattern is located. According to the Overbalance methodology, the downtrend remains in effect until this level is negated.
NZDUSD – H4 chart. Source: xStation
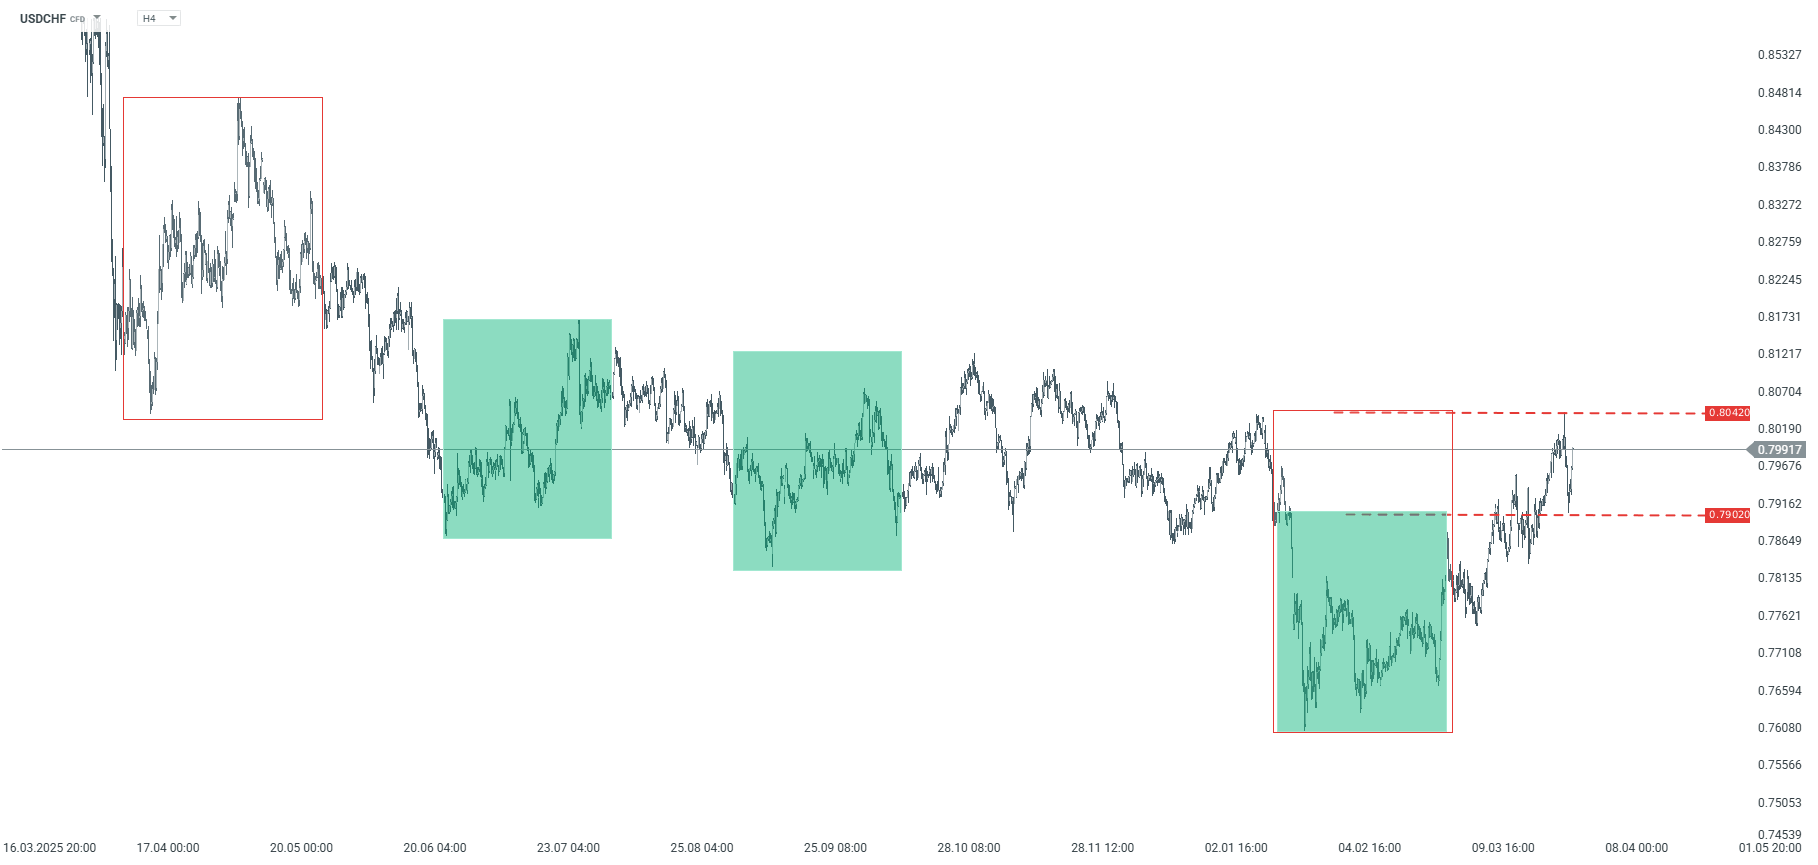
USDCHF Since early January, USDCHF has been in a downtrend. However, an upward correction has been developing since late January, and its range has already exceeded smaller geometric patterns, including the 0.7902 level. Nevertheless, the price has failed to break through the key resistance at 0.8042, where the upper boundary of the largest corrective pattern is located. According to the Overbalance methodology, the downtrend remains in effect until this level is broken. The decline could accelerate after falling below the 0.7902 level, which is the lower boundary of the smaller geometric pattern. Conversely, a break above 0.8042 could lead to a shift to an uptrend.
USDCHF – H4 timeframe. Source: xStation
The material on this page does not constitute financial advice and does not take into account your level of understanding, investment objectives, financial situation or any other specific needs. All information provided, including opinions, market research, mathematical results and technical analyzes published on the Website or transmitted To you by other means, it is provided for information purposes only and should in no way be construed as an offer or solicitation for a transaction in any financial instrument, nor should the information provided be construed as advice of a legal or financial nature on which any investment decisions you make should be based exclusively To your level of understanding, investment objectives, financial situation, or other specific needs, any decision to act on the information published on the Website or sent to you by other means is entirely at your own risk if you In doubt or unsure about your understanding of a particular product, instrument, service or transaction, you should seek professional or legal advice before trading. Investing in CFDs carries a high level of risk, as they are leveraged products and have small movements Often the market can result in much larger movements in the value of your investment, and this can work against you or in your favor. Please ensure you fully understand the risks involved, taking into account investments objectives and level of experience, before trading and, if necessary, seek independent advice.
The British pound slipped toward $1.32, nearing its lowest point since late November, as investor caution resurfaced after President Donald Trump’s prime-time address provided no clear end in sight for the Middle East conflict. Trump affirmed that the US operation was nearly complete but vowed escalated actions, including possible strikes on electrical plants, over the next two to three weeks. The lack of new justifications for the war further weighed on market sentiment.
Ongoing uncertainty and inflationary pressures have prompted a reassessment of Bank of England policy expectations. Investors now anticipate two interest rate hikes in 2026, reversing four days of reduced bets that had left expectations below two hikes by yesterday’s close. Even so, this remains below last week’s peak, when markets briefly priced in as many as four increases. The shift comes despite Bank of England Governor Andrew Bailey’s recent warning that markets were overestimating the likelihood of hikes.
The euro retreated toward $1.15 as investor caution returned following President Donald Trump’s prime-time address, which offered no clear timeline for resolving the Middle East conflict. While Trump stated that the US operation was nearing completion, he also vowed more aggressive measures, including possible strikes on electrical plants, over the next two to three weeks.
The absence of new justifications for the war further dampened market confidence. Amid persistent uncertainty and growing inflation fears, markets are revisiting expectations for the European Central Bank’s policy direction. Investors now foresee three interest rate hikes in 2026, an increase from the two anticipated just yesterday. Before the conflict, expectations had leaned toward no hikes at all, with some even speculating about potential monetary easing.
USD/CHF climbs to near 0.7985 in Thursday’s early European session.
Trump said the US’s war objectives are nearing completion and threatening to hit Iran hard over the next two to three weeks.
The Swiss March CPI inflation data will be released on Thursday.
The USD/CHF pair jumps to around 0.7985 during the early European session on Thursday. The Greenback strengthens against the Swiss Franc (CHF) following an address to the nation by US President Donald Trump. Traders will keep an eye on the Swiss March Consumer Price Index (CPI) data, which is due later on Thursday.
Trump said during a primetime televised speech from the White House on Thursday that his core “objectives are nearing completion” in Iran and expected another two or three weeks of involvement. Nonetheless, he signaled that the US is prepared to intensify its military response in the remaining time period and threatened to bring Iran “back to the stone ages.” Persistent tensions between the US and Iran could underpin the US Dollar (USD) in the near term.
The Swiss Federal Statistical Office will publish its inflation data on Thursday. The monthly and annual CPI are expected to show a rise of 0.5% for March. The persistent low inflation has led the Swiss National Bank (SNB) to maintain a cautious stance.
Traders will shift their attention to the US jobs data on Friday. Markets expect the Nonfarm Payrolls (NFP) to show 60,000 in March, while the Unemployment Rate is projected to hold steady at 4.4% during the same period. If the reports show weaker-than-expected outcomes, this could undermine the USD against the CHF.
The offshore yuan weakened to around 6.88 per dollar, ending a three-day winning streak as the greenback gained strength amid mounting uncertainties over a possible easing of the Middle East conflict. The US dollar rose as investors pared back expectations for Federal Reserve rate cuts, amid concerns that a surge in oil prices driven by the conflict could stoke rising inflation.
During his speech, Trump said the war in Iran was “very close” to completion and likely to meet its objectives in the coming weeks, while warning that military operations could intensify. Meanwhile, the PBoC drained CNY 890 billion through short-term operations and absorbed another CNY 250 billion via longer-term tools, reversing months of liquidity support after the economy’s deepest slowdown since reopening from Covid lockdowns in 2022. With growth rebounding and oil prices elevated by the Iran war, the central bank appears focused on curbing inflation while gradually steering China out of record deflation.
The Indian rupee edged down to around 93.2 per dollar, extending gains for another session amid persistent capital outflows and heightened geopolitical tensions. The currency has been under pressure from spillovers of the Iran war, prompting the Reserve Bank of India to step up measures against arbitrage and forward contract manipulation.
After an earlier crackdown on banks failed to ease volatility, corporates were barred from rebooking cancelled foreign exchange contracts, and derivative trades with related parties were restricted. Analysts noted that while these measures aim to curb speculative activity, the rupee remains vulnerable as oil prices stay elevated and capital inflows remain limited. Adding to the downward pressure, President Donald Trump’s 20-minute prime-time address said the US is “very close” to completing its military objectives in Iran, while warning of potential escalation.
To provide the best experiences, we use technologies like cookies to store and/or access device information. Consenting to these technologies will allow us to process data such as browsing behavior or unique IDs on this site. Not consenting or withdrawing consent, may adversely affect certain features and functions.
Functional
Always active
The technical storage or access is strictly necessary for the legitimate purpose of enabling the use of a specific service explicitly requested by the subscriber or user, or for the sole purpose of carrying out the transmission of a communication over an electronic communications network.
Preferences
The technical storage or access is necessary for the legitimate purpose of storing preferences that are not requested by the subscriber or user.
Statistics
The technical storage or access that is used exclusively for statistical purposes.The technical storage or access that is used exclusively for anonymous statistical purposes. Without a subpoena, voluntary compliance on the part of your Internet Service Provider, or additional records from a third party, information stored or retrieved for this purpose alone cannot usually be used to identify you.
Marketing
The technical storage or access is required to create user profiles to send advertising, or to track the user on a website or across several websites for similar marketing purposes.