

The Indonesian rupiah hovered near IDR 18,050 per dollar on Friday, remaining under pressure as weak domestic fundamentals outweighed support from a softer greenback. The dollar index extended recent losses after reports that the U.S. and Iran would continue peace negotiations, easing safe-haven demand. Locally, sentiment remained fragile, with May retail sales posting the steepest annual drop in three years as higher non-subsidized fuel prices squeezed spending. Meanwhile, consumer confidence fell for a third straight month in June amid concerns over income, jobs, and future consumption. For the week, the currency was set for a third consecutive decline, down about 0.7% so far, reflecting fears that Indonesia could be downgraded to frontier-market status next year. Still, losses were partly cushioned by stabilizing oil prices, a modest rise in forex reserves, and government measures to bolster food supplies and prepare for El Niño, tempering worries over food inflation.

United States Dollar Index falls to three-week low amid signs of US-Iran war de-escalation
- The US Dollar Index falls for the third straight trading day, extending the decline to near the three-week low at 100.60.
- The US signals that it is still committed to the MoU with Iran, and technical talks are still on.
- Fed Chair Warsh unveils key members of five task forces.
The US Dollar (USD) extends its losing streak for the third trading day on Friday amid signs of de-escalation in the ongoing clash between the United States (US) and Iran.
In the Asian session, the US Dollar Index (DXY), which tracks the Greenback’s value against six major currencies, trades 0.3% lower to near 100.60, revisiting the three-week low.
US Dollar Price Today
The table below shows the percentage change of US Dollar (USD) against listed major currencies today. US Dollar was the weakest against the Japanese Yen.
| USD | EUR | GBP | JPY | CAD | AUD | NZD | CHF | |
|---|---|---|---|---|---|---|---|---|
| USD | -0.22% | -0.27% | -0.57% | -0.19% | -0.31% | -0.55% | -0.40% | |
| EUR | 0.22% | -0.05% | -0.35% | 0.05% | -0.12% | -0.34% | -0.18% | |
| GBP | 0.27% | 0.05% | -0.33% | 0.08% | -0.08% | -0.28% | -0.14% | |
| JPY | 0.57% | 0.35% | 0.33% | 0.40% | 0.27% | 0.01% | 0.17% | |
| CAD | 0.19% | -0.05% | -0.08% | -0.40% | -0.14% | -0.37% | -0.21% | |
| AUD | 0.31% | 0.12% | 0.08% | -0.27% | 0.14% | -0.24% | -0.11% | |
| NZD | 0.55% | 0.34% | 0.28% | -0.01% | 0.37% | 0.24% | 0.14% | |
| CHF | 0.40% | 0.18% | 0.14% | -0.17% | 0.21% | 0.11% | -0.14% |
The heat map shows percentage changes of major currencies against each other. The base currency is picked from the left column, while the quote currency is picked from the top row. For example, if you pick the US Dollar from the left column and move along the horizontal line to the Japanese Yen, the percentage change displayed in the box will represent USD (base)/JPY (quote).
Earlier in the day, reports from the Times of Israel stated that a US official signaled that Washington is still committed to the memorandum of understanding (MoU) with Iran and technical talks are still on despite US President Donald Trump declaring that the MoU is over and the exchange of attacks between the two.
On Wednesday, US President Trump also said that Iran called for making a deal, but “I just don’t know if they’re worthy of making a deal”, CNBC reported.
Signs of US-Iran war de-escalation diminish the safe-haven appeal of the US Dollar. However, higher oil prices due to renewed energy supply disruption fears have de-anchored inflation projections, which are likely to limit the US Dollar’s downside.
Technically, higher inflation expectations discourage Federal Reserve (Fed) officials from lowering interest rates.
On the monetary policy front, Fed Chair Kevin Warsh has unveiled members of five task forces, as promised in the June policy announcement, which will be focused on communications, the balance sheet policy, improving the quality and timeliness of economic data, productivity and jobs and developing inflation frameworks.

New Zealand Dollar extends hawkish RBNZ-inspired rally; hits three-week high vs weaker USD
- NZD/USD builds on the hawkish RBNZ-inspired gains for the third straight day on Friday.
- The USD drops to a fresh weekly trough and provides an additional boost to spot prices.
- Mixed US-Iran signals do little to impress the USD bulls or hinder the pair’s momentum.
The NZD/USD pair gains strong follow-through positive traction for the third straight day and rallies to an over three-week top during the Asian session on Friday. Spot prices currently trade around the 0.5775-0.5780 region, up nearly 0.40% for the day, and remain on track to register strong gains for the second week in a row amid a combination of supporting factors.
The New Zealand Dollar (NZD) continues to be underpinned by the Reserve Bank of New Zealand’s (RBNZ) hawkish outlook, which, along with a broadly weaker US Dollar (USD), acts as a tailwind for the NZD/USD pair. As was widely expected, the RBNZ raised the Official Cash Rate (OCR) by 25 basis points (bps) to 2.50% following the conclusion of the June monetary policy meeting on Wednesday. The central bank also indicated that some further reduction in monetary stimulus is likely to be required to curb inflationary pressures.
In contrast, the Minutes from the June 16–17 FOMC meeting revealed on Wednesday that policymakers were divided over the direction of interest rates. The minutes further stated that many participants indicated the appropriate level of the federal funds rate would be within or slightly below the current target range at the end of this year. The less hawkish outlook, in turn, drags the USD Index (DXY), which tracks the Greenback against a basket of currencies, to a fresh weekly low and contributes to the bid tone around the NZD/USD pair.
Meanwhile, the geopolitical risk premium resurfaced this week after the US military unleashed a new wave of strikes against Iran earlier this week in retaliation for Tehran’s attacks on commercial ships in the Strait of Hormuz. Iran responded by targeting American allies and bombing US military installations across Bahrain and Kuwait. The market anxiety, however, subsided after Trump on Thursday claimed that Iran had called to make a deal with the US, denting the USD’s safe-haven status and lending additional support to the NZD/USD pair.
Moving ahead, there isn’t any relevant market-moving economic data due for release from the US on Friday, leaving the USD at the mercy of comments from influential FOMC members. Apart from this, the market focus will be on further developments surrounding the Middle East crisis, which might continue to infuse volatility in global financial markets and drive the USD. Nevertheless, the fundamental backdrop backs the case for a further appreciating move for the NZD/USD pair, which remains on track to register gains for the second straight week.
New Zealand Dollar Price This week
The table below shows the percentage change of New Zealand Dollar (NZD) against listed major currencies this week. New Zealand Dollar was the strongest against the Japanese Yen.
| USD | EUR | GBP | JPY | CAD | AUD | NZD | CHF | |
|---|---|---|---|---|---|---|---|---|
| USD | -0.09% | -0.66% | 0.19% | -0.30% | -0.23% | -1.29% | 0.13% | |
| EUR | 0.09% | -0.60% | 0.24% | -0.23% | -0.10% | -1.23% | 0.18% | |
| GBP | 0.66% | 0.60% | 0.74% | 0.36% | 0.50% | -0.63% | 0.77% | |
| JPY | -0.19% | -0.24% | -0.74% | -0.49% | -0.26% | -1.42% | -0.05% | |
| CAD | 0.30% | 0.23% | -0.36% | 0.49% | 0.20% | -0.94% | 0.41% | |
| AUD | 0.23% | 0.10% | -0.50% | 0.26% | -0.20% | -1.13% | 0.27% | |
| NZD | 1.29% | 1.23% | 0.63% | 1.42% | 0.94% | 1.13% | 1.41% | |
| CHF | -0.13% | -0.18% | -0.77% | 0.05% | -0.41% | -0.27% | -1.41% |
The heat map shows percentage changes of major currencies against each other. The base currency is picked from the left column, while the quote currency is picked from the top row. For example, if you pick the New Zealand Dollar from the left column and move along the horizontal line to the US Dollar, the percentage change displayed in the box will represent NZD (base)/USD (quote).

British Pound gains traction above 1.3400 as markets bet on BoE rate hikes
- GBP/USD gains ground to near 1.3430 in Friday’s Asian session.
- Andy Burnham is set to become the next UK Prime Minister on July 20.
- Iranian officials have reported multiple explosions in the country’s south, including near the Bushehr nuclear facility.
The GBP/USD pair gathers strength to around 1.3430 during the Asian trading hours on Friday. The British Pound (GBP) edges higher against the US Dollar (USD) on the UK government leadership transition and growing expectations of further Bank of England (BoE) interest rate hikes.
Andy Burnham’s path to becoming the next UK prime minister looks certain after a vast majority of Labour MPs formally nominated him to be the next party leader. Bloomberg reported on Thursday that 322 of 403 Labour members of Parliament voted for Burnham at the end of the first day of the party’s leadership contest to replace Keir Starmer. Burnham is expected to formally become Prime Minister on July 20.
Traders increased bets on BoE interest rate hikes amid escalating tensions between the US and Iran. Markets are now fully pricing in a 25 basis points (bps) BoE rate hike by year-end, most likely in December, according to Reuters.
Renewed tensions in the Middle East could boost a safe-haven currency such as the Greenback and cap the upside for the major pair. US forces struck several more locations in coastal Iran on Thursday, according to Iranian state media, though the US did not confirm carrying out the attacks. Iranian officials and state media have reported multiple explosions in the country’s south, including near the Bushehr nuclear facility.

Euro nudges higher above 1.1400 as traders ramp up their bets on ECB hikes
- EUR/USD trades with mild gains near 1.1430 in Friday’s early Asian session.
- ECB saw inflation rising despite nearly three expected hikes, accounts showed.
- US official said Washington remains committed to a resolution with Iran.
The EUR/USD pair posts modest gains around 1.1430 during the early Asian session on Friday, bolstered by a softer US Dollar (USD). The European Central Bank (ECB) is grappling with elevated core inflation, forcing traders to price in more aggressive tightening despite mixed guidance from ECB officials.
Accounts of the meeting showed on Thursday that the ECB policymakers gathering last month were presented with projections showing inflation staying above target into next year despite nearly three ECB interest rate hikes. The ECB raised rates at the June policy meeting, and traders expect it to do so twice more over the next year to contain the fallout from the Iran war on energy prices.
Traders raise their bets on ECB rate hikes again in recent days on signs that an agreement between the US and Iran to end the war is in jeopardy. This, in turn, provide some support to the shared currency.
Markets will closely monitor the developments surrounding the US-Iran conflict. Any signs of rising tensions could boost a safe-haven currency and act as a headwind for the major pair. US official on Thursday signaled that it is still committed to the memorandum of understanding with Iran, even though US President Donald Trump’s declared earlier this week that the framework deal to end the Iran war was “over.”
Dollar Falls for Third Straight Session
The dollar index fell toward 100.5 on Friday, extending losses for a third straight session as reports that the US and Iran will continue peace negotiations despite a recent escalation in hostilities dampened safe-haven demand for the currency. Lower oil prices also helped ease inflation concerns and reduce expectations of aggressive policy tightening, although markets still largely anticipate at least one Federal Reserve interest rate hike this year. Meanwhile, New York Fed President John Williams said that, among the factors driving inflation in the US, he is most focused on demand fueled by artificial intelligence. Separately, Fed Chair Kevin Warsh unveiled the leadership of five task forces to review the US central bank’s approach to key areas of policymaking, signaling the potential for changes in how the Fed conducts monetary policy. The dollar weakened broadly on Friday, posting its largest declines against the Japanese yen and the New Zealand dollar.

Australian Dollar Set for a Muted Week
The Australian dollar rose to around $0.695 but was on track to finish the week largely unchanged as investors monitored developments surrounding the Strait of Hormuz following renewed tensions in the Middle East. The safe-haven US dollar strengthened, while oil prices climbed after the US and Iran carried out military strikes in the Gulf earlier this week. However, both countries are now set to resume peace talks despite the recent escalation. Meanwhile, the International Monetary Fund lowered its 2026 growth forecast for Australia to 1.9% from 2.0% and warned inflation would remain elevated at around 4% this year. The Reserve Bank of Australia will meet in August and is expected to keep its cash rate unchanged at 4.35%, though markets still price in a roughly 60% chance of one final rate hike later this year, depending on the movement of oil prices. Traders also await key employment and inflation data due later this month, which could offer fresh clues on the policy outlook.
Chart of The Day – EUR/USD Caught Between the Fed, ECB and Middle East Risks
Wednesday’s session on the EURUSD market is being shaped by a clash of three key forces: expectations regarding the future path of Federal Reserve policy, the increasingly firm stance of the European Central Bank, and the renewed risk premium linked to geopolitical developments in the Middle East. The market is currently at an unusual point, as investors are no longer focused solely on which central bank will maintain the more restrictive stance.
The key question now is how long the Fed will keep rates at current levels and whether the ECB will indeed be forced to deliver further rate hikes. Today’s release of the FOMC meeting minutes could provide important clues about the future direction of US monetary policy. At the same time, markets must also factor in geopolitical developments and rising oil prices, which could once again complicate the inflation outlook on both sides of the Atlantic.
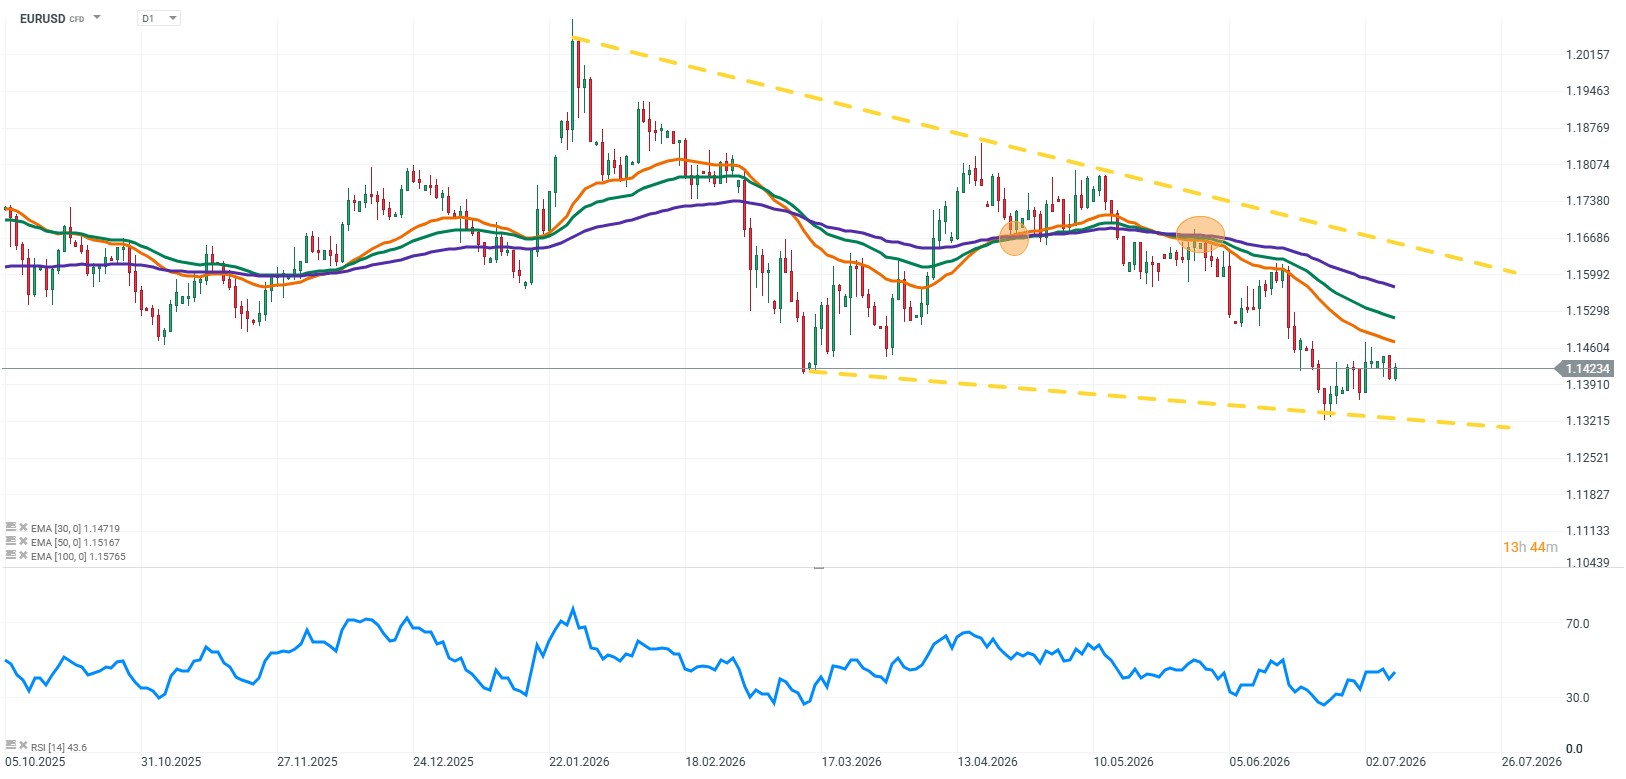
Source: xStation5
Three factors currently shaping EURUSD
1. FOMC Minutes: Markets are looking for clues on future Fed rate cuts
The main event of the day remains the release of the latest Federal Open Market Committee meeting minutes. This time, markets are not focusing solely on whether the Fed will remain restrictive. The more important question is when and under what conditions the Federal Reserve will be ready to shift the direction of monetary policy.
Markets have been increasingly assessing the possibility of future rate cuts in the United States, but the Fed must remain extremely cautious in its communication. Signalling readiness to ease policy too quickly could be interpreted as declaring victory over inflation prematurely and could undermine the central bank’s credibility. The fact that markets are analysing the first signals of Fed communication under Kevin Warsh’s leadership adds further importance to today’s release. The new Fed Chair faces a difficult balancing act: acknowledging market expectations for lower interest rates while avoiding any suggestion that the fight against inflation has already been won. Today’s minutes may provide insight into how FOMC members assess:
- the persistence of inflationary pressures,
- the resilience of the US economy,
- the timing of a potential rate-cut cycle.
If the document shows greater caution towards rate cuts, the dollar could receive additional support. However, if markets interpret the minutes as signalling greater willingness to ease policy, the US currency could come under renewed pressure.
2. ECB remains hawkish and continues to support the euro
The situation across the Atlantic currently looks different. Following its 25 basis point rate hike in June, the European Central Bank remains focused on risks related to persistent inflationary pressures. Markets are increasingly pricing in a scenario where the ECB could deliver another rate increase later this year. This marks a significant shift compared with the previous period, when the main concern for the euro was slowing economic growth and the possibility of monetary easing. Currently, markets must consider that persistent inflation, particularly in the services sector, combined with the potential for higher energy prices, could force the ECB to maintain a restrictive policy stance for longer. For EURUSD, this provides an important source of support. Even if the dollar remains strong due to the relative strength of the US economy and its safe-haven status, the euro continues to benefit from the prospect of higher interest rates in the euro area.
3. Rising US-Iran tensions and the renewed importance of oil markets
One of the most important new drivers for global markets remains the situation in the Middle East. Rising tensions between the United States and Iran, along with concerns over restrictions on Iranian oil exports, have increased the risk of supply disruptions in energy markets. The market response has been a rise in Brent and WTI crude prices, with investors once again considering the possibility that inflationary pressures could remain elevated for longer. The impact of this factor on EURUSD is not straightforward. On one hand, geopolitical uncertainty traditionally supports the US dollar as a safe-haven asset. During periods of increased risk aversion, investors often turn towards the American currency. On the other hand, higher energy prices increase inflationary pressure and complicate central bank decisions. The euro area economy remains particularly vulnerable to rising import costs due to its dependence on energy supplies. If oil prices move significantly higher again, markets may begin pricing in the risk of both the Fed and the ECB maintaining tighter monetary policy for longer.
EURUSD: Markets await the next move in the Fed-ECB policy divergence
The current situation in the major currency pair reflects the clash of three different narratives:
- Fed – markets are trying to determine the timing of potential interest rate cuts,
- ECB – investors are pricing in the possibility of further monetary tightening,
- Middle East tensions and oil prices – a factor increasing inflation uncertainty and market volatility.
In this environment, EURUSD remains highly vulnerable to sharp moves, as every new development can quickly change expectations regarding the policy gap between the two central banks. US bond yields will remain a key transmission channel. Rising yields could support the dollar by increasing the market pricing of higher financing costs, while falling yields could increase pressure on the US currency.
Key takeaways
- Today’s FOMC minutes could become the most important event for the dollar market.
- The Fed is now at a stage where investors are analysing not the possibility of further rate hikes, but the timing of potential rate cuts.
- Kevin Warsh must balance market expectations for easier policy with the need to preserve credibility in the fight against inflation.
- The ECB remains an important source of support for the euro due to expectations of another rate hike this year.
- Escalating tensions in the Middle East and rising oil prices could once again increase inflationary pressures.
EURUSD therefore remains at a point where the next major move may be determined by one key question: will Fed policy
