- NZD/USD pulls back to 0.5965 after rejection at the 0.6000 area.
- Fresh US-Iran hostilities are casting doubt about a fragile ceasefire.
- Upbeat manufacturing data from China provided some support to the NZD.
The New Zealand Dollar (NZD) holds marginal losses against the US Dollar (USD) on Monday, retreating to session lows of 0.5965 from highs a few pips below 0.6000. Manufacturing data from China has been supportive, although the skirmishes between the US and Iran are feeding a certain degree of cautiousness at the week’s opening.
The US military reported a new wave of airstrikes on Iran’s military sites, and Tehran said that they targeted a US base that was used to launch attacks on the country. US President Donald Trump keeps pondering whether to sign a ceasefire extension or not, and meanwhile, the Strait of Hormuz remains closed, keeping Oil near $100 and straining New Zealand’s Oil-importing economy.
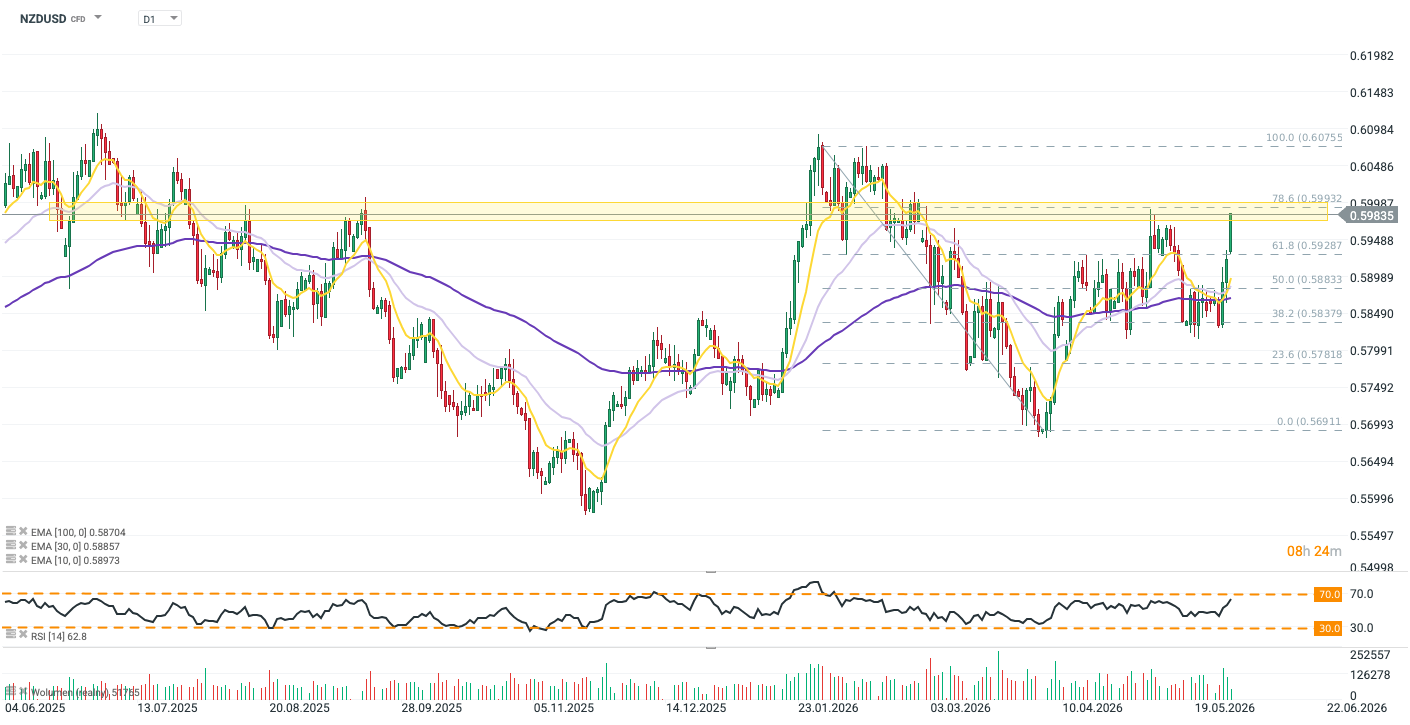
Technical Analysis: On a bearish correction, amid a broader bullish trend
NZD/USD trades at 0.5971, with price action suggesting that the pair might be on the fourth wave of a 5-wave (Elliott Wave) bullish cycle. The Relative Strength Index (RSI) is hovering around 68, after pulling back from heavily overbought levels, while the Moving Average Convergence Divergence (MACD) histogram remains positive, all in all suggesting that pullbacks are likely to find buyers.
Immediate resistance is located at the 0.5995 session high, ahead of the February 26 high, near 0.6015. Further up, the area between the 127.2% Fibonacci extension of last week’s rally, at 0.6036, and the mid-February highs around 0.6050 looks like a plausible target for a potential fifth wave.
A break below 0.5965, on the contrary, would expose the May 27 high, near 0.5915. Below here, the May 28 low, near 0.5865, would come next
New Zealand Dollar Price Today
The table below shows the percentage change of New Zealand Dollar (NZD) against listed major currencies today. New Zealand Dollar was the strongest against the Swiss Franc.
| USD | EUR | GBP | JPY | CAD | AUD | NZD | CHF | |
|---|---|---|---|---|---|---|---|---|
| USD | 0.05% | -0.08% | 0.14% | 0.04% | 0.01% | 0.30% | 0.23% | |
| EUR | -0.05% | -0.11% | 0.07% | -0.01% | 0.03% | 0.27% | 0.17% | |
| GBP | 0.08% | 0.11% | 0.19% | 0.10% | 0.07% | 0.35% | 0.27% | |
| JPY | -0.14% | -0.07% | -0.19% | -0.08% | -0.10% | 0.19% | 0.09% | |
| CAD | -0.04% | 0.00% | -0.10% | 0.08% | -0.03% | 0.26% | 0.18% | |
| AUD | -0.01% | -0.03% | -0.07% | 0.10% | 0.03% | 0.23% | 0.19% | |
| NZD | -0.30% | -0.27% | -0.35% | -0.19% | -0.26% | -0.23% | -0.08% | |
| CHF | -0.23% | -0.17% | -0.27% | -0.09% | -0.18% | -0.19% | 0.08% |
The heat map shows percentage changes of major currencies against each other. The base currency is picked from the left column, while the quote currency is picked from the top row. For example, if you pick the New Zealand Dollar from the left column and move along the horizontal line to the US Dollar, the percentage change displayed in the box will represent NZD (base)/USD (quote).