- USD/CAD stalls the previous day’s sharp retracement slide from its highest level since April 13.
- Weaker Oil prices undermine the Loonie and support spot prices amid a modest USD uptick.
- The technical setup favors bulls, warranting some caution before positioning for further losses.
The USD/CAD pair attracts some dip-buyers during the Asian session on Friday, stalling the previous day’s sharp retracement slide from the 1.3870 region, or the highest level since April 13. Spot prices, however, lack follow-through and remain below the 1.3800 mark, warranting caution before positioning for the resumption of the monthly uptrend amid mixed signals over a potential US-Iran peace deal.
Axios, citing two US officials, reported that the US and Iran have reached a draft agreement to extend the ongoing ceasefire for 60 days. The optimism, in turn, keeps Crude Oil prices depressed close to an over a one-month low touched on Thursday, which is seen undermining the commodity-linked Loonie and acting as a tailwind for the USD/CAD pair. Meanwhile, the US and Iran remain at odds over key issues, including Tehran’s nuclear program and the Strait of Hormuz. This keeps the enthusiasm under check, which, along with bets that the US Federal Reserve (Fed) will hike rates by the end of this year, helps revive the US Dollar (USD) demand and further supports spot prices.
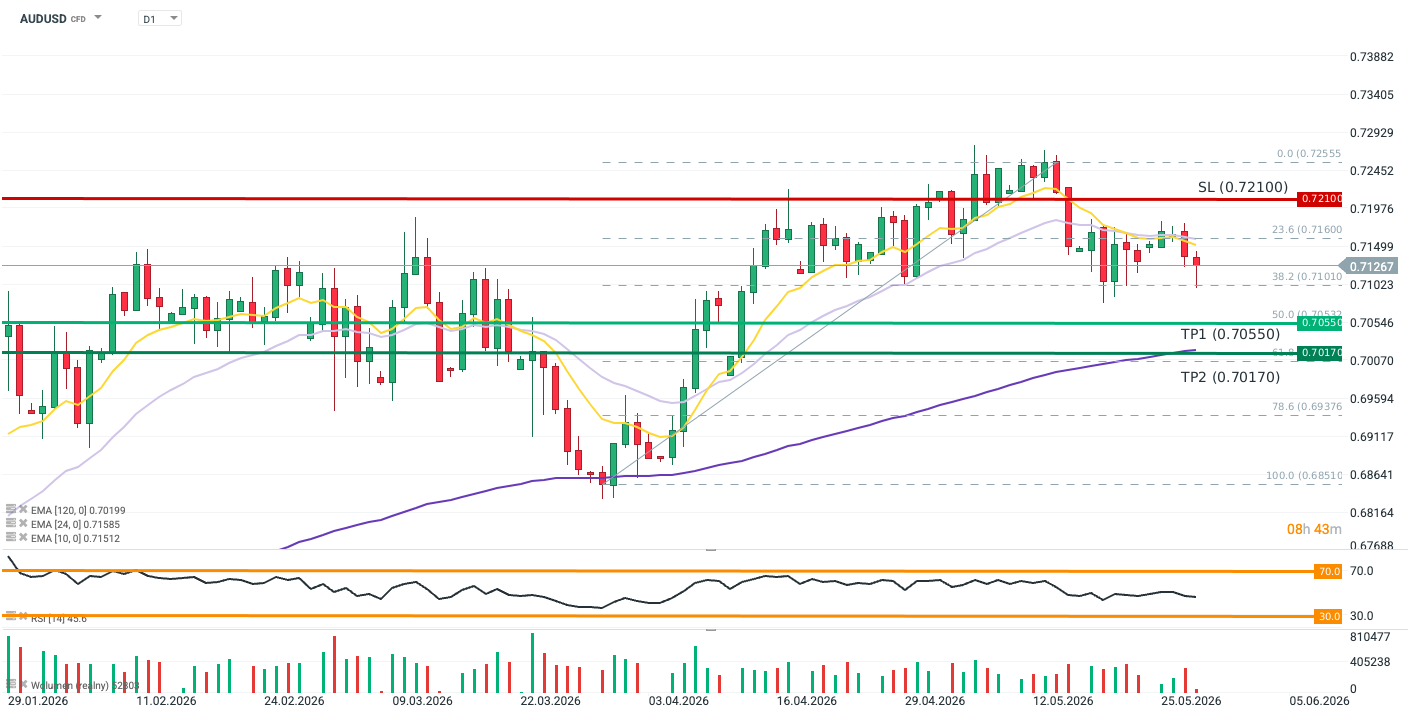
From a technical perspective, the overnight downfall dragged the USD/CAD pair below the 23.6% Fibonacci retracement level of the recent upswing from the monthly low. However, momentum indicators are holding a constructive bullish bias and back the topside tilt. Furthermore, the Relative Strength Index (RSI) is hovering near 57, and Moving Average Convergence Divergence (MACD) is in positive territory, hinting that buyers still retain control while spot prices stay above the 38.2% Fibo. support near mid-1.3700s. If a deeper pullback unfolds, spot prices could find decent support around 1.3720-1.3700 confluence – comprising the 50% Fibo. and the 100-day Simple Moving Average (SMA).
On the topside, momentum back above the 23.6% retracement at 1.3797 would open the door toward the overnight swing high, near 1.3872. This is followed by the 1.3900 round figure and the 1.3930-1.3940 supply zone, which, if cleared decisively, should pave the way for an extension of the month-to-date uptrend.
(The technical analysis of this story was written with the help of an AI tool.)
USD/CAD daily chart
US Dollar Price Today
The table below shows the percentage change of US Dollar (USD) against listed major currencies today. US Dollar was the strongest against the Euro.
| USD | EUR | GBP | JPY | CAD | AUD | NZD | CHF | |
|---|---|---|---|---|---|---|---|---|
| USD | 0.11% | 0.06% | 0.05% | 0.03% | 0.02% | -0.40% | 0.03% | |
| EUR | -0.11% | -0.05% | -0.04% | -0.07% | -0.07% | -0.47% | -0.08% | |
| GBP | -0.06% | 0.05% | 0.00% | -0.04% | -0.03% | -0.43% | -0.02% | |
| JPY | -0.05% | 0.04% | 0.00% | -0.01% | -0.03% | -0.46% | -0.03% | |
| CAD | -0.03% | 0.07% | 0.04% | 0.00% | -0.02% | -0.42% | -0.00% | |
| AUD | -0.02% | 0.07% | 0.03% | 0.03% | 0.02% | -0.40% | 0.01% | |
| NZD | 0.40% | 0.47% | 0.43% | 0.46% | 0.42% | 0.40% | 0.42% | |
| CHF | -0.03% | 0.08% | 0.02% | 0.03% | 0.00% | -0.01% | -0.42% |
The heat map shows percentage changes of major currencies against each other. The base currency is picked from the left column, while the quote currency is picked from the top row. For example, if you pick the US Dollar from the left column and move along the horizontal line to the Japanese Yen, the percentage change displayed in the box will represent USD (base)/JPY (quote).