What is the technical outlook for AUD/CAD, GBP/USD and AUD/USD?
This analysis from the Overbalance series aims to identify three financial instruments, analysed primarily on the daily/four-hour timeframe (D1/H4). The analysis utilises only the Overbalance methodology, which helps to identify points where a trend may continue or where a reversal may occur. Todayโs analysis covers three instruments, assessed solely in terms of 1:1 correction structures. AUDCAD After several tests, the AUDCAD exchange rate has broken through the key support level at 0.9755, which, according to the Overbalance methodology, paves the way for a deeper downward correction. A potential target for the downside is the 0.9610 level, where the lower boundary of the large 1:1 pattern is located. Currently, the 0.9755 level is acting as resistance, and only a sustained return of the price above this zone could restore the bullish scenario.
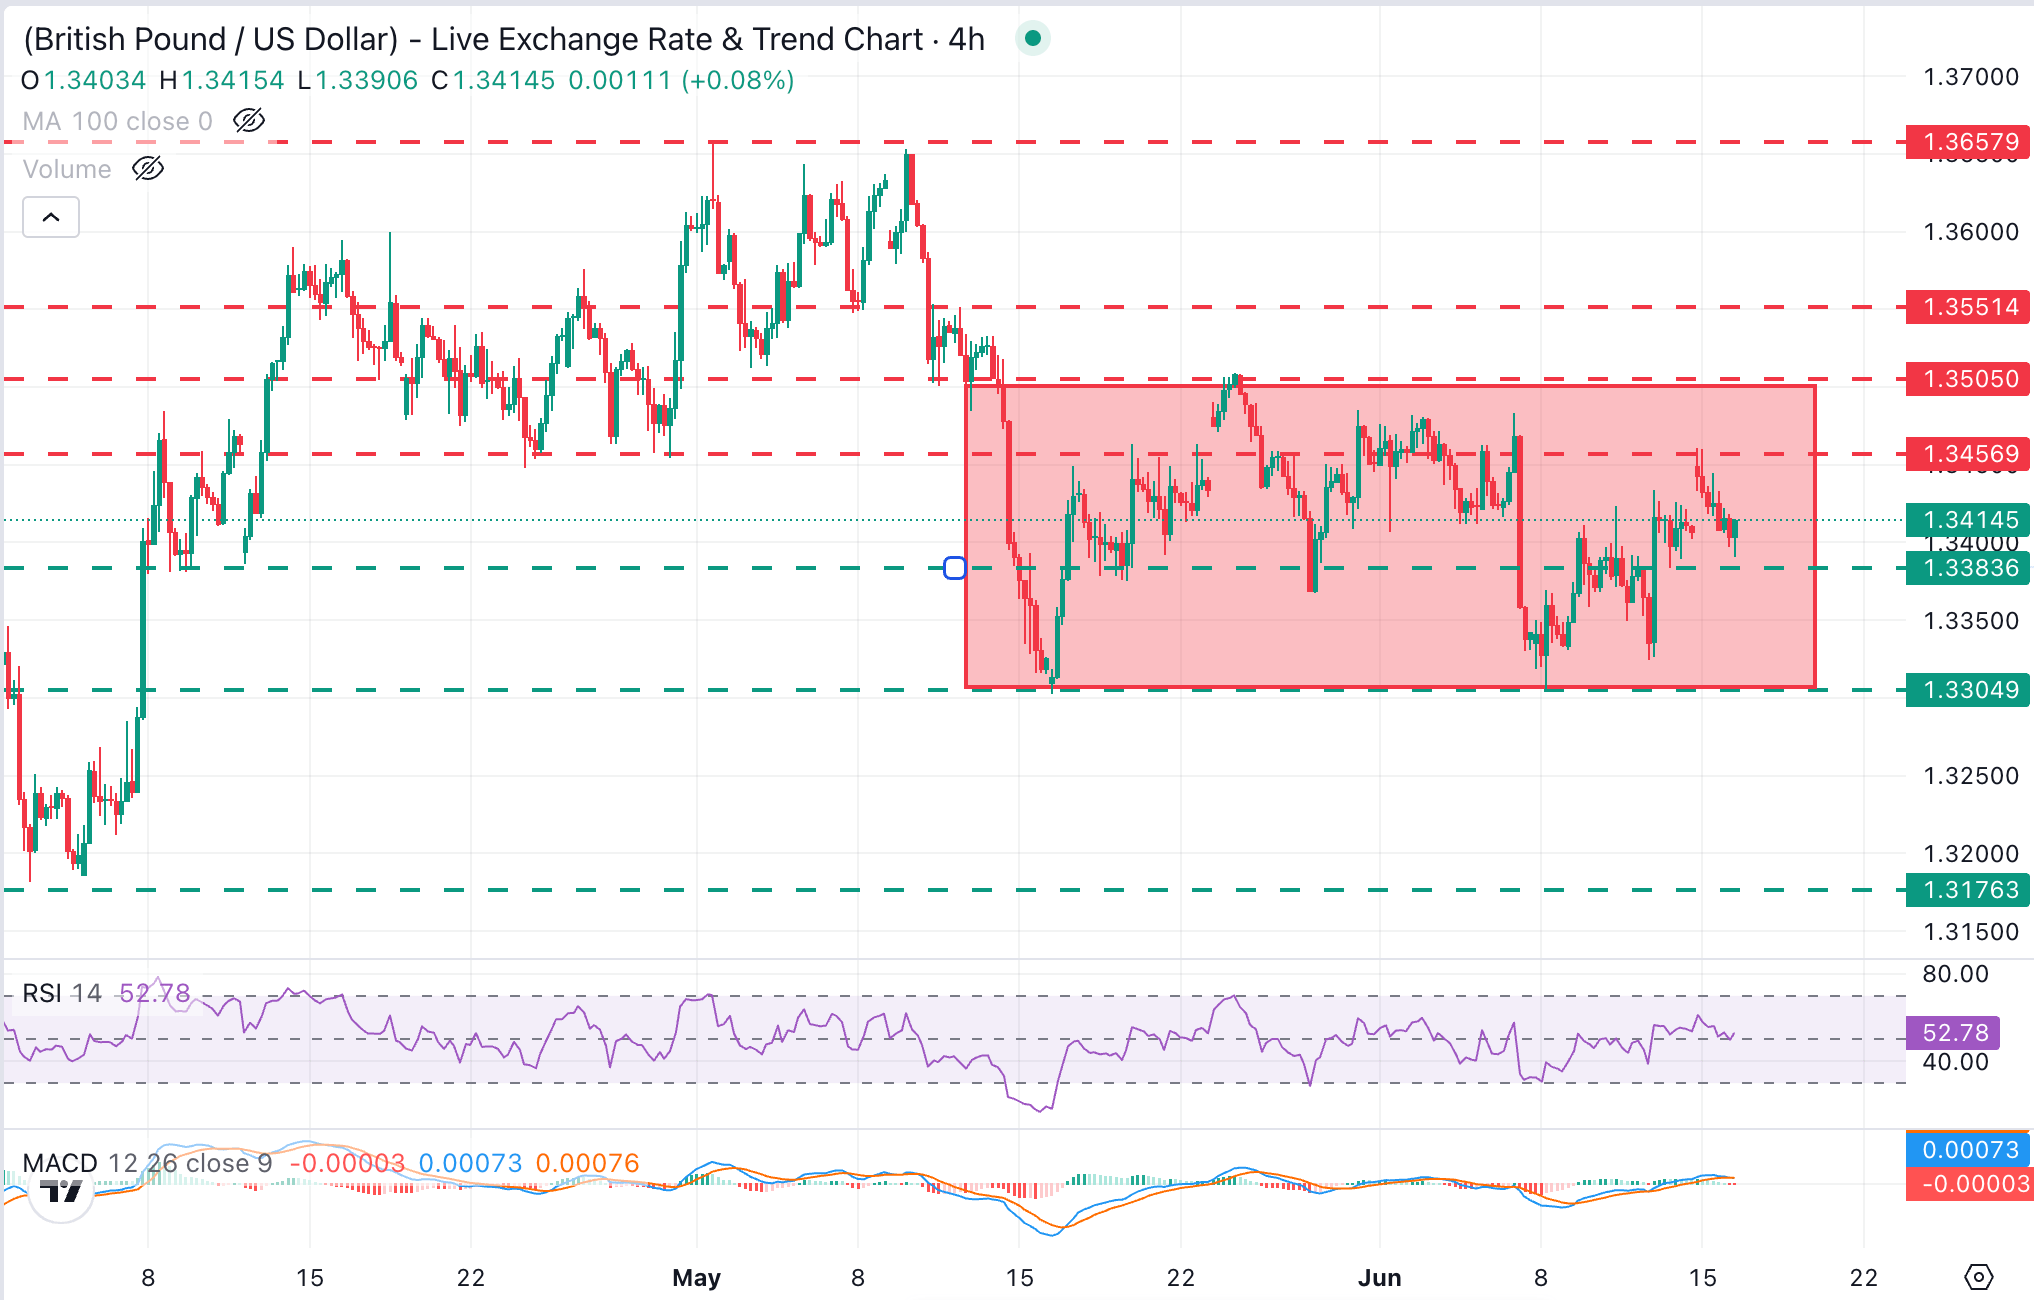
AUDCAD โ H4 timeframe. Source: xStation GBPUSD Since the beginning of April, GBPUSD has been trading within a local uptrend, supported by the 1:1 bullish pattern highlighted in green. The key support level remains at 1.3488. A potential bounce at this point could lead to the generation of another upward impulse. Conversely, a break below this level would open the way for a decline towards 1.3360, where the polarity of the previously broken downward pattern lies.
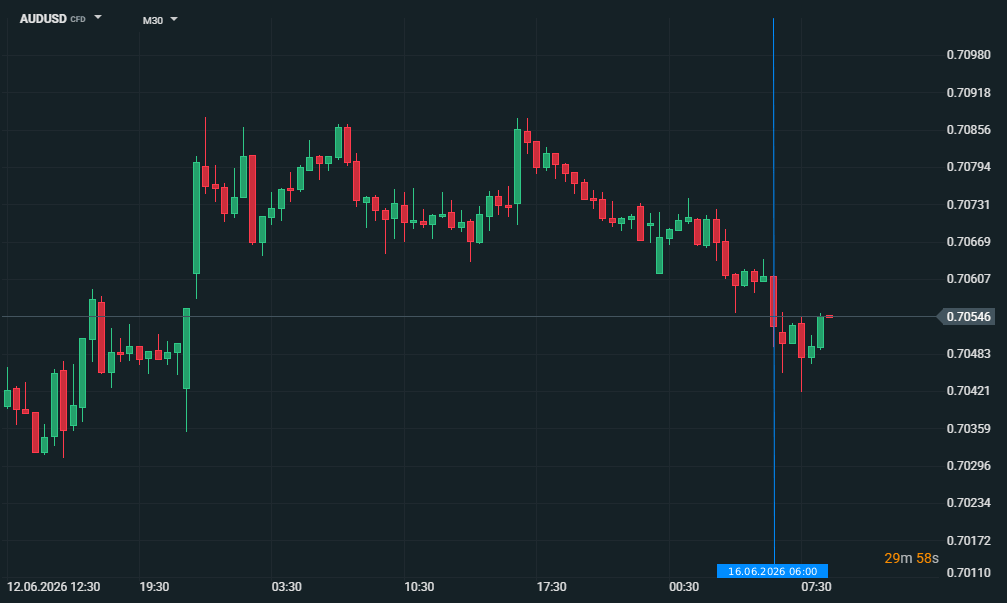
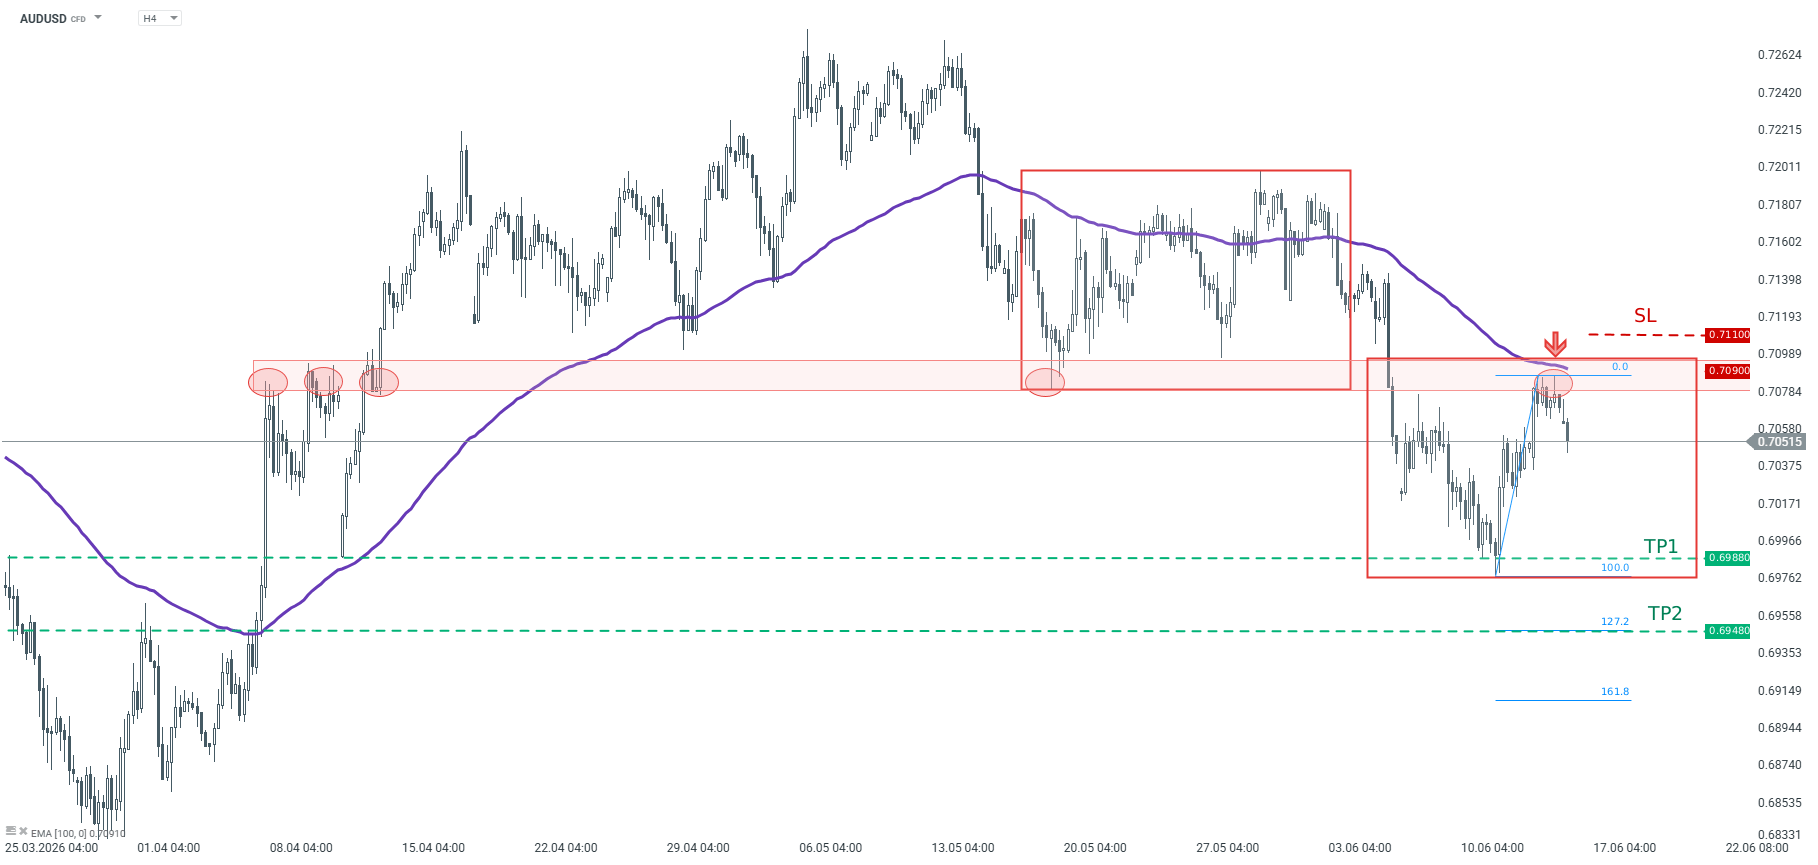
GBPUSD โ H4 chart. Source: xStation AUDUSD The AUDUSD pair remains in an uptrend. Recently, the pair reached a new local high, followed by a rapid correction. Should this correction deepen, the key support level is 0.7121, derived from the lower boundary of the 1:1 pattern. As long as this level holds, the base case scenario remains a continuation of the upward trend.
USD/INR appreciates as the US Dollar gains on increased risk aversion amid Middle East concerns.
Modiโs BJP won a third term in Assam and captured opposition stronghold West Bengal in a key election.
Indiaโs forex reserves fell from $728.5 billion, while equity outflows hit $19 billion in March and April.
USD/INR extends gains for the third successive day, trading around the fresh record high of 95.40, during the Asian hours on Tuesday. Traders will likely observe Indiaโs HSBC Composite and Services Purchasing Managers’ Index (PMI) data to be released on Wednesday.
The USD/INR pair appreciates as the US Dollar (USD) strengthens on safe-haven demand following Iranโs attack on the United Arab Emirates (UAE). CNBC reported Monday that the UAE was targeted by Iranian drones and missiles, while the US said it destroyed Iranian boats in the Strait of Hormuz. US President Donald Trump warned that Iran would be โblown off the face of the earthโ if it targets US ships protecting commercial vessels passing through the Strait of Hormuz.
The Indian Rupee (INR) faced challenges as an overnight surge in crude oil prices dampened investor sentiment. Oil prices, however, have since declined as concerns over immediate supply disruptions eased, with the United States (US) Navy taking steps to reopen the crucial Strait after Iran attempted to close it. Maersk, a Danish shipping and logistics company, later confirmed that its Alliance Fairfax, a US-flagged vehicle carrier, exited the strait under US military escort.
Indian Prime Minister Narendra Modiโs Bharatiya Janata Party (BJP) clinched a third straight term in Assam and captured opposition stronghold West Bengal in a key election.
On Monday, HSBC Manufacturing Purchasing Managers’ Index (PMI) in India came in at 54.7 for April, revised down from the preliminary 55.9 but higher than 53.9 in the prior month. Both output and new orders continued to expand, though growth remained subdued relative to levels seen over the past three and a half years.
Foreign institutional investors (FII) turned net buyers of Indian equities on Monday after nine consecutive days of selling, with inflows totaling 28.36 billion rupees ($298 million). Domestic institutional investors (DII) bought local shares worth 47.64 billion rupees, marking their seventh straight session of purchases, per Reuters.
Stock-specific moves linked to earnings are also expected to remain in focus. Nifty 50 constituents Larsen & Toubro, Mahindra and Mahindra, and Hero MotoCorp are scheduled to announce their quarterly results later in the day.
Indiaโs foreign exchange reserves have declined from a peak of $728.5 billion, while equity outflows reached $19 billion across March and April. Nevertheless, the Reserve Bank of India (RBI) has stated that it remains comfortable with reserve levels sufficient to cover 11 months of imports, though recent policy discussions highlight renewed urgency to strengthen buffers amid ongoing capital outflows.
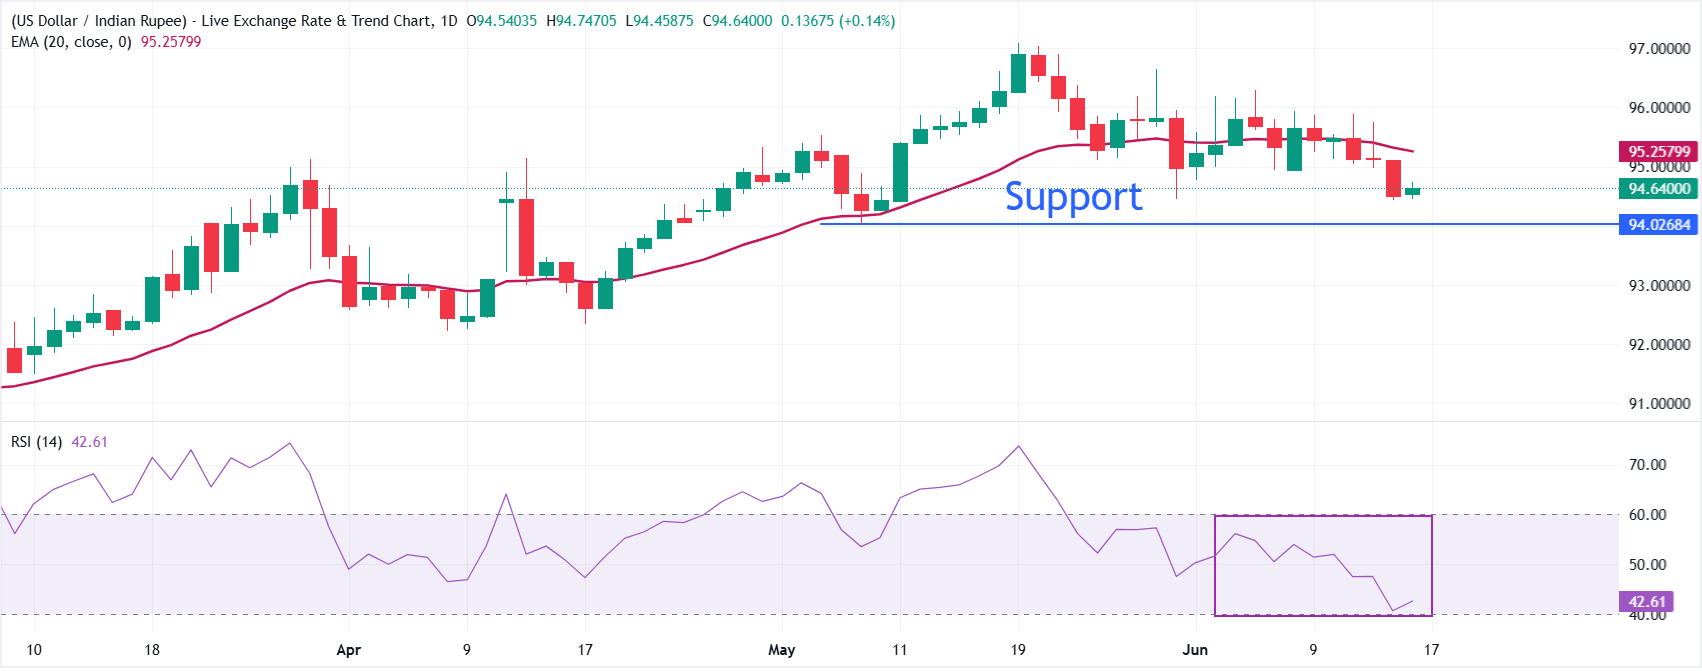
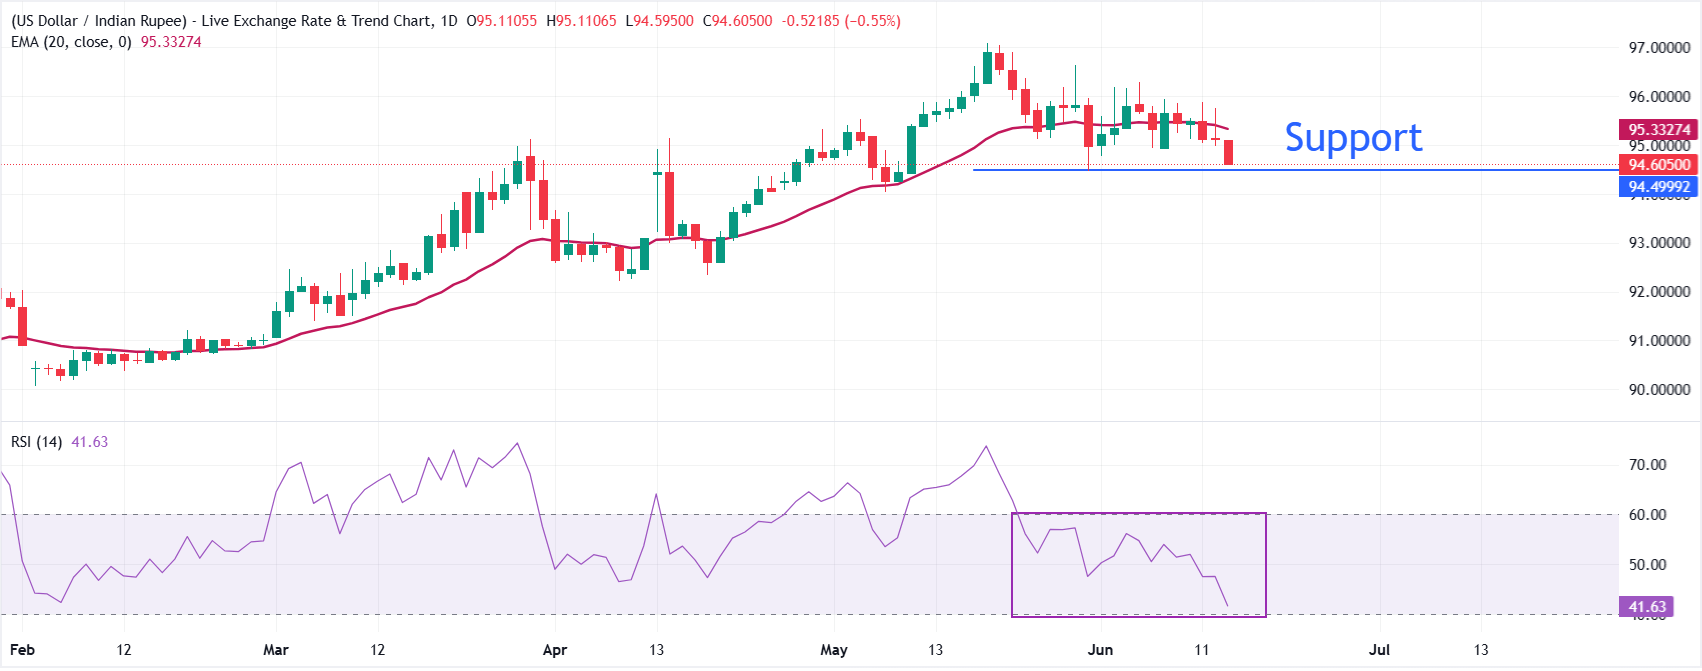
USD/INR trades around 95.40 at the time of writing on Tuesday. The technical analysis of the daily chart indicates a potential for a bullish emergence as the pair is testing the upper boundary of the rectangular channel.
However, the USD/INR pair retains a bullish near-term bias as price holds above the nine-day and 50-day Exponential Moving Averages (EMAs). The 14-day Relative Strength Index (RSI) at 66.7 points to firm positive momentum edging toward overbought territory, suggesting upside pressure persists while leaving the pair vulnerable to bouts of consolidation if buyers lose traction.
The USD/INR pair is testing the upper boundary of the rectangle, followed by the all-time high of 95.40, which was recorded on May 4. On the downside, the initial support lies at the nine-day EMA of 94.71. A break below the short-term average would lead the pair to test the 50-day EMA at 93.20, followed by the lower rectangle boundary around 92.50 and a seven-week low of 92.14.
(The story was corrected on May 5 at 6:10 GMT to say in the first paragraph to say that the HSBC PMI data will be released on Wednesday, not Tuesday.)
USD/INR: Daily Chart
US Dollar Price Today
The table below shows the percentage change of US Dollar (USD) against listed major currencies today. US Dollar was the strongest against the Australian Dollar.
USD
EUR
GBP
JPY
CAD
AUD
NZD
INR
USD
0.04%
0.06%
0.00%
-0.02%
0.16%
0.10%
0.14%
EUR
-0.04%
0.00%
-0.02%
-0.03%
0.12%
0.06%
0.25%
GBP
-0.06%
-0.00%
-0.04%
-0.08%
0.10%
0.07%
0.09%
JPY
0.00%
0.02%
0.04%
-0.01%
0.15%
0.11%
0.30%
CAD
0.02%
0.03%
0.08%
0.00%
0.16%
0.11%
0.32%
AUD
-0.16%
-0.12%
-0.10%
-0.15%
-0.16%
-0.04%
0.15%
NZD
-0.10%
-0.06%
-0.07%
-0.11%
-0.11%
0.04%
-0.01%
INR
-0.14%
-0.25%
-0.09%
-0.30%
-0.32%
-0.15%
0.01%
The heat map shows percentage changes of major currencies against each other. The base currency is picked from the left column, while the quote currency is picked from the top row. For example, if you pick the US Dollar from the left column and move along the horizontal line to the Japanese Yen, the percentage change displayed in the box will represent USD (base)/JPY (quote).

USD/CAD stalls a two-day-old recovery move from a nearly two-month trough amid mixed cues.
Elevated Oil prices underpin the Loonie, while rising US-Iran tensions benefit the safe-haven USD.
The technical setup, too, warrants some caution before positioning for any meaningful upside.
The USD/CAD pair struggles to capitalize on a two-day-old recovery move from the 1.3550 area, or its lowest level since March 10, and oscillates in a range during the Asian session on Tuesday. Spot prices currently trade around the 1.3620 area amid a combination of diverging forces.
The risk of a further escalation of tensions in the Middle East amid the US-Iran standoff over the Strait of Hormuz acts as a tailwind for Crude Oil prices, which is seen underpinning the commodity-linked Loonie. This, along with the lack of follow-through US Dollar (USD) buying, keeps a lid on the USD/CAD pair. However, persistent geopolitical uncertainties and hawkish US Federal Reserve (Fed) expectations favor the USD bulls, backing the case for a further appreciating move for the currency pair.
The USD/CAD pair is holding a mildly bearish near-term bias as it remains capped beneath the 100-period Simple Moving Average (SMA) on the 4-hour chart. The said hurdle at 1.3650 coincides with the 23.6% Fibonacci retracement level of the late March-early May downfall and should act as a pivotal point. Momentum indicators are mixed, with the Relative Strength Index nearing the neutral territory at 51 and the Moving Average Convergence Divergence (MACD) marginally positive.
The technical setup, in turn, hints at fading downside pressure but not yet a clear bullish reversal while the USD/CAD pair trades below the aforementioned confluence hurdle. A sustained strength beyond, however, should pave the way for further gains towards the 38.2% retracement at 1.3710 and the 50.0% level at 1.3758. The momentum could extend further towards the 61.8% level at 1.3806, which is the prevailing supply zone on the topside.
On the downside, the next meaningful support aligns with the recent swing low around 1.3553, where buyers may attempt to rebuild a base should selling pressure resume.
(The technical analysis of this story was written with the help of an AI tool.)
EUR/USD tests immediate support at the 50-day EMA near 1.1682.
The 14-day Relative Strength Index nears 50 underscores neutral momentum.
The immediate barrier lies at the nine-day EMA around 1.1706.
EUR/USD moves little after two days of losses, trading around 1.1690 during the Asian hours on Tuesday. The daily chart technical analysis indicates a potential for a bearish reversal, as the pair is testing the lower boundary of the ascending channel.
However, a neutral near-term stance prevails asย the EUR/USD pairย hovers just above the 50-period Exponential Moving Average (EMA) but is capped by the nine-period EMA. This tight EMA split suggests consolidation rather than a clear trend.
The 14-day Relative Strength Index near 50 reinforces the idea of balanced momentum after the recent recovery.
The EUR/USD pair is testing the immediate support at the 50-day EMA of 1.1682, aligned with the lower ascending channel boundary. A sustained break below the channel would put downward pressure on the pair to navigate the region around the nine-month low of 1.1411, recorded on March 13.
On the upside, the immediate barrier lies at the nine-day EMA of 1.1706. A break above the short-term average would support the pair to the 11-week high of 1.1849, reached on April 17, followed by the upper boundary of the ascending channel around 1.1960. Further advances above the channel would lead the pair to explore the region around 1.2082, the highest since June 2021, reached on January 27.
EUR/USD: Daily Chart
Euro Price Today
The table below shows the percentage change of Euro (EUR) against listed major currencies today. Euro was the strongest against the New Zealand Dollar.
USD
EUR
GBP
JPY
CAD
AUD
NZD
CHF
USD
-0.01%
0.00%
-0.03%
-0.04%
0.04%
0.05%
-0.04%
EUR
0.01%
0.00%
-0.02%
-0.03%
0.04%
0.05%
-0.01%
GBP
-0.01%
-0.00%
-0.02%
-0.05%
0.05%
0.05%
-0.02%
JPY
0.03%
0.02%
0.02%
-0.01%
0.06%
0.08%
0.03%
CAD
0.04%
0.03%
0.05%
0.01%
0.08%
0.08%
0.02%
AUD
-0.04%
-0.04%
-0.05%
-0.06%
-0.08%
0.02%
-0.04%
NZD
-0.05%
-0.05%
-0.05%
-0.08%
-0.08%
-0.02%
-0.07%
CHF
0.04%
0.01%
0.02%
-0.03%
-0.02%
0.04%
0.07%
The heat map shows percentage changes of major currencies against each other. The base currency is picked from the left column, while the quote currency is picked from the top row. For example, if you pick the Euro from the left column and move along the horizontal line to the US Dollar, the percentage change displayed in the box will represent EUR (base)/USD (quote).
The EUR/USD exchange rate is trading around 1.1719 on Monday, and despite seemingly positive industrial data, the eurozone is sending out worrying signals. The final reading of the PMI index for the manufacturing sector stood at 52.2 points in April, up from 51.6 a month earlier, which at first glance looks like a solid improvement. In reality, however, the rise in manufacturing activity is not driven by real demand, but by increased stockpiling by firms seeking to secure goods against further shortages and price rises resulting from the escalation of tensions in the Middle East. This is a seemingly positive result, which in fact says more about the fear of supply chain disruptions than about the actual strength of the European economy. The devil is in the details, and it is these details that are shaping the outlook for both growth and inflation in the eurozone.
Delivery delays have reached their worst level since July 2022, input cost inflation has risen to a 46-month high, and price pressures are increasingly being passed on to selling prices, marking the largest monthly jump since records began in 1997. As a result, the ECB faces a real dilemma: the data suggest a recovery, but leading indicators of producer sentiment and expectations merely confirm the growing risk of stagflation. For EUR/USD, this implies an environment of heightened uncertainty, in which the exchange rate may be prone to sharp movements depending on further signals from the Fed and the ECB, and any stronger US inflation data could push the pair back towards the support level at 1.1650.
On the EUR/USD daily chart, following a sharp rally to around 1.2060 at the start of the year, the exchange rate underwent a significant correction that brought prices down to lows around 1.1380, from where a rebound occurred.
Currently, the pair is trading at 1.1719, oscillating near the 50-day EMA (1.1681) and the 100-day EMA (1.1678), which together form a dynamic support zone, while the 200-day EMA at 1.1634 serves as another line of defense for the bulls. Bollinger Bands indicate narrowing volatility, with the upper band at 1.1771 and the lower band at 1.1669, signaling a potential breakout in the coming sessions. The RSI is hovering around the neutral level of 52, which does not provide a clear directional signal and suggests that the market is still looking for momentum for a decisive move above the resistance at 1.1800 or a deeper correction toward the aforementioned 200-day EMA support.
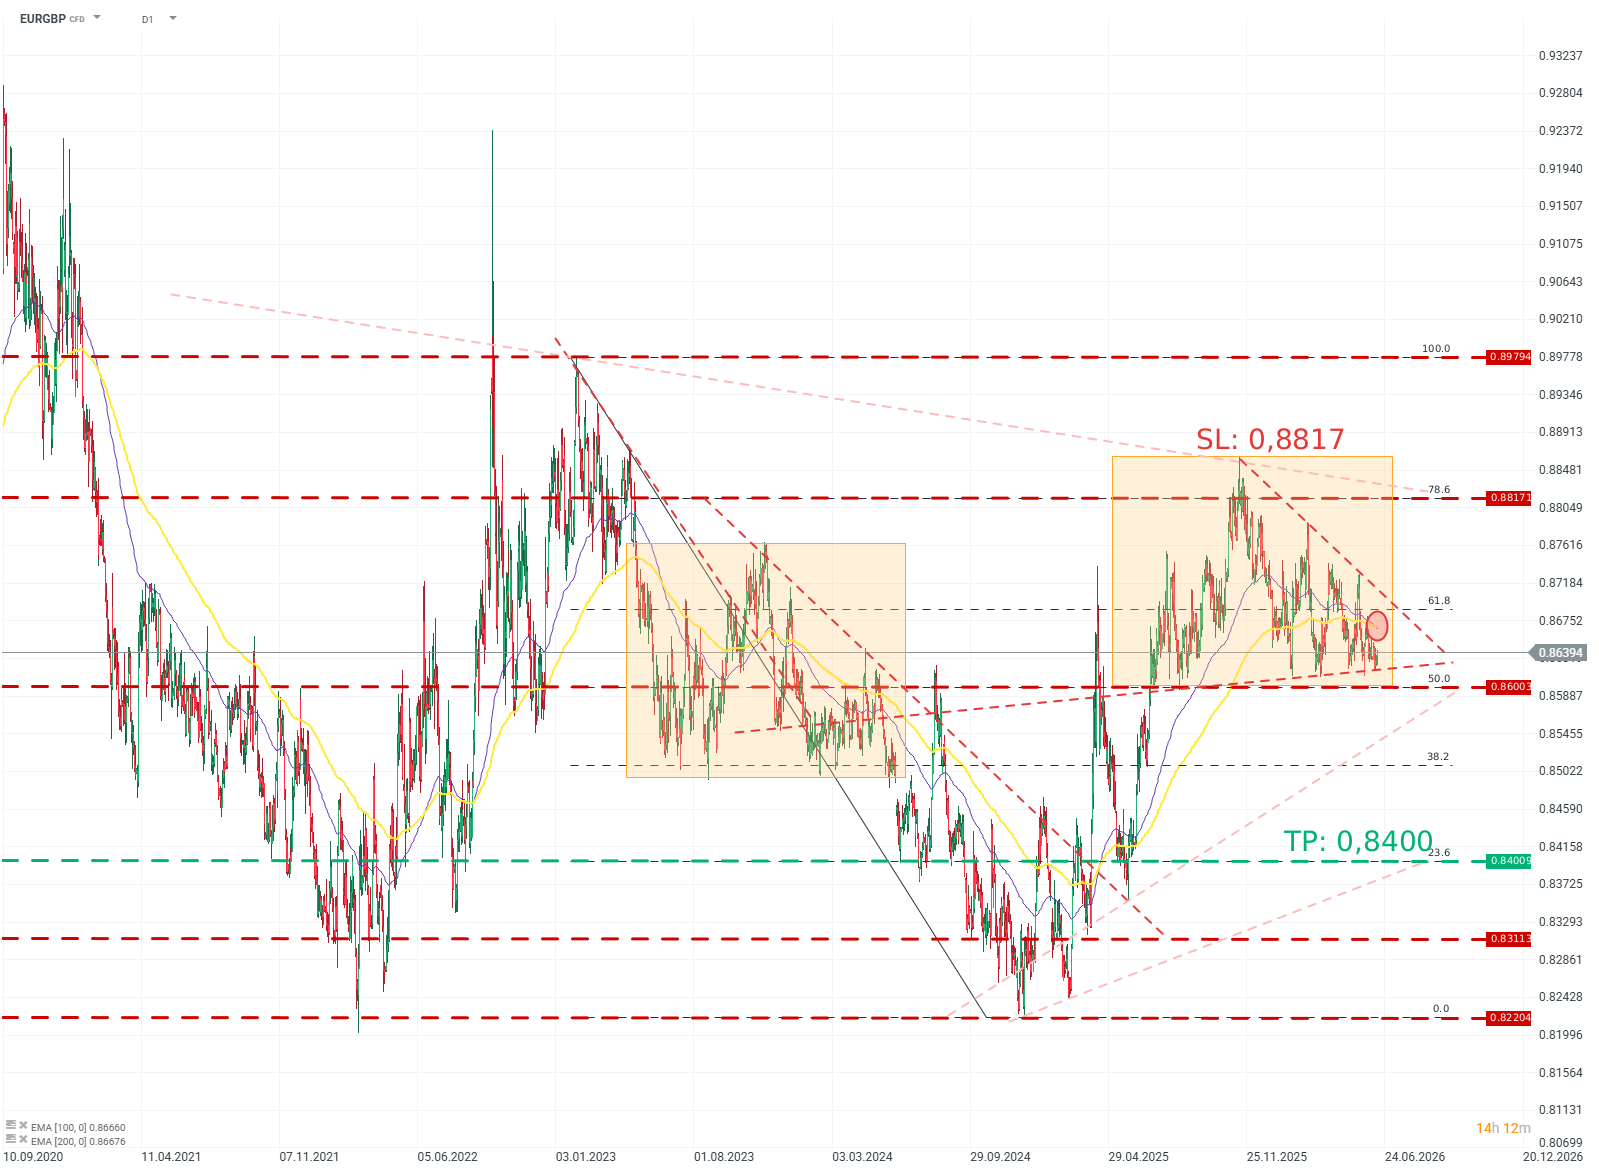
EUR/GBP recovery attempt from 0.8620 lows remains limited below 0.8640.
The Pound is outperforming the Euro, with risk appetite subdued.
Euro bears remain in control, with the 2026 low near 0.8610 at a short distance.
The Euroย (EUR) opens the week on a soft note against theย British Poundย (GBP). The pair shows moderate losses, as Fridayโs upside attempt from the 0.8620 lows failed to find acceptance above a previous support area at 0.8640, which leaves the year-to-date low, at 0.8611, exposed
The Pound shows a slightly better performance than the Euro on a cautious start to the week, with all eyes on the Strait of Hormuz, after US President Donald Trump flagged a military operation to free vessels of neutral nations stranded in the critical waterway, but without providing further details.
The UKย economic calendarย is thin on Monday. In Europe, Aprilโs final HCOB Manufacturing Purchasing Managers Index (PMI) is expected to confirm a moderate expansion in the sector’s activity, while the Sentix Index will provide details about investorsโ confidence ahead of speeches by some European Central Bank (ECB) policymakers.
Technical Analysis: Previous support at 0.8640 is holding bulls
EUR/GBPย remains stalled below the confluence of a reverse trendline from late March highs and the area between 0.8630 and 0.8640, which supported bears on March 23, 24, and 26.
Technical indicators in 4-hour charts are in bearish territory. The Relative Strength Index (RSI) around 38 signals weak demand rather than oversold stress, while the Moving Average Convergence Divergence (MACD) histogram fluctuates around the zero line, hinting at sluggish momentum.
Failure to extend recovery past 0.8640 leaves the 2026 low, at 0.8611 (March 19 low), on the bears’ focus. Further down, the next target is the August 2025 low, at 0.8596. On the upside, a confirmation above 0.8640 would shift the focus towards the April 27 and 28 lows, around 0.8655, and the April 24 high, near 0.8685.
Euro Price Today
The table below shows the percentage change of Euro (EUR) against listed major currencies today. Euro was the strongest against the Australian Dollar.
USD
EUR
GBP
JPY
CAD
AUD
NZD
CHF
USD
-0.06%
-0.01%
-0.09%
0.06%
0.07%
-0.13%
-0.05%
EUR
0.06%
0.01%
-0.04%
0.12%
0.14%
-0.06%
-0.01%
GBP
0.00%
-0.01%
-0.06%
0.11%
0.12%
-0.11%
-0.01%
JPY
0.09%
0.04%
0.06%
0.12%
0.11%
-0.10%
-0.02%
CAD
-0.06%
-0.12%
-0.11%
-0.12%
-0.01%
-0.22%
-0.12%
AUD
-0.07%
-0.14%
-0.12%
-0.11%
0.00%
-0.24%
-0.14%
NZD
0.13%
0.06%
0.11%
0.10%
0.22%
0.24%
0.09%
CHF
0.05%
0.00%
0.00%
0.02%
0.12%
0.14%
-0.09%
The heat map shows percentage changes of major currencies against each other. The base currency is picked from the left column, while the quote currency is picked from the top row. For example, if you pick the Euro from the left column and move along the horizontal line to the US Dollar, the percentage change displayed in the box will represent EUR (base)/USD (quote).
EUR/USD struggles to capitalize on a modest bullish gap at the start of a new week.
The technical setup favors bulls and backs the case for some upside in the near-term.
A break below the 1.1650-1.1645 confluence is needed to negate the positive bias.
The EUR/USD pair attracts some intraday sellers following a modest Asian session uptick to mid-1.1700s and fills a major part of a bullish gap at the start of a new week. Spot prices, however, manage to hold above the 1.1700 round figure, warranting some caution before positioning for an extension of Friday’s retracement slide from a one-and-a-half week top.
From a technical perspective,ย the EUR/USD pairย holds a modest bullish bias as it trades above the 200-period Simple Moving Average (SMA) on the 4-hour chart, suggesting dips are being absorbed for now. Meanwhile, the Relative Strength Index (RSI) is near 53 points to mildly positive but not overstretched momentum, while the Moving Average Convergence Divergence (MACD) indicator remains slightly in positive territory. This hints that upside pressure is present but not yet impulsive.
However, Friday’s pullback makes it prudent to wait for a sustained strength and acceptance above the 1.1750 area, or the 23.6%ย Fibonacciย retracement level of the March-April upswing, before positioning for further gains. A subsequent hurdle is aligned at the recent cycle high area at 1.1847.
On the downside, initial support is seen at the 38.2% retracement around 1.1692, followed by a key confluence zone formed by the 200-period SMA at 1.1648 and the 50.0% retracement at 1.1644. A deeper pullback could then target the 61.8% level at 1.1596, ahead of 1.1528 and 1.1441.
(The technical analysis of this story was written with the help of an AI tool.)
AUD/JPY weakens to around 112.95 in Mondayโs early European session.ย
The cross keeps bullish vibe above the 100-day EMA, but further consolidation cannot be ruled out in near term.ย
The immediate resistance level emerges at 113.40; the initial support level is seen at 112.00.ย
The AUD/JPY cross loses ground near 112.95 during the early European session on Monday. The Australian Dollar (AUD) softens against the Japanese Yen (JPY) as uncertainty surrounding Middle East tensions and the closure of the Strait of Hormuz boosts safe-haven assets.
US President Donald Trump announced the US will begin guiding ships through the Strait of Hormuz starting Monday, per CNN. Meanwhile, Iranian official Ebrahim Azizi warned that the plan is a violation of the ceasefire.
On the other hand, markets expect the Reserve Bank of Australia (RBA) to deliver a third straight interest rate hike on Tuesday. The primary driver is a significant jump in headline inflation in March, fueled by global energy shocks and Middle East tensions.
Technical Analysis:
In the daily chart, AUD/JPY maintains a constructive bullish bias as spot holds well above the 100-day Exponential Moving Average (EMA), keeping the broader uptrend intact despite the latest pullback from recent highs. Price is also trading above the lower Bollinger Band, while the Relative Strength Index (RSI) at 50.8 has eased back to neutral territory, hinting at a consolidation phase rather than an outright reversal.
On the topside, initial resistance is aligned with the 20-day Bollinger middle band at 113.40. A sustained break above this pivot would expose the April 28 high of 114.72, en route to the upper Bollinger band near 115.18 as the next bullish target. On the downside, immediate support is seen around the 112.00 psychological level, followed by the lower Bollinger band at 111.65; a deeper correction towards the 100-day EMA at 109.37 would still be consistent with a broader bullish structure while offering a potentially stronger demand zone.
To provide the best experiences, we use technologies like cookies to store and/or access device information. Consenting to these technologies will allow us to process data such as browsing behavior or unique IDs on this site. Not consenting or withdrawing consent, may adversely affect certain features and functions.
Functional
Always active
The technical storage or access is strictly necessary for the legitimate purpose of enabling the use of a specific service explicitly requested by the subscriber or user, or for the sole purpose of carrying out the transmission of a communication over an electronic communications network.
Preferences
The technical storage or access is necessary for the legitimate purpose of storing preferences that are not requested by the subscriber or user.
Statistics
The technical storage or access that is used exclusively for statistical purposes.The technical storage or access that is used exclusively for anonymous statistical purposes. Without a subpoena, voluntary compliance on the part of your Internet Service Provider, or additional records from a third party, information stored or retrieved for this purpose alone cannot usually be used to identify you.
Marketing
The technical storage or access is required to create user profiles to send advertising, or to track the user on a website or across several websites for similar marketing purposes.