- AUD/JPY softens to near 113.45 in Thursday’s early European session.
- The cross maintains a constructive outlook, with bullish RSI momentum.
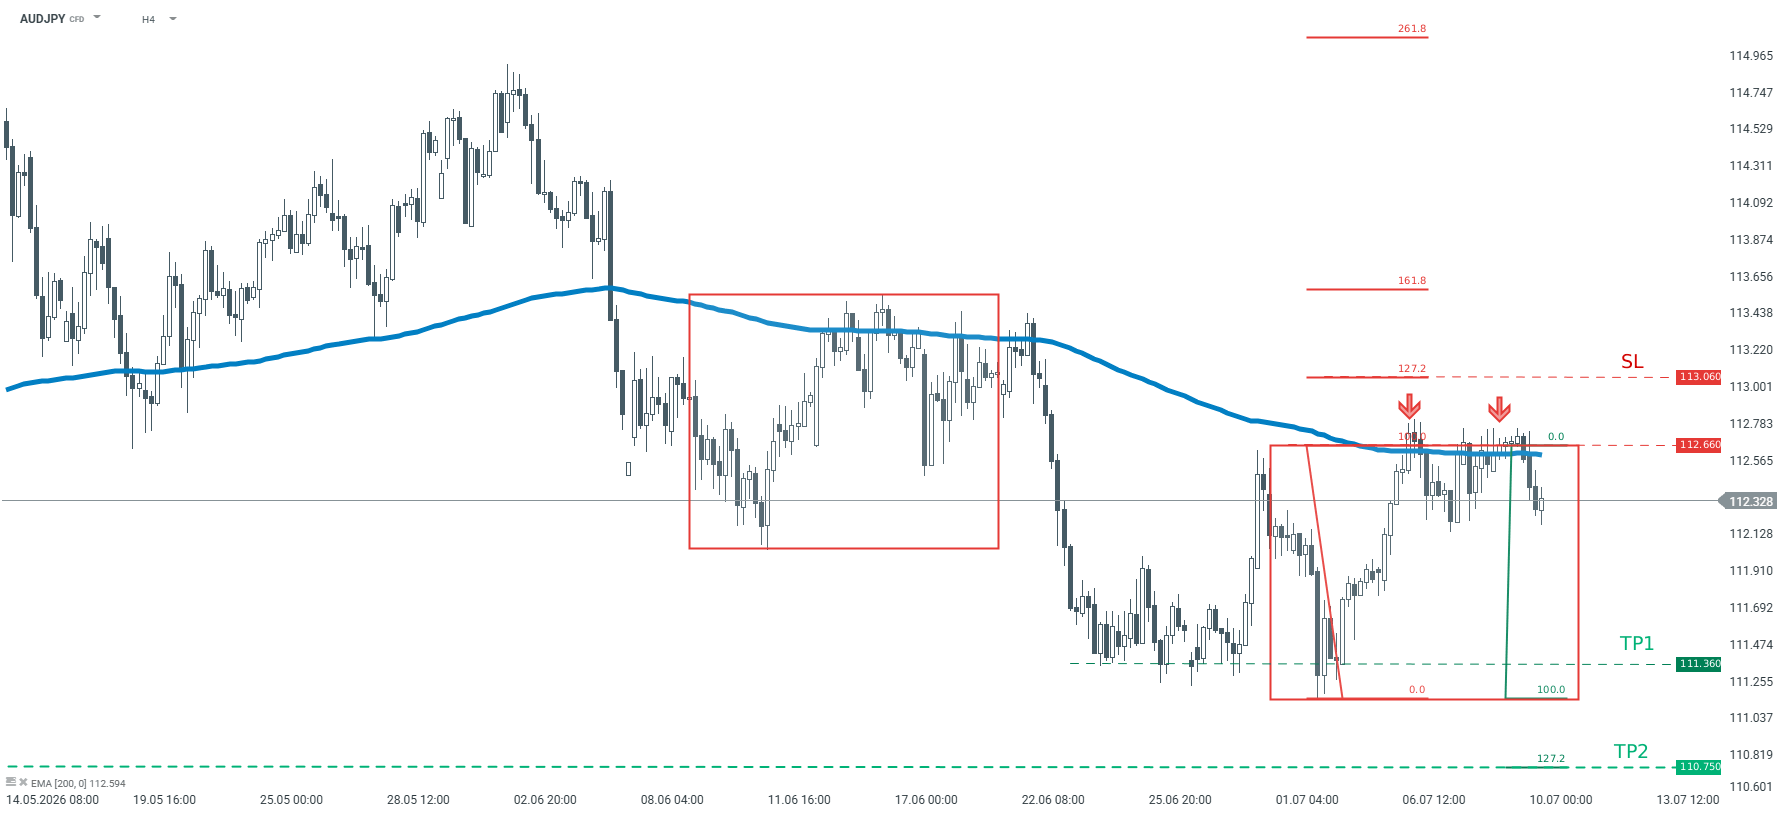
- The immediate resistance level is seen at 113.70; the initial support level to watch is 112.65.
The AUD/JPY cross trades in negative territory around 113.45 during the early European trading hours on Thursday. Verbal intervention from Japanese authorities provides some support to the Japanese Yen (JPY) against the Australian Dollar (AUD).
Japan’s Finance Minister Satsuki Katayama said on Thursday that the authorities are ready to take appropriate action on currency anytime as needed. She added that the officials will track market trends and economic data to ensure fiscal sustainability.
Senior officials from the Bank of Japan (BoJ) noted that a delay in stimulus adjustment amid high inflation risk could trigger an economic downturn. However, a Reuters survey showed earlier Thursday that nearly half of Japanese firms are experiencing negative business impact from the BoJ’s interest rate hikes, with higher borrowing costs hurting bottom lines and discouraging capital investment.
Technical Analysis:
In the daily chart, AUD/JPY holds a bullish near-term bias as price remains above the 100-day Simple Moving Average (SMA) and the Bollinger Bands 20-period middle band, suggesting the broader uptrend is still supported despite recent consolidation. The latest Relative Strength Index (14) reading around 57 keeps momentum on the constructive side, hinting that buyers retain control as long as the pair stays comfortably above the lower Bollinger band at 111.10.
On the topside, initial resistance emerges at the Bollinger upper band around 113.70, where a sustained break would open the door to the May 13 high of 114.74.
On the downside, the first layer of support is seen at the 100-day SMA at 112.65, followed by the Bollinger middle band near 112.40, while a deeper pullback towards the lower band at 111.10 would be needed to seriously challenge the prevailing bullish structure.