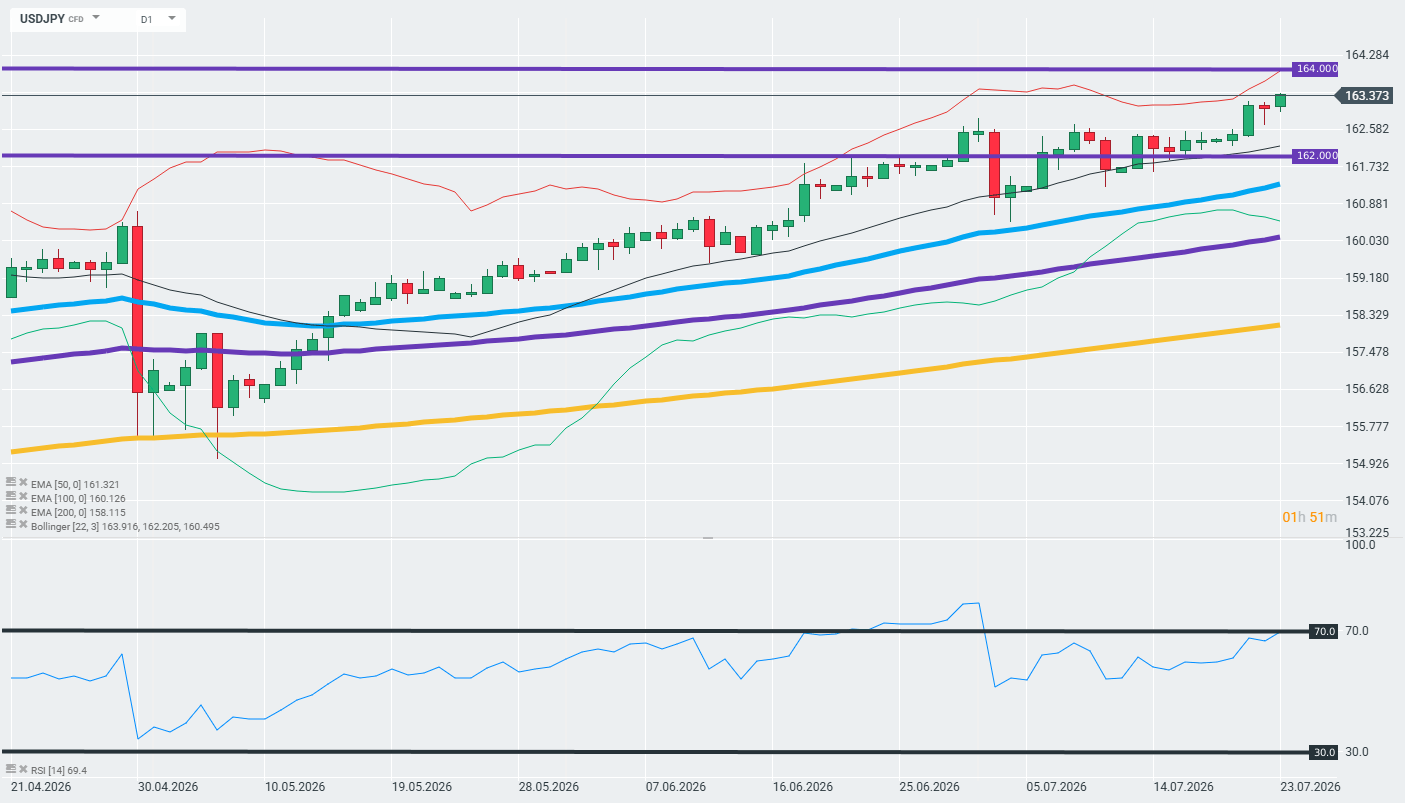
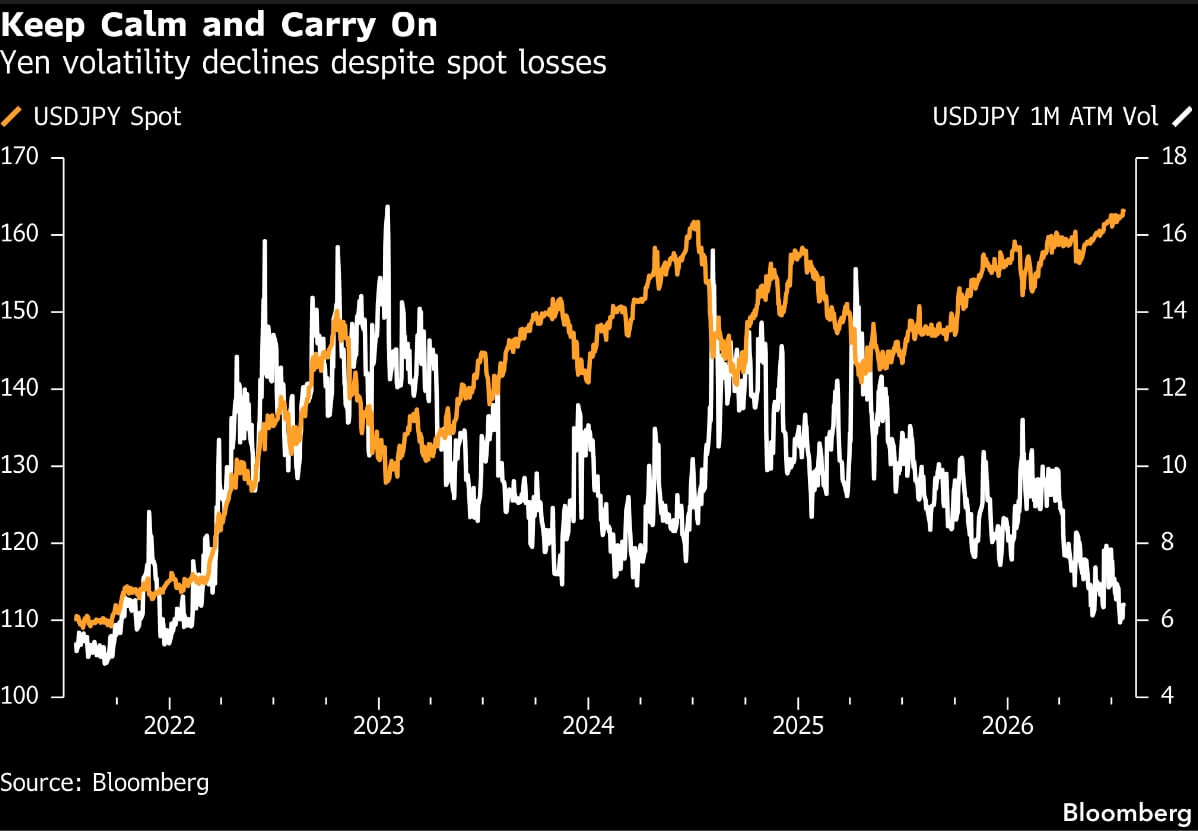
- USD/JPY steadies around 163.90 in Friday’s early Asian session.
- Japanese CPI inflation rose to 1.7% YoY in June from 1.5% in May.
- Trump vowed to punish Iran for Houthi attacks in the Red Sea.
The USD/JPY pair holds steady near 163.90 during the early Asian session on Friday. However, the Japanese Yen (JPY) remains near a multi-decade low against the US Dollar (USD). The preliminary readings of the US S&P Global Purchasing Managers Index (PMI) will be published later on Friday.
Data released by the Japan Statistics Bureau on Friday showed that Japan’s National Consumer Price Index (CPI) inflation rose to 1.7% YoY in June, up from 1.5% in May. Meanwhile, the core CPI came in at 1.6% YoY in June, versus 1.4% prior. The figure came in line with the market consensus. This is the first rise in core inflation since March.
The so-called “core-core” inflation rate, which strips out prices of fresh food and energy, fell to 1.7% YoY in June, compared to the previous reading of 1.8%. This figure registered the lowest since August 2022.
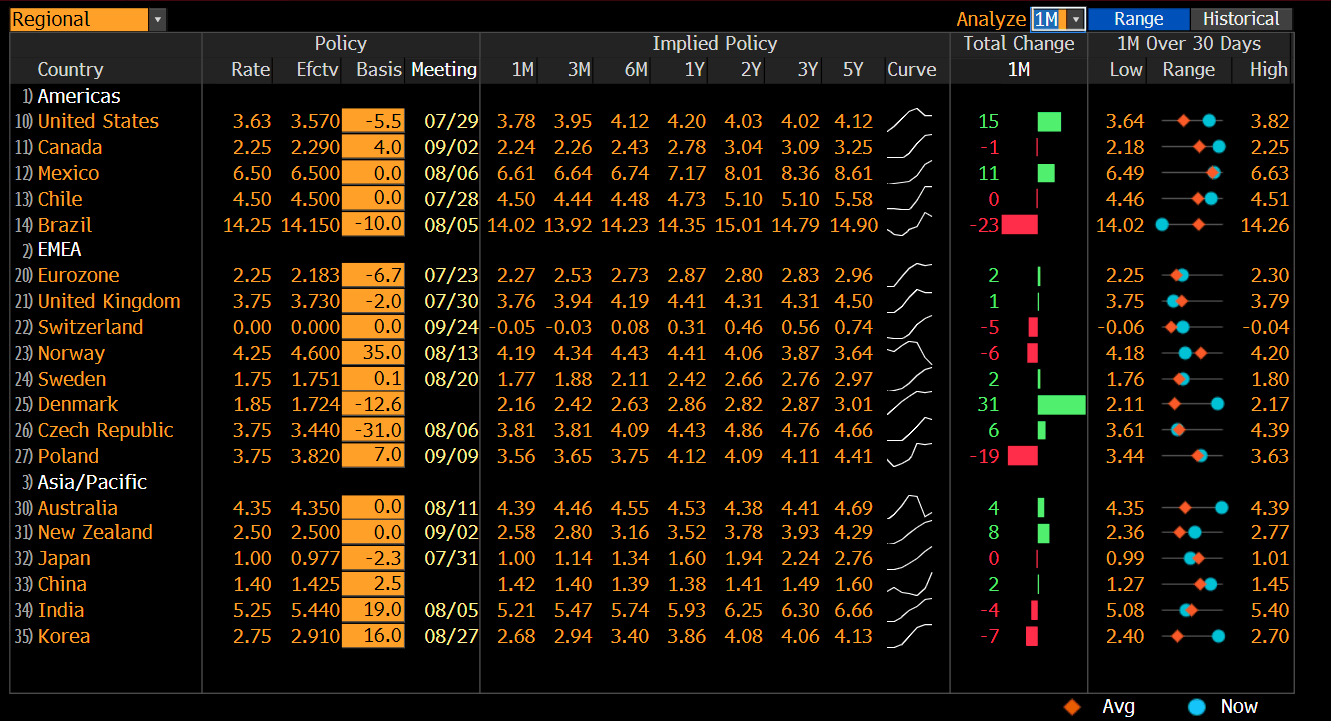
This reading came just days before the Bank of Japan (BoJ) policy meeting, where the central bank is widely expected to leave interest rates unchanged. Japan’s National CPI inflation report has little to no impact on the JPY as traders are on high alert for possible intervention from Japanese authorities.
Finance Minister Satsuki Katayama on Wednesday warned markets that authorities stood ready to take “appropriate and bold action.” Katayama added that Japan’s policy on potential intervention remained unchanged and that it would take action if necessary.
Escalating tensions in the Middle East could boost the Greenback against the JPY in the near term. Reuters reported on Thursday that US President Donald Trump said the US would hold Iran responsible for the Houthis’ actions and warned Iran and its Houthi allies would both soon receive a “major military punishment.”