
The offshore yuan weakened to around 6.81 per dollar on Monday, extending losses from the previous week as a series of weak economic data weighed on sentiment. New home prices across 70 major cities fell 3.5% year-on-year in April 2026, marking the sharpest pace of decline since May 2025, as existing stimulus efforts have yet to restore meaningful momentum in housing demand. Moreover, industrial output moderated to 4.1% year-on-year in April, marking the weakest expansion since July 2023, as disruptions linked to the Iran conflict weighed on manufacturing activity and export-oriented output. Retail sales growth also lost momentum, increasing just 0.2% year-on-year, the weakest performance since December 2022, highlighting subdued domestic consumption. On the labor front, China’s surveyed urban unemployment rate edged down to 5.2% in April from a more than one-year high of 5.4% in March, slightly better than market expectations and the lowest level since January.

Trade of the day: GBPUSD
Facts:
- The pair bounced off the lower limit of 1:1 structure at 1.3500
- Main trend on the pair remains upward from the beginning of April
Recommendation: Trade: Long GBPUSD at market price Target: 1.3635, 1.3700 Stop: 1.3439
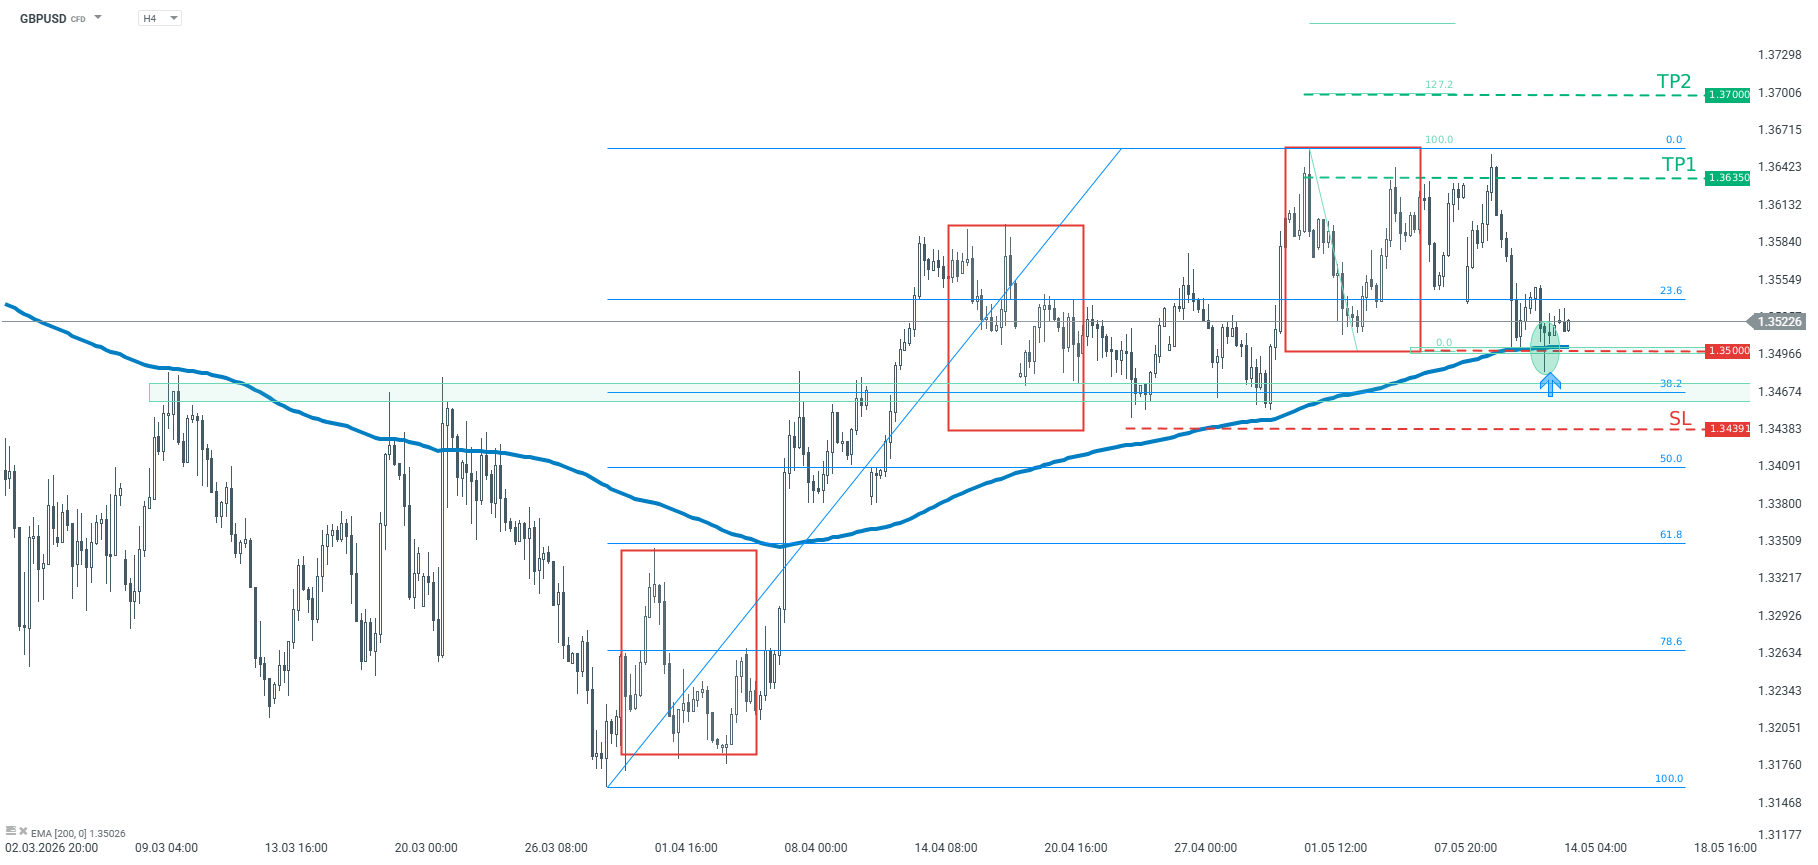
Opinion: Looking at GBPUSD chart, one can observe that the price bounced off the key technical support marked with the lower limit of 1:1 structure (red rectangles), as well as the 200-period moving average from H4 interval. In addition, the price formed a pin bar pattern on the chart. Should buyers manage to hold the price above the support area near 1.3500, another upward impulse may be about to start. We recommend taking a long position on GBPUSD at market price with two targets: 1.3635, and 1.3700. We recommend placing a stop loss order at 1.3439.

EUR/USD Price Forecast: Remains above 1.1700 near 50-day EMA
- EUR/USD may test the primary resistance at the nine-day EMA of 1.1730
- The 14-day Relative Strength Index is near 50, indicating a lack of strong direction.
- The lower ascending channel boundary is acting as immediate support, near the 50-day EMA at 1.1697.
EUR/USD inches higher after three days of losses, trading around 1.1710 during the Asian hours on Thursday. The daily chart technical analysis indicates a potential for a bearish reversal as the pair is positioned on the lower boundary of the ascending channel pattern.
The EUR/USD pair is holding just above the 50-day Exponential Moving average (EMA) but still capped by the nine-day EMA, which keeps the near-term tone broadly neutral with a slight bullish tilt. The price hovering between these averages suggests consolidation after recent gains, while the 14-day Relative Strength Index (RSI) around 50 hints at balanced momentum rather than a strongly directional move.
On the upside, the primary barrier lies at the nine-day EMA of 1.1730, followed by the 12-week high of 1.1849, reached on April 17. A break above this level would support the pair to test the upper boundary of the ascending channel around 1.2040. Further advances above the channel would lead the pair to explore the region around 1.2082, the highest since June 2021, reached on January 27.
The EUR/USD pair is positioned on the lower ascending channel boundary, aligned with the 50-day EMA at 1.1697. Further declines will put downward pressure on the pair to navigate the region around the nine-month low of 1.1411, recorded on March 13.
(The technical analysis of this story was written with the help of an AI tool.)
Euro Price Today
The table below shows the percentage change of Euro (EUR) against listed major currencies today. Euro was the strongest against the New Zealand Dollar.
| USD | EUR | GBP | JPY | CAD | AUD | NZD | CHF | |
|---|---|---|---|---|---|---|---|---|
| USD | -0.04% | -0.05% | -0.03% | -0.01% | 0.02% | 0.06% | -0.06% | |
| EUR | 0.04% | -0.03% | 0.00% | 0.03% | 0.00% | 0.06% | -0.02% | |
| GBP | 0.05% | 0.03% | 0.02% | 0.06% | 0.06% | 0.09% | 0.03% | |
| JPY | 0.03% | 0.00% | -0.02% | -0.01% | 0.03% | 0.06% | -0.05% | |
| CAD | 0.01% | -0.03% | -0.06% | 0.00% | 0.04% | 0.06% | 0.00% | |
| AUD | -0.02% | 0.00% | -0.06% | -0.03% | -0.04% | 0.05% | -0.00% | |
| NZD | -0.06% | -0.06% | -0.09% | -0.06% | -0.06% | -0.05% | -0.07% | |
| CHF | 0.06% | 0.02% | -0.03% | 0.05% | -0.00% | 0.00% | 0.07% |
The heat map shows percentage changes of major currencies against each other. The base currency is picked from the left column, while the quote currency is picked from the top row. For example, if you pick the Euro from the left column and move along the horizontal line to the US Dollar, the percentage change displayed in the box will represent EUR (base)/USD (quote).
British Pound hovers ahead of UK GDP data, awaits Trump-Xi meeting updates
- GBP/USD steadies as traders await preliminary Q1 UK Gross Domestic Product data due on Thursday.
- Traders also await further news on the ongoing Trump-Xi meeting in Beijing.
- US wholesale inflation reached a post-2022 peak in April, as the Producer Price Index surged to a 6.0% annual rate.
GBP/USD holds ground following three days of losses, trading around 1.3520 during the Asian hours on Thursday. Traders await the preliminary UK Gross Domestic Product (GDP) for the first quarter of 2026, along with Industrial and Manufacturing Production data due later in the day.
The GBP/USD pair holds ground as the US Dollar (USD) remains firm on market caution as traders await further updates amid the ongoing meeting between US President Donald Trump and Chinese President Xi Jinping in Beijing. Traders will also shift their focus to the US Retail Sales report for April due later in the day.
As the world’s two largest economies attempt to stabilize their relationship, they are reportedly considering a framework to reduce tariffs on roughly $30 billion worth of goods, excluding those tied to national security.
However, geopolitical tensions remain a major factor. The US-China summit has taken place against the backdrop of the war in Iran. Washington has recently increased pressure on Tehran by imposing new sanctions on entities involved in selling Iranian oil to China and threatening banks that facilitate those transactions.
The US Bureau of Labor Statistics reported on Wednesday that wholesale inflation hit its highest level since late 2022. The Producer Price Index (PPI) surged to 6.0% year-over-year in April, up from 4.3% in March and well above the 4.9% expected by the market. On a monthly basis, PPI rose 1.4%, doubling the previous month’s 0.7% and far exceeding the anticipated 0.5% increase.

Australian Dollar weakens to near 0.7250, Trump–Xi talks in focus
- AUD/USD softens to around 0.7250 in Thursday’s Asian session.
- US producer prices surprise with the largest rise in four years.
- Trump will hold a high-stakes meeting with Xi Jinping in China.
The AUD/USD pair loses ground to near 0.7250 during the Asian trading hours on Thursday. Hotter-than-expected US inflation data provide some support to the US Dollar (USD) against the Australian Dollar (AUD). Traders will closely monitor the US President Donald Trump-Chinese President Xi Jinping summit in Beijing, and the release of the US April Retail Sales data later on Thursday.
US producer prices posted their biggest increase in four years in April, underpinning the Greenback. Data released by the US Bureau of Labor Statistics on Wednesday revealed that the US Producer Price Index (PPI) jumped 6.0% YoY in April, compared to the 4.3% prior. On a monthly basis, the PPI inflation rose to 1.4% in April from 0.7% in March and much higher than the estimate of 0.5%.
Traders will take more cues from the US Retail Sales report on Thursday. The market expects the Retail Sales to show an increase of 0.5% MoM in April, compared to 1.7% in March. Any signs of hotter inflation reports could boost the USD and act as a headwind for the pair.
Bloomberg reported on Wednesday that Trump arrived in Beijing for a state visit to China, where he will meet with Xi Jinping to discuss topics including trade and the Iran war. This is the first state visit to China by a US leader in nine years. Any positive developments surrounding the US-China talks could lift the China-proxy Aussie as China is a major trading partner to Australia.

Japanese Yen holds steady ahead of Trump–Xi summit, US Retail Sales data
- USD/JPY flat lines around 157.85 in Thursday’s early Asian session.
- US inflation came in hotter than expected, with the PPI rising by 6.0% YoY in April.
- Trump will hold a high-stakes meeting with Xi Jinping in China.
The USD/JPY pair trades on a flat note near 157.85 during the early Asian session on Thursday. The major pair steadies as traders prefer to wait on the sidelines ahead of the US President Donald Trump-Chinese President Xi Jinping summit in Beijing and the release of the US April Retail Sales data later on Thursday.
The latest US inflation data came in hotter than expected, fueling expectations that the US Federal Reserve (Fed) will maintain elevated long-term interest rates. This, in turn, could underpin the US Dollar (USD) against the Japanese Yen (JPY).
The US Producer Price Index (PPI) jumped 6.0% YoY in April, following the 4.3% seen in March, according to the US Bureau of Labor Statistics on Wednesday. On a monthly basis, the PPI inflation rose to 1.4% in April from 0.7% in March and much higher than the estimate of 0.5%.
Bloomberg reported on Wednesday that Trump arrived in Beijing for a state visit to China, where he will meet with Xi Jinping to discuss topics including trade and the Iran war. This is the first state visit to China by a US leader in nine years.
Nonetheless, the potential upside for the pair might be limited amid fears of further currency intervention from Japanese authorities. Japan’s Finance Minister Satsuki Katayama said last week that “regarding recent currency moves, we confirmed that Japan and the US have been coordinating very well and have maintained close communication.”

Canadian Dollar moves little as traders adopt caution ahead of US-China summit
- USD/CAD remains steady as traders await the high-stakes Trump-Xi summit.
- Trump and Xi may lower tariffs on $30 billion of non-sensitive goods, excluding items vital to national security.
- The commodity-linked CAD may weaken as falling oil prices reduce demand for Canada’s primary export.
USD/CAD remains calm after six days of gains, trading around 1.3700 during the Asian hours on Thursday. The pair stays silent as the US Dollar (USD) moves little as market caution prevails ahead of a pivotal summit in Beijing between US President Donald Trump and Chinese President Xi Jinping. Traders will also shift their focus to the US Retail Sales report for April due later in the day.
As the world’s two largest economies attempt to stabilize their relationship, they are reportedly considering a framework to reduce tariffs on roughly $30 billion worth of goods, excluding those tied to national security. However, geopolitical tensions remain a major factor. The summit is taking place against the backdrop of the war in Iran. Washington has recently increased pressure on Tehran by imposing new sanctions on entities involved in selling Iranian oil to China and threatening banks that facilitate those transactions.
On Wednesday, the US Bureau of Labor Statistics (BLS) reported that wholesale inflation hit its highest level since late 2022. The Producer Price Index (PPI) surged to 6.0% year-over-year (YoY) in April, up from 4.3% in March and well above the 4.9% expected by the market. On a monthly basis, PPI rose 1.4%, doubling the previous month’s 0.7% and far exceeding the anticipated 0.5% increase.
The USD/CAD pair may regain its ground as the commodity-linked Canadian Dollar (CAD) may lose ground amid lower oil prices, given Canada’s status as the largest crude exporter to the United States (US).
However, Oil supply concerns also loom over the market as the US Energy Information Administration (EIA) stated that crude and fuel flows through the Strait of Hormuz dropped by nearly 6 million barrels per day in the first quarter following the outbreak of the Middle East conflict in late February.

Offshore Yuan Holds Firm on Trump-Xi Summit
The offshore yuan traded around 6.78 per dollar, holding near its strongest level since February 2023 as investors closely watched a high-stakes summit between US President Donald Trump and Chinese President Xi Jinping aimed at stabilizing relations between the world’s two largest economies. Trump arrived in Beijing on Wednesday and is set to meet Xi at the Great Hall of the People for talks covering a range of contentious issues. Trump is expected to urge Beijing to help facilitate the reopening of the Strait of Hormuz through its ties with Tehran, though he has downplayed the Iran conflict as a central topic, emphasizing trade and market access instead. Moreover, Trump has signaled that he will urge China to roll back barriers facing American companies and further “open up” its economy. The summit, delayed for weeks amid tensions tied to the Iran conflict, is being closely watched by markets for signs of a diplomatic breakthrough that could shape US-China relations and global trade.
