MUFG’s Asia FX Weekly highlights that China’s July activity indicators, following weak Q2 GDP, will be central for the Chinese Yuan and regional FX. The authors stress ongoing weakness in fixed asset investment and property-sector challenges, and question whether domestic demand is stabilizing and whether PBOC will tolerate continued CNY strength. They also note PBOC has been guiding USD/CNY lower via its daily fixing.
China data and fixing steer CNY
“In China, attention will centre on July activity indicators, following a weak Q2 GDP print.”
“Fixed asset investment is likely to remain weak, underscoring ongoing challenges in the property sector.”
“The key question for FX markets is whether domestic demand shows signs of stabilization and whether PBOC is comfortable allowing continued strength in CNY.”
“Any weaker-than-expected Chinese activity data could weigh on regional
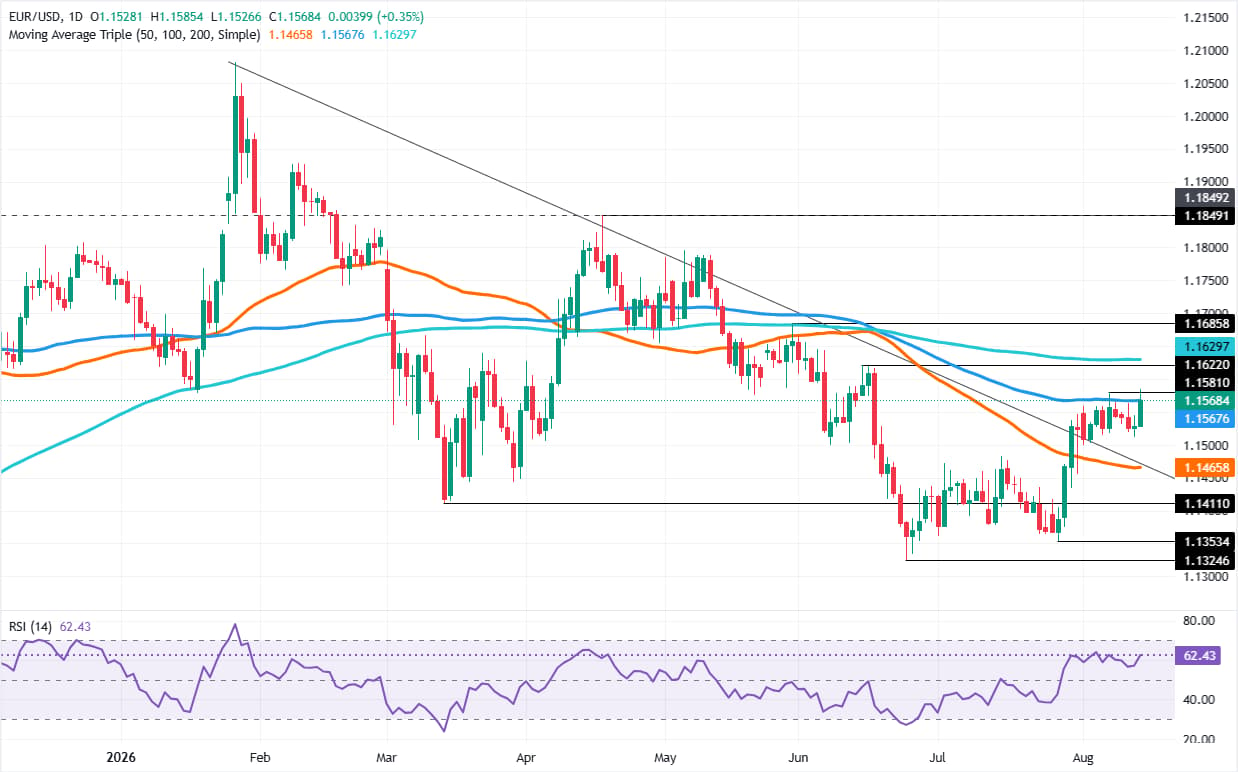
EUR/USD rebounds from daily lows, challenging 100-day SMA resistance.
Bullish RSI raises reversal risk after reclaiming 1.1500.
Break above 1.1629 exposes 1.1685 and 1.1700 next.
The EUR/USD pair registers gains of over 0.32% on Friday as traders face key resistance at the 100-day Simple Moving Average (SMA) at 1.1567, as bulls eye the 1.1600 psychological figure. At the time of writing, the pair trades at 1.1564 after bouncing off daily lows of 1.1526.
EUR/USD Price Forecast: Technical Outlook
The EUR/USD market structure suggests that the downtrend remains intact. The successive lower highs and lower lows have been respected, but since July 30, when the pair reclaimed the 1.1500 area, the risk of a bullish reversal has increased.
Although the pair topped around 1.1550-60, the Relative Strength Index (RSI) suggests bullish momentum is building. That said, EUR/USD might turn bullish if traders clear key resistance levels.
Upwards, the 200-day SMA at 1.1629 is the next area of interest. Once surpassed, the next cycle high pending is the May 29 high at 1.1685. If those two levels are removed, EUR/USD could be headed toward 1.1700, putting the April 17 high at 1.1849 into play ahead of the 1.1900 area.
On the flip side, if the shared currency drops below 1.1500, a move to the 50-day SMA at 1.1465 is on the cards. The next demand zone would be 1.1400.
Commerzbank notes that the Kospi has rebounded 29.5% from its 30 July low, supported by strong tech earnings and improved sentiment toward semiconductor and memory chipmakers. They note USD/KRW has retreated nearly 8.9% from its July high as exporters’ repatriation and foreign portfolio inflows bolster the Korean Won. Despite a modest 0.3% rise to 1,421 on a stronger Dollar, KRW is the second-strongest Asian currency this year, up 1.5% versus USD and outperforming the regional ex-Japan average of -2.1%. Further volatility moderation in equities may offer near-term KRW support.
USD/KRW retreats from July peak
“The South Korean equity benchmark Kospi rose 3.6% yesterday, following a 3.7% rally on Wednesday. The index has now rebounded by 29.5% from its 30 July low. The recovery was driven by strong tech earnings, which boosted market sentiment toward semiconductor names and lifted South Korean chipmakers.”
“This combination of recovering semiconductor sentiment and easing Kospi volatility has enticed foreign investors to re-enter the market. Since 30 July, foreign investors have net bought USD1.9bn of South Korean equities. A further moderation in volatility could support additional portfolio inflows and provide near-term support for the KRW.”
“USD/KRW rose 0.3% to 1,421 yesterday, driven by a stronger USD. Nonetheless, the pair has fallen by nearly 8.9% from its July high of 1,559, as exporters’ repatriation activity and foreign portfolio inflows continue to support the KRW.”
“Year-to-date, KRW is up 1.5% vs the USD, well above the average for Asian currencies ex-Japan of -2.1%.”
Societe Generale analysts highlight CNY’s firm trend, with the currency advancing to 6.7424, its strongest level since February 2023, on Dollar weakness and lower US yields. The PBoC reiterates an accommodative stance and targeted support while avoiding explicit rate or RRR cut signals, as 10-year CGB yields fall below 1.70%.
Policy support underpins currency strength
“CNY maintains steady appreciation path: The CNY advanced to 6.7424 today, its strongest level since February 2023, supported by broad-based dollar weakness and lower US yields.”
“In its latest quarterly monetary policy implementation report, the PBoC reiterated its commitment to maintaining an appropriately accommodative policy stance and deploying targeted support measures when needed, while stopping short of explicitly signalling policy rate or RRR cuts.”
“Chinese bonds continue to demonstrate notable resilience, with the 10y CGB yield falling below 1.70% for the first time in a year after the PBoC’s first mid-month overnight reverse repo (liquidity injection).”
“Separately, the Ministry of Finance successfully sold 50y special sovereign bonds at an average yield of 2.2831%.”
USD/MXN rebounds from 16.97 as buyers defend 17.00.
Weak Retail Sales and sentiment deepen US Dollar pressure.
Banxico minutes and Mexico Retail Sales drive next catalysts.
USD/MXN refreshed 24-month lows below 17.00 on Friday, but it has recovered some ground, with buyers stepping in and reclaiming the 17.00 level. Data from the United States (US) weighed on the Greenback, as consumer sentiment and Retail Sales deteriorated. The pair trades at 17.02, after bouncing off daily lows of 16.97.
USD/MXN holds near two-year lows as traders price out Fed hikes
US data proved benign on the inflation front, with consumer and producer prices edging lower. The Nonfarm Payrolls reading on August 7 and jobless claims on Thursday paint a picture of ‘some’ softening, but give Federal Reserve officials no reason to say labor market risks are tilted to the upside.
On Friday, Retail Sales disappointed investors, contracting 0.6% MoM, below forecasts of a 0.1% expansion, and June’s 0.2%. The University of Michigan Consumer Sentiment preliminary reading in August showed some deterioration in sentiment among American households, as the Index dipped from 55.2 to 51, while inflation expectations remained little changed.
The backdrop prompted an aggressive pricing out for a Fed rate hike in 2026. For the September meeting, the odds are 32% for a hike and 68% for keeping interest rates steady.
In Mexico, Economy Secretary Marcelo Ebrard stated that Mexico is asking the US to eliminate or reduce tariffs on the automobile industry. He argued that vehicles made in Japan, South Korea, Germany, or Morocco pay a 15% tariff, while those in Mexico face a 25% tariff.
“So, give me a discount, because I buy more parts of the United States from you than the other countries, I just mentioned”, Ebrard said.
Next week, Mexico’s economic schedule will be busy, with investors eyeing the release of the Bank of Mexico’s (Banxico) last meeting minutes and Retail Sales data. In the US, the docket will feature housing data, the ADP Employment Change 4-week average, jobless claims and Flash PMIs.
USD/MXN Price Forecast: Technical outlook
USD/MXN daily chart
In the daily chart, USD/MXN trades near 17.0294, extending its slide beneath the clustered simple moving averages in the Moving Average Triple around 17.3775. Price action remains capped by the more recent descending resistance trend line, which comes in near 17.4197, while the Relative Strength Index (14) sits around 27 and drifts into oversold territory, hinting that bearish pressure is stretched but still dominant as long as the pair holds below these overhead barriers.
On the downside, the next notable structural floor aligns with the earlier downtrend break level around 15.6176, which acts as a distant but important support reference should the decline deepen. On the topside, a recovery would first need to reclaim the Moving Average Triple resistance near 17.3775, followed by a clearer break above the descending resistance trend line at 17.4197 to ease the bearish bias and open the way for a more sustained corrective rebound.
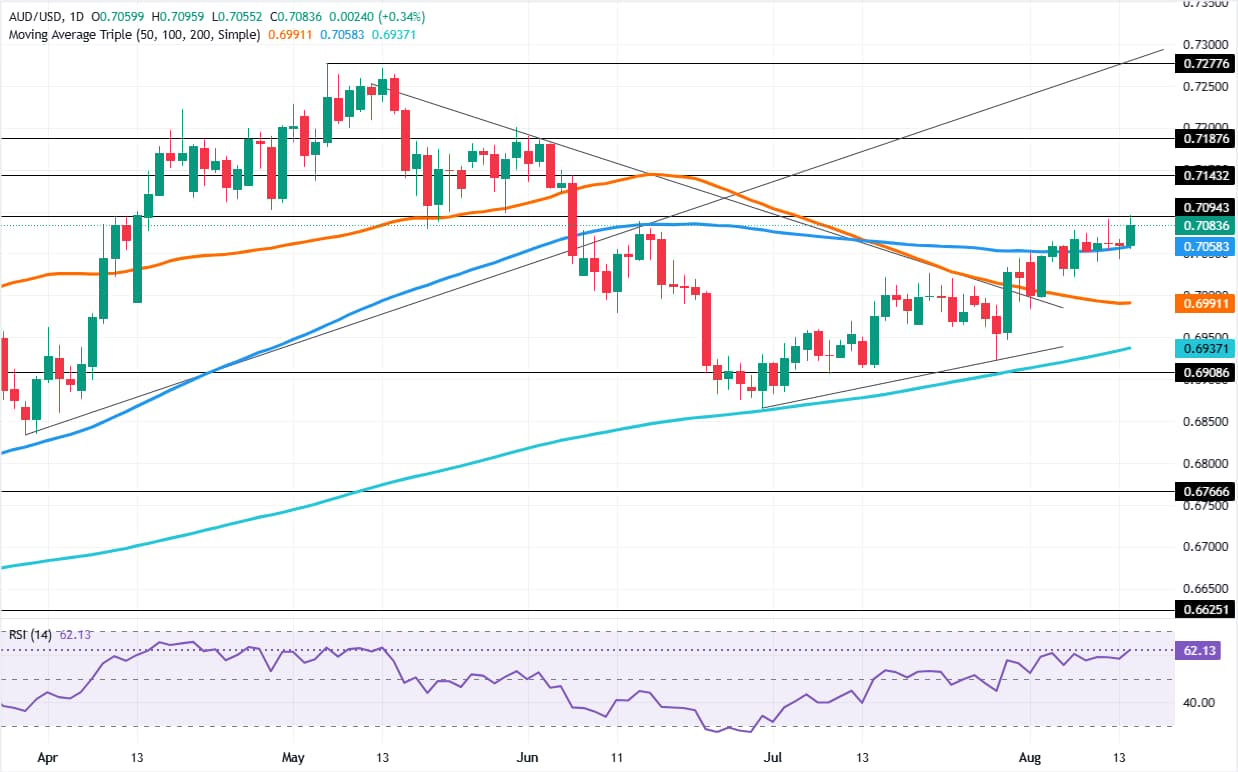
AUD/USD gains as weak Retail Sales pressure the Greenback.
Bullish RSI supports upside, but 0.7094 caps momentum.
Break above 0.7100 exposes 0.7190 and 0.7200 next.
The Australian Dollar advanced on Friday after US Retail Sales disappointed investors, increasing speculation that the Federal Reserve might not raise rates, as the economy showed tentative signs of weakness. The AUD/USD trades at 0.7083, up 0.34%
AUD/USD Price Forecast: Technical outlook
The daily chart shows the AUD/USD is bullish, but buyers remain unable to decisively crack the January 29 high of 0.7094, which could open the door for further upside. Momentum shifted bullish since mid-July, as depicted in the Relative Strength Index (RSI).
From a market structure perspective, the pair has not shifted bullish until buyers regain the June 1 peak at 0.7190. Hence, the first AUD/USD resistance is 0.7100, followed by the latter. On further strength, the next stop is 0.7200.
On the downside, the 100-day Simple Moving Average (SMA) at 0.7058 is the first support. Once cleared, the 50-day SMA emerges as the next demand zone at 0.6991, followed by the 200-day SMA at 0.6937.
USD/CAD trades lower as the Canadian Dollar gains.
The US and Canada are close to reaching a deal before the tariff deadline.
Investors expect the Fed to leave policy rates unchanged again in September.
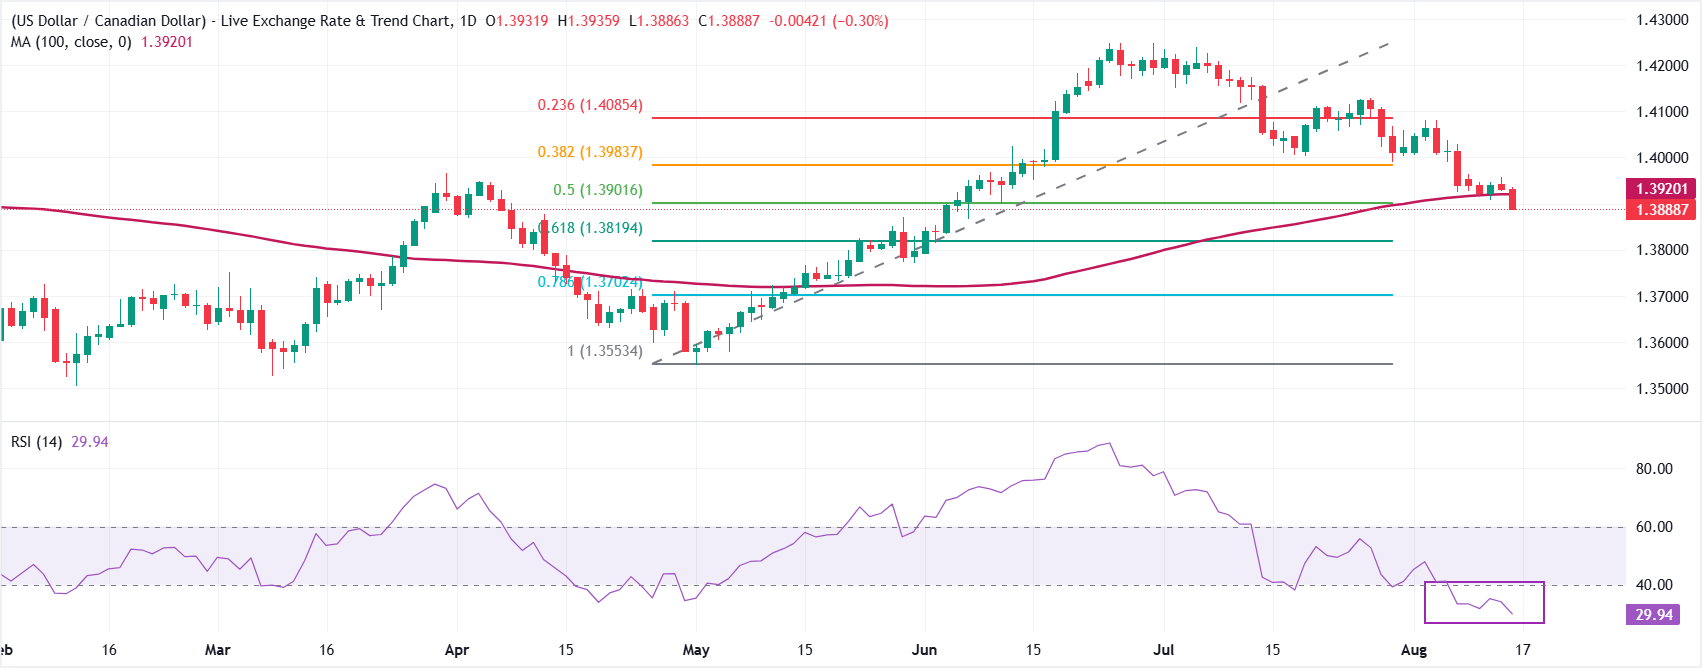
The Canadian Dollar (CAD) outperforms a majority of its currency peers on Friday, with the USD/CAD pair trading 0.32% lower at around 1.3888. The Canadian currency gains on hopes of a United States (US)-Canada interim deal.
A Canadian government source directly familiar with trade negotiations with the United States said on Thursday that talks were progressing well and Washington also wanted an agreement before a new US tariff deadline on August 19, Reuters reports.
Meanwhile, weakness in the US Dollar due to receding fears of a Federal Reserve (Fed) interest rate hike in the September meeting has also weighed on the Loonie pair. At press time, the US Dollar Index (DXY), which gauges the Greenback’s value against six major currencies, trades 0.23% lower to near 99.70.
Fed patience holds as US inflation trend improves but remains above target
Analysts at Wells Fargo observe that “inflation remains elevated, but the trend is improving,” noting that “while inflation remains above target, the recent upturn appears narrow rather than broad-based.” Against this backdrop, they judge that “the Fed remains stuck on hold,” with policymakers reluctant to shift policy until they see clearer evidence that price pressures are durably contained.
Commerzbank’s Bernd Weidensteiner similarly highlights that the inflation data for July “indicated only moderate inflationary pressure; consumer prices excluding food and energy rose by 0.2% from the previous month, while the year-over-year rate fell slightly to 2.5%.” He adds that, although this outcome was broadly in line with expectations, “these figures, combined with the unexpectedly weak jobs data, eased the pressure on the Fed to raise its key interest rates anytime soon.” Together, the banks’ commentary underscores a picture of gradually improving but still above-target US inflation, reinforcing the case for the Fed to remain on hold for now.
USD/CAD Technical Analysis
USD/CAD trades lower at around 1.3888, keeping a bearish near‑term tone as spot holds under the 100‑day simple moving average (SMA) at 1.3920 and the 50.0% Fibonacci retracement at 1.3902. The pair has retreated from recent highs toward the middle of the prior upswing range, while the Relative Strength Index (14) at 29.95 slips into oversold territory, hinting that downside momentum is stretched but not yet reversed.
On the topside, immediate resistance is located at the 50.0% retracement of the latest move at 1.3902, followed by the 100‑day SMA at 1.3920; a sustained break above this band would ease the current bearish pressure and expose the 38.2% level at 1.3984 and then the 23.6% retracement at 1.4085. On the downside, initial support is seen at the 61.8% Fibonacci retracement at 1.3819, ahead of the 78.6% level at 1.3702, while deeper losses would bring the structural swing low region near the 100.0% retracement at 1.3553 into focus.
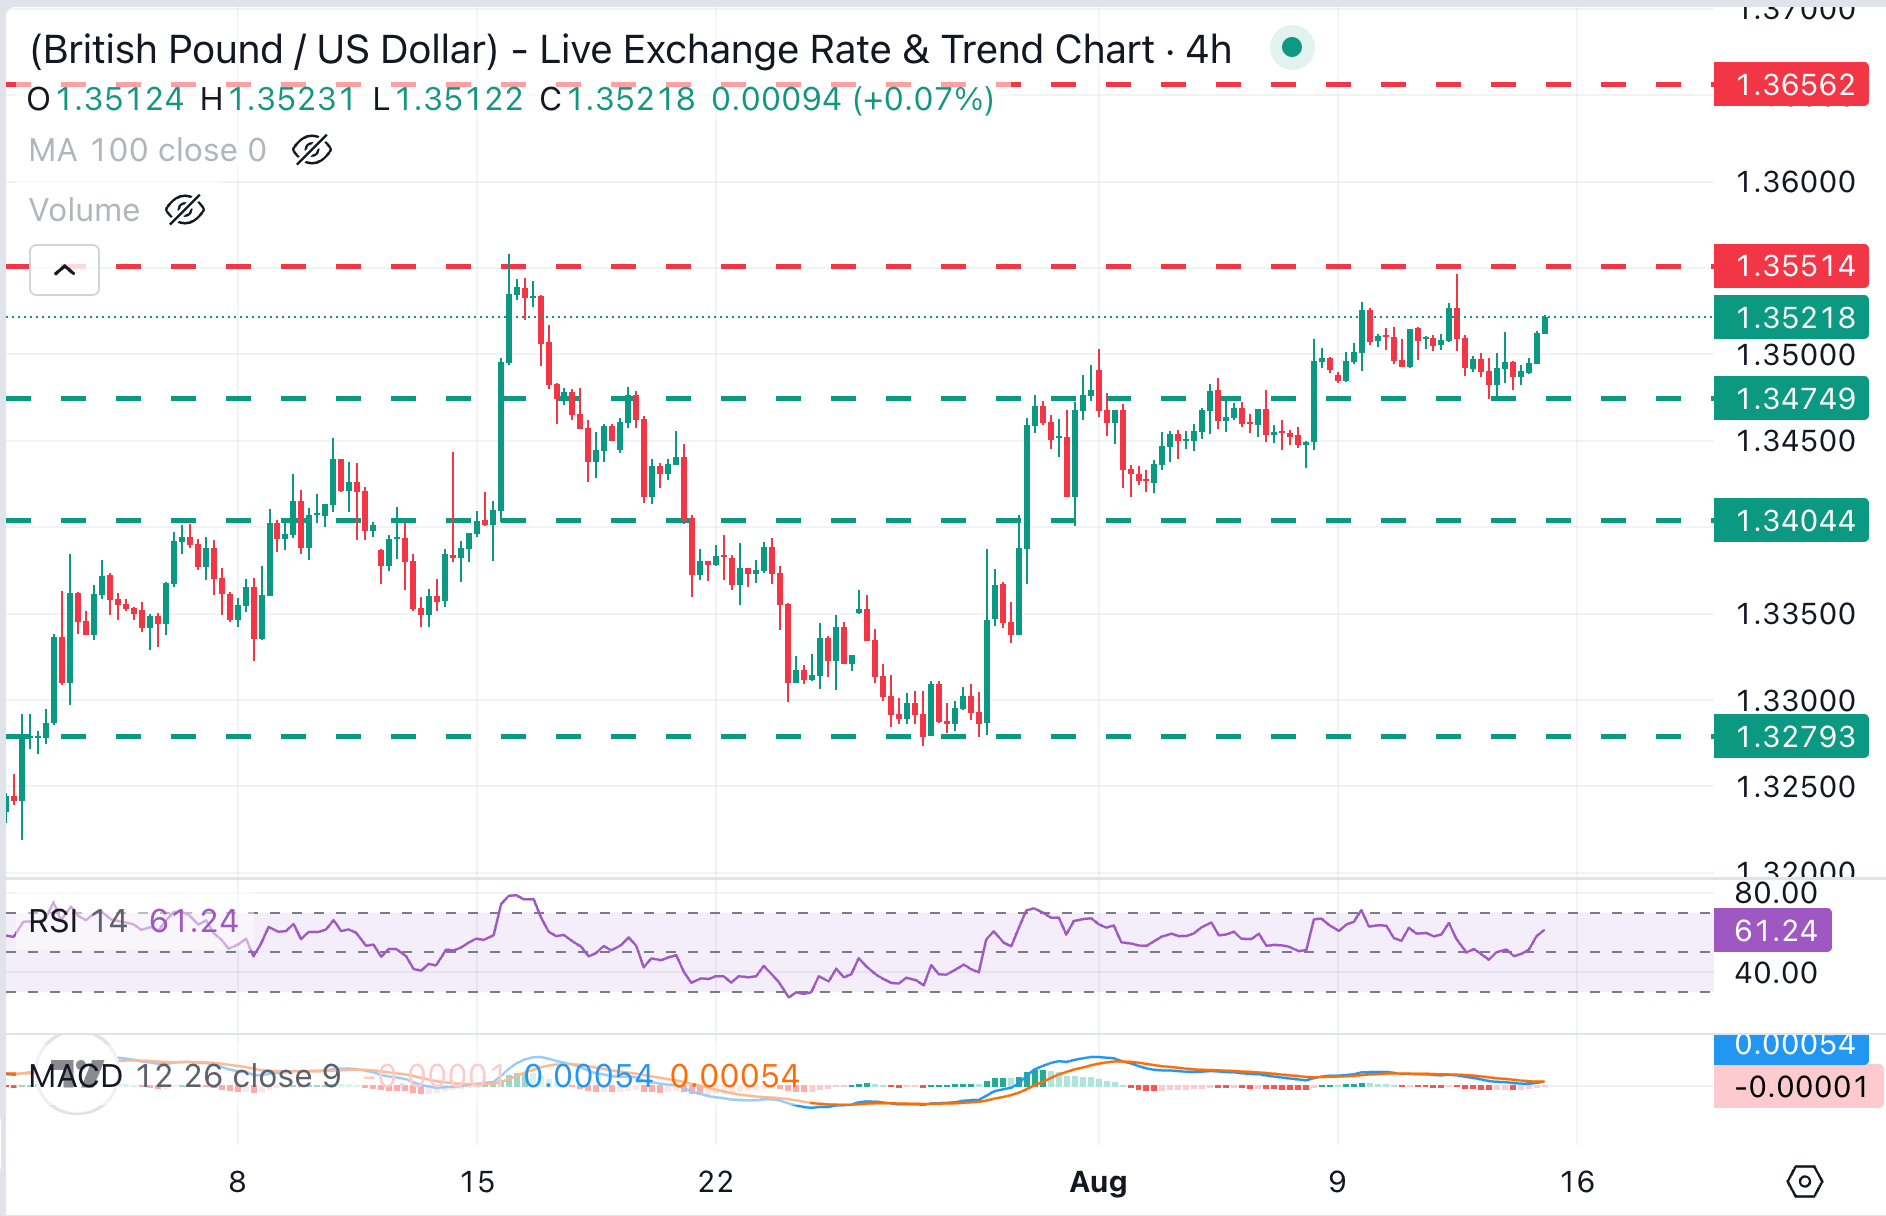
British Pound picks up above 1.3500 against the US Dollar, after bouncing off lows at 1.3474 .
The US Dollar struggles on Friday as a run of soft inflation data has pushed back hopes of immediate Fed rate hikes.
Later today, the US Retail Sales and Michigan Consumer Sentiment Index data will provide further insight about the US economic outlook
The British Pound (GBP) pares losses against a weaker US Dollar (USD) on Friday, as a run of soft US inflation figures and growing signs of labour market deterioration have cast doubt about the odds for an immediate Federal Reserve (Fed) rate hike. The GBP/USD has returned to the 1.3520 area from Thursday’s lows at 1.3474, inching towards a key resistance around 1.3550.
The focus on Friday is on the US Retail Sales, which are expected to show a 0.1% uptick in July, after a 0.2% gain in June, alongside the University of Michigan survey, which is foreseen to be little changed in August.
FX Strategists at ING state that these are “second-tier releases” that would “likely need to deliver significant surprises to trigger a meaningful dollar reaction,” reinforcing the sense that, absent a major data shock, the Dollar is unlikely to break decisively from its current, relatively stable trading pattern.
Technical Analysis: Key resistance is at the 1.3550 area
GBP/USD trades at 1.3520 at the time of writing, trapped within the weekly trading range, with key resistance area around 1.3550. Momentum indicators show an incipient bullish traction with the 4-hour Relative Strength Index (14) above 60, yet with the Moving Average Convergence Divergence (MACD) indicator flat near the zero line, which suggests that the move is far from impulsive.
Pound bulls would need to confirm above the July 15 and August 12 highs, around 1.3550, to resume their broader bullish trend, aiming for a retest of the early May highs in the mid-range of the 1.3600s.
Downside attempts, on the other hand, have been contained at Thursday’s low of 1.3474, ahead of the previous week’s trading bottom, just above 1.3400. Further down, there is no clear support until the July 27 low, at 1.3273.
To provide the best experiences, we use technologies like cookies to store and/or access device information. Consenting to these technologies will allow us to process data such as browsing behavior or unique IDs on this site. Not consenting or withdrawing consent, may adversely affect certain features and functions.
Functional
Always active
The technical storage or access is strictly necessary for the legitimate purpose of enabling the use of a specific service explicitly requested by the subscriber or user, or for the sole purpose of carrying out the transmission of a communication over an electronic communications network.
Preferences
The technical storage or access is necessary for the legitimate purpose of storing preferences that are not requested by the subscriber or user.
Statistics
The technical storage or access that is used exclusively for statistical purposes.The technical storage or access that is used exclusively for anonymous statistical purposes. Without a subpoena, voluntary compliance on the part of your Internet Service Provider, or additional records from a third party, information stored or retrieved for this purpose alone cannot usually be used to identify you.
Marketing
The technical storage or access is required to create user profiles to send advertising, or to track the user on a website or across several websites for similar marketing purposes.