In mid-2026, the attention of financial markets is focused on the de-escalation of the situation in the Middle East and the race for dominance in the artificial intelligence sector, although at the same time, there is more and more talk about a bubble rather than further development. Parallelly, however, a climatic phenomenon is developing in the equatorial belt of the Pacific Ocean that has the potential to destabilize global supply chains, hit the production of key commodities, and trigger another wave of food inflation. Meteorological data from mid-2026 indicates a rapid transition of the ocean from a neutral phase to an active El Niño.
Forecasts from the American Climate Prediction Center (CPC) and the World Meteorological Organization (WMO) set the probability of this phenomenon transforming into a so-called Super El Niño before the end of the year at a level of 60% to 67%. If these forecasts materialize, the upcoming episode from the turn of 2026 and 2027 could become one of the strongest thermal anomalies recorded since 1950. How, then, should one react in market terms?
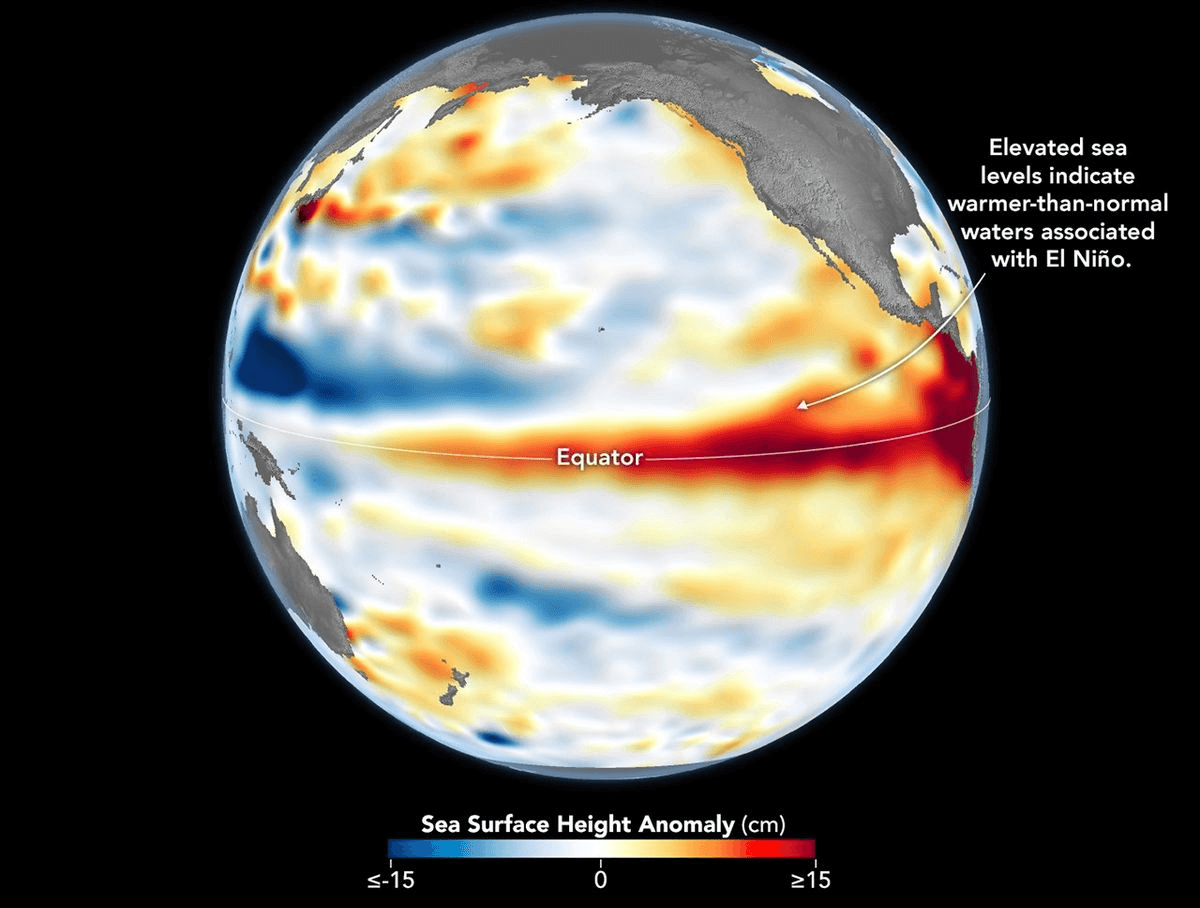
Graphic representing the height of the Pacific surface, which also coincides with water temperatures. Source: NASA
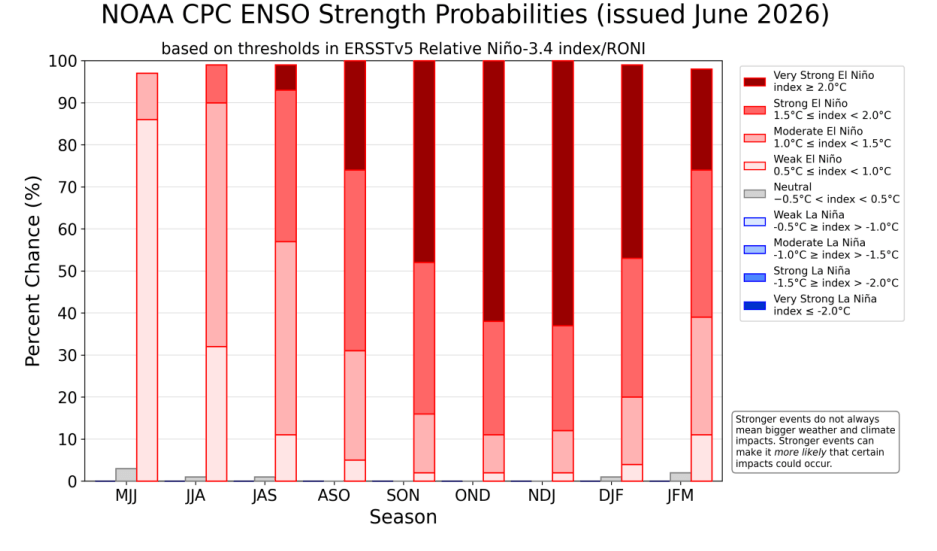
NOAA predicts over 60% probability of a Super El Niño occurring at the turn of 2026 and 2027. Source: NOAA
Physics and Climatology of ENSO: From Walker Circulation to the Implementation of the RONI Index Normal Situation
Understanding the economic mechanism of El Niño requires an analysis of the physical processes occurring in the atmosphere and hydrosphere of the Pacific. Under neutral conditions, constant winds, called trade winds, blow from east to west, pushing sun-warmed surface waters toward Southeast Asia and Indonesia. This causes a physical accumulation of water off the coast of Asia, where the sea level is about 0.5 meters higher than off the coast of South America. Simultaneously, intense upwelling occurs off the coast of Peru and Ecuador, which is the rising of cold, oxygen- and nutrient-rich waters from the ocean floor, fueling local ecosystems and allowing for massive fish catches.
El Nino
During the El Niño phase, the trade winds weaken, and sometimes even reverse their direction. Warm water accumulated in the west begins to spill back to the east, raising the sea surface temperature off the coast of South America by 1 to even 3 degrees Celsius, although most often 2 degrees are already treated as a very serious disturbance to the entire ecosystem. This process completely flattens the thermocline and blocks the pushing of cold water to the surface. The resulting giant “heater” releases thermal energy into the atmosphere, which disrupts the Walker circulation, shifts storm tracks, triggers heavy rains in South America, and catastrophic droughts in Asia and Australia, partially also affecting the situation across the globe, including Africa, which is key in the case of cocoa crops.
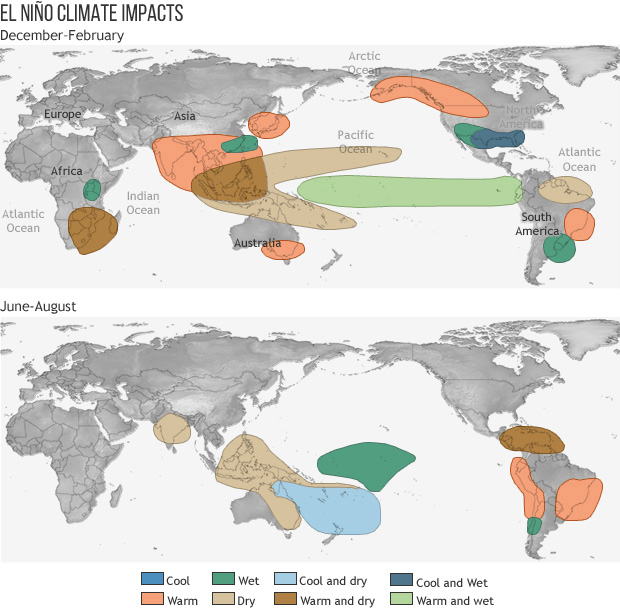
Weather conditions during El Niño. Source: NOAA
How to measure El Niño?
The traditional tool used to measure the strength of ENSO is the ONI (Oceanic Niño Index), calculated as a three-month moving average of sea surface temperature (SST) anomalies in the key Niño 3.4 region. A threshold of +0.5 signifies the formal occurrence of El Niño, a threshold of +1.5 defines a strong episode, and from the value of +2.0, the very strong zone begins, i.e., Super El Niño.
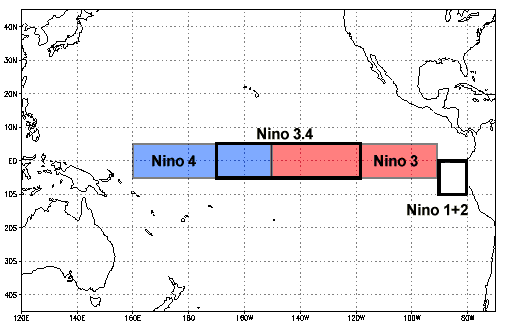
Key location where the El Niño phenomenon forms. Source: NOAA
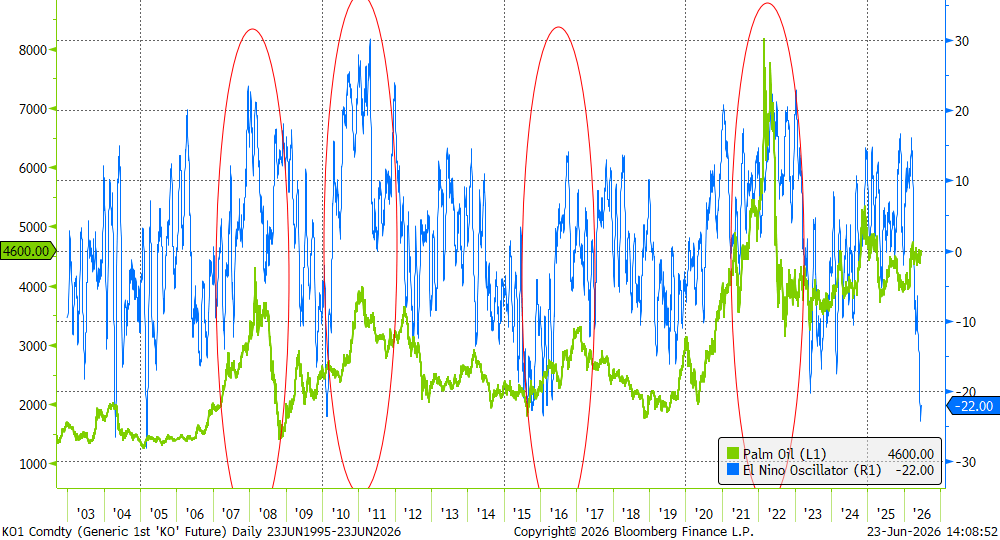
El Niño Oscillator index and palm oil prices. As can be seen, the index is currently clearly negative, indicating the absence of the phenomenon. However, this is usually a prelude to a later, stronger hit. Source: Bloomberg Finance LP Modern global warming significantly complicates the interpretation of ONI results. Record hot oceans worldwide mean that traditional indicators give misleading, inflated readings.
For example, the episode from 2023–2024 peaked according to the old methodology at +2.0, but due to a lack of stability in the anomaly, it was classified only as “strong.” For this reason, meteorological agencies in Australia (BOM), the USA (NOAA), and New Zealand implemented a new indicator – RONI (Relative Oceanic Niño Index). This index dynamically filters out the general planetary warming trend from the real, cyclic anomaly of the Pacific. It is RONI that confirms in mid-2026 that the approaching phenomenon is developing extremely fast, moving from a neutral phase into a strong strike. For comparison purposes, the table below presents the classification of historical episodes according to their maximum intensity measured by the ONI index.
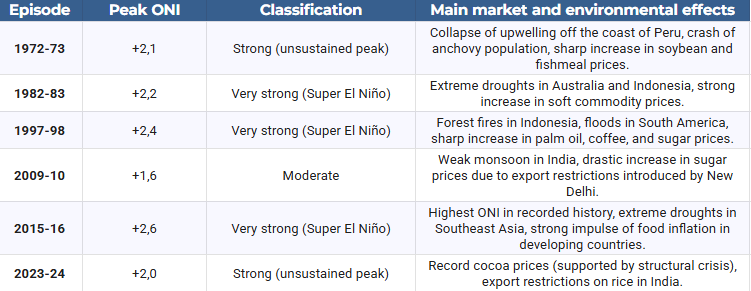
Source: own study based on NOAA
Impact on GDP and the Role of the “Conflict Multiplier”
The relationship between climate physics and financial markets has been precisely described in economic research, including those published by the European Central Bank (ECB). A strong El Niño phenomenon raises global prices for non-energy commodities (agricultural goods and metals) by an average of about 5%. Crucially for monetary policy, this effect persists in markets for 6 to even 16 months after the weather shock itself. This anomaly does not affect all economies in the same way, creating drastic discrepancies in GDP dynamics:
- Indonesia: Records an average GDP drop of 1% due to paralyzing droughts destroying agriculture and limiting coal and nickel mining.
- United States: Gains about 0.5% of GDP (which translates to over 150 billion dollars) thanks to milder winters in the north and more favorable rainfall in the agricultural belt in the south (lower gas consumption, higher yields).
- Thailand: May record a GDP growth of almost 1%, provided there is appropriate water resource management in agriculture.
On a global scale, the balance is decidedly negative. Losses resulting from lost productivity were estimated at nearly 5.7 trillion dollars for the 1997–1998 episode and over 7.8 trillion dollars for the phenomenon of 2015–2016. In mid-2026, the global economy is exceptionally vulnerable to these types of shocks due to elevated core inflation, shipping restrictions, and energy costs driven up by a previous conflict in Iran. The USDA forecasts a 4.7% increase in food prices in the USA in 2026, and for products based on sugar and cocoa, it indicates an increase of up to 8.4%. For this reason, the FAO and WFP launched a joint appeal for 202 million dollars for preventive actions in 22 priority countries.
Parallelly, drought caused by El Niño acts as a factor creating conflict. Model studies conducted by Bloomberg Economics indicate that a drastic drop in rainfall and loss of income from agriculture exacerbate competition for shrinking natural resources. Countries with low GDP per capita, high corruption, and weak institutions are particularly sensitive to this mechanism. Myanmar, Pakistan, and Nigeria are identified as countries with the highest risk of outbreaks or escalation of internal conflict in 2026. Conversely, in Latin America (Mexico, Colombia, Brazil), a prolonged lack of rainfall could overlap with existing tensions and escalate violence from drug cartels controlling water resources and rural territories.
El Niño and Key Soft Commodity Markets: Coffee and Cocoa
The coffee and cocoa markets are considered litmus tests for the strength of El Niño due to the geographical concentration of crops in the equatorial zone. In the years 2026–2027, this phenomenon overlaps with previous structural shortages, triggering powerful reshuffles in the pricing of futures contracts.
Cocoa: Threat to Main Harvests in West Africa and Disease Crisis in Ecuador
A popular market narrative assumes the simplification that El Niño means drought in West Africa, which will translate into an uncontrolled increase in cocoa prices. The reality, however, is more complex because the direct ENSO climate signal for Côte d’Ivoire and Ghana (accounting for nearly 60% of global supply) is weaker than for Asia. The historical price record from 2023–2024 resulted mainly from structural problems: a fertilizer crisis caused by war, a lack of investment in tree rejuvenation, and destructive Harmattan winds. In the second half of 2026, markets fear the superimposition of these structural weaknesses on weather anomalies. Three factors determine the current, pro-growth positioning of capital:
- Weak fruit setting: Early surveys on plantations in West Africa point to extremely low setting of young fruits (cherelles) for the 2026/2027 season, which heralds poor main harvests starting in October.
- Revision of the commodity balance: StoneX drastically cut its global cocoa surplus forecast for the 2026/2027 season to just 149,000 tons (compared to an estimated 267,000 tons in January). Conversely, Citigroup predicts a deep deficit of 56,000 tons in the 2026/2027 season. On the other hand, forecasts appeared that the current season might end with an oversupply as high as 400,000 tons, mainly due to weak demand.
- Demand destruction as a brake: A bearish counterweight is the high ICE-certified stocks (reaching nearly 2.9 million bags in June 2026) and a clear drop in cocoa processing (grinding) in Europe (down 7.8% year-on-year in the first quarter of 2026 – the lowest reading in 17 years) and North America (down 3.8% year-on-year).
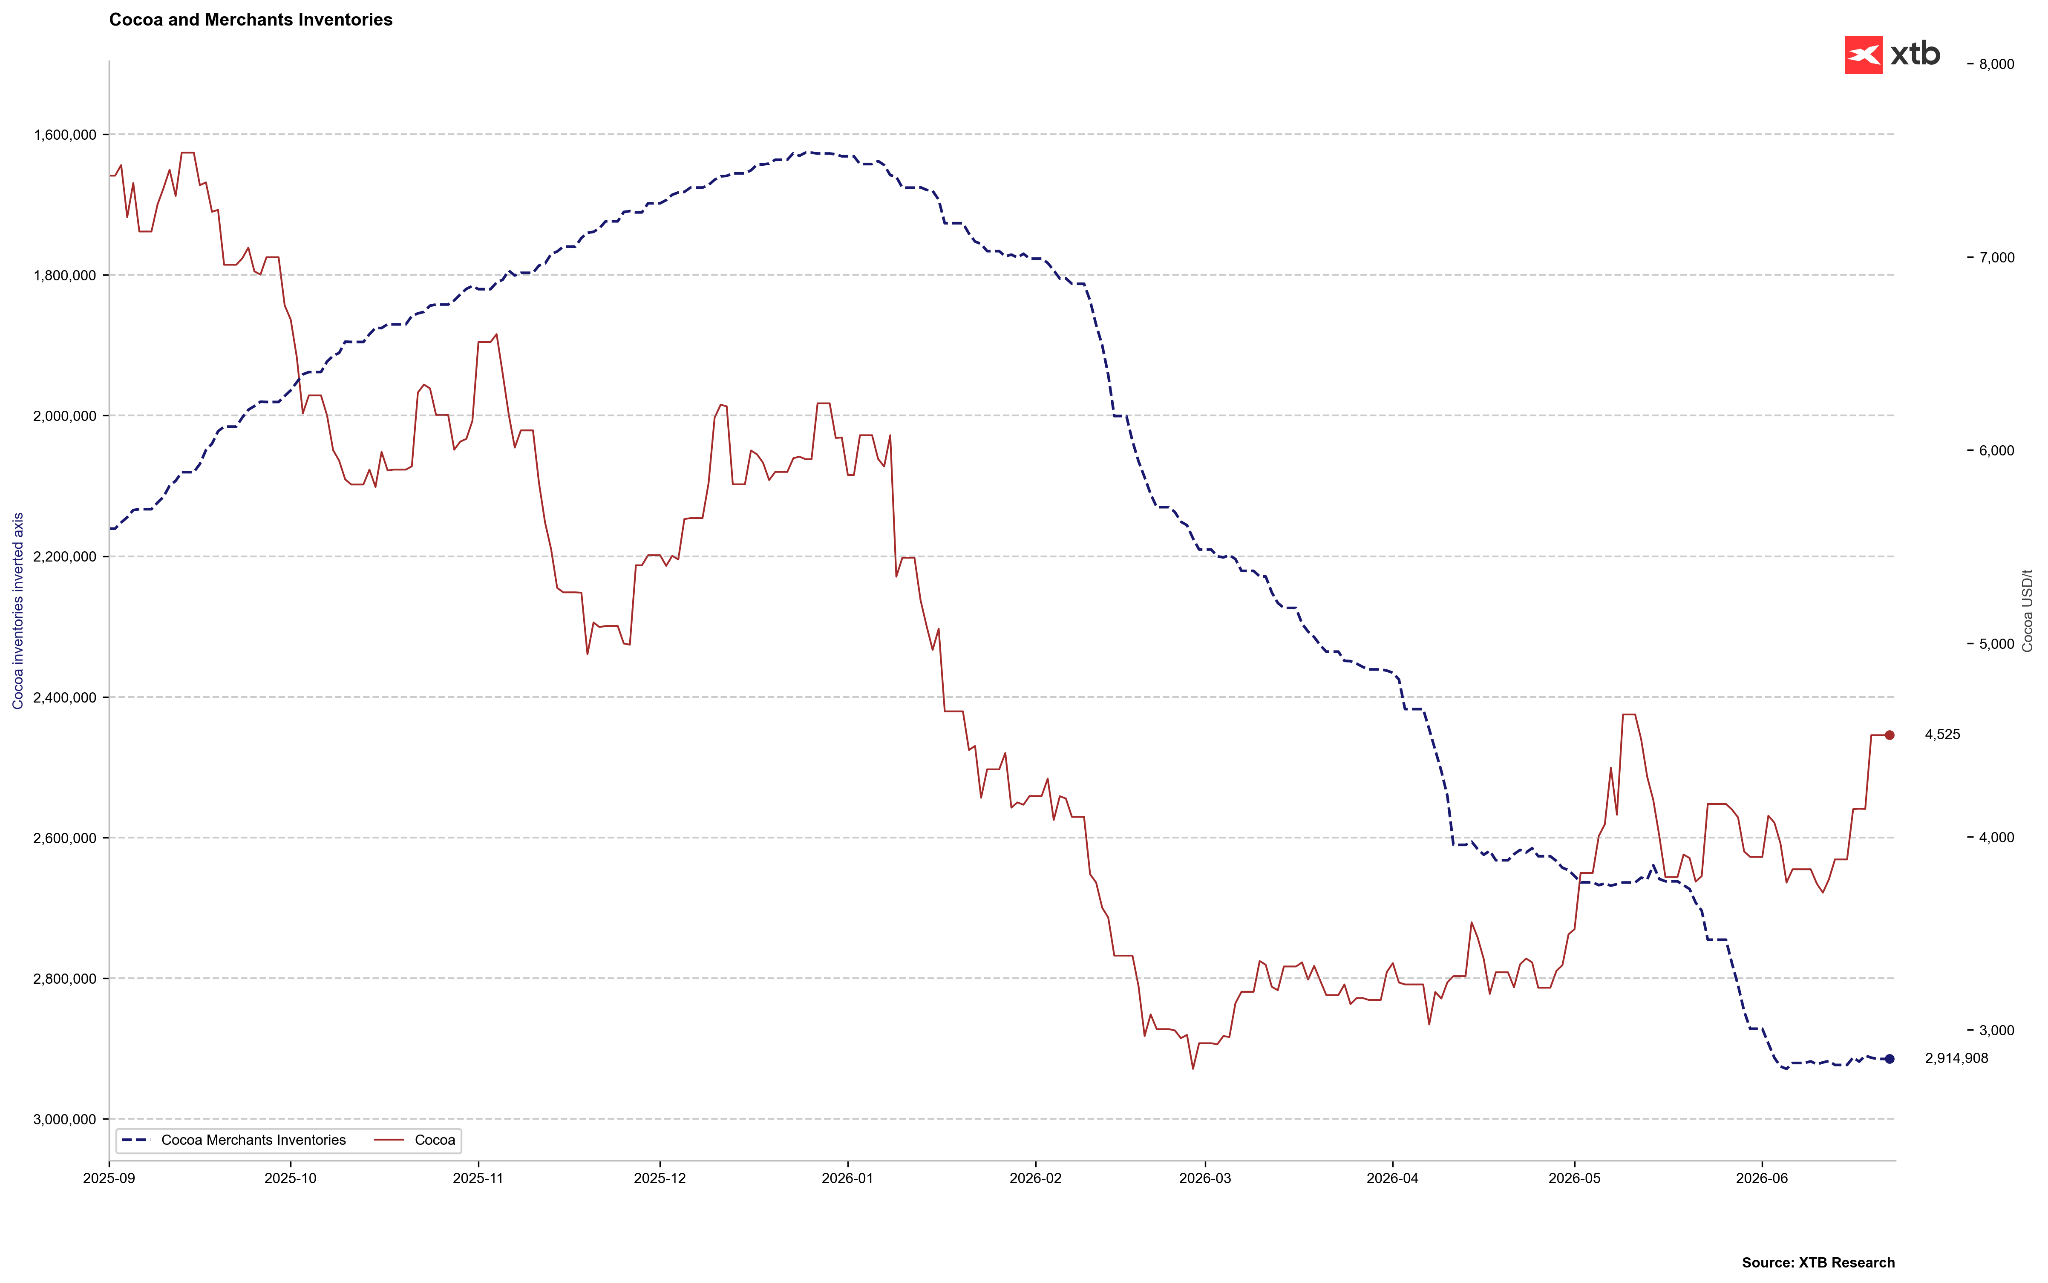
Cocoa stocks are at their highest in several years, though it is worth remembering that in 2023-2024 there was a massive contraction in stocks. We are now theoretically at the seasonal peak. If stocks start to grow, however, it could mean the scale of oversupply is larger than expected. Source: Bloomberg Finance LP, XTB
Despite weakening demand in developed countries, Citigroup predicts that due to Super El Niño, cocoa prices will permanently exceed the level of 5,000 dollars per ton in the next three months, with the potential to reach 6,000 dollars per ton on a 12-month horizon. An additional catalyst for increases is the situation in Ecuador (the world’s third-largest producer). El Niño brings heavy rains and floods there. Extreme humidity in the period from December 2026 to February 2027 creates ideal conditions for the spread of fungal diseases (such as moniliasis or black pod rot), which directly destroys crops and prevents traditional sun-drying of harvested beans. Ecuador recently aspired to second place in terms of production, but due to its own problems, it will likely remain in third place, just behind Ghana.
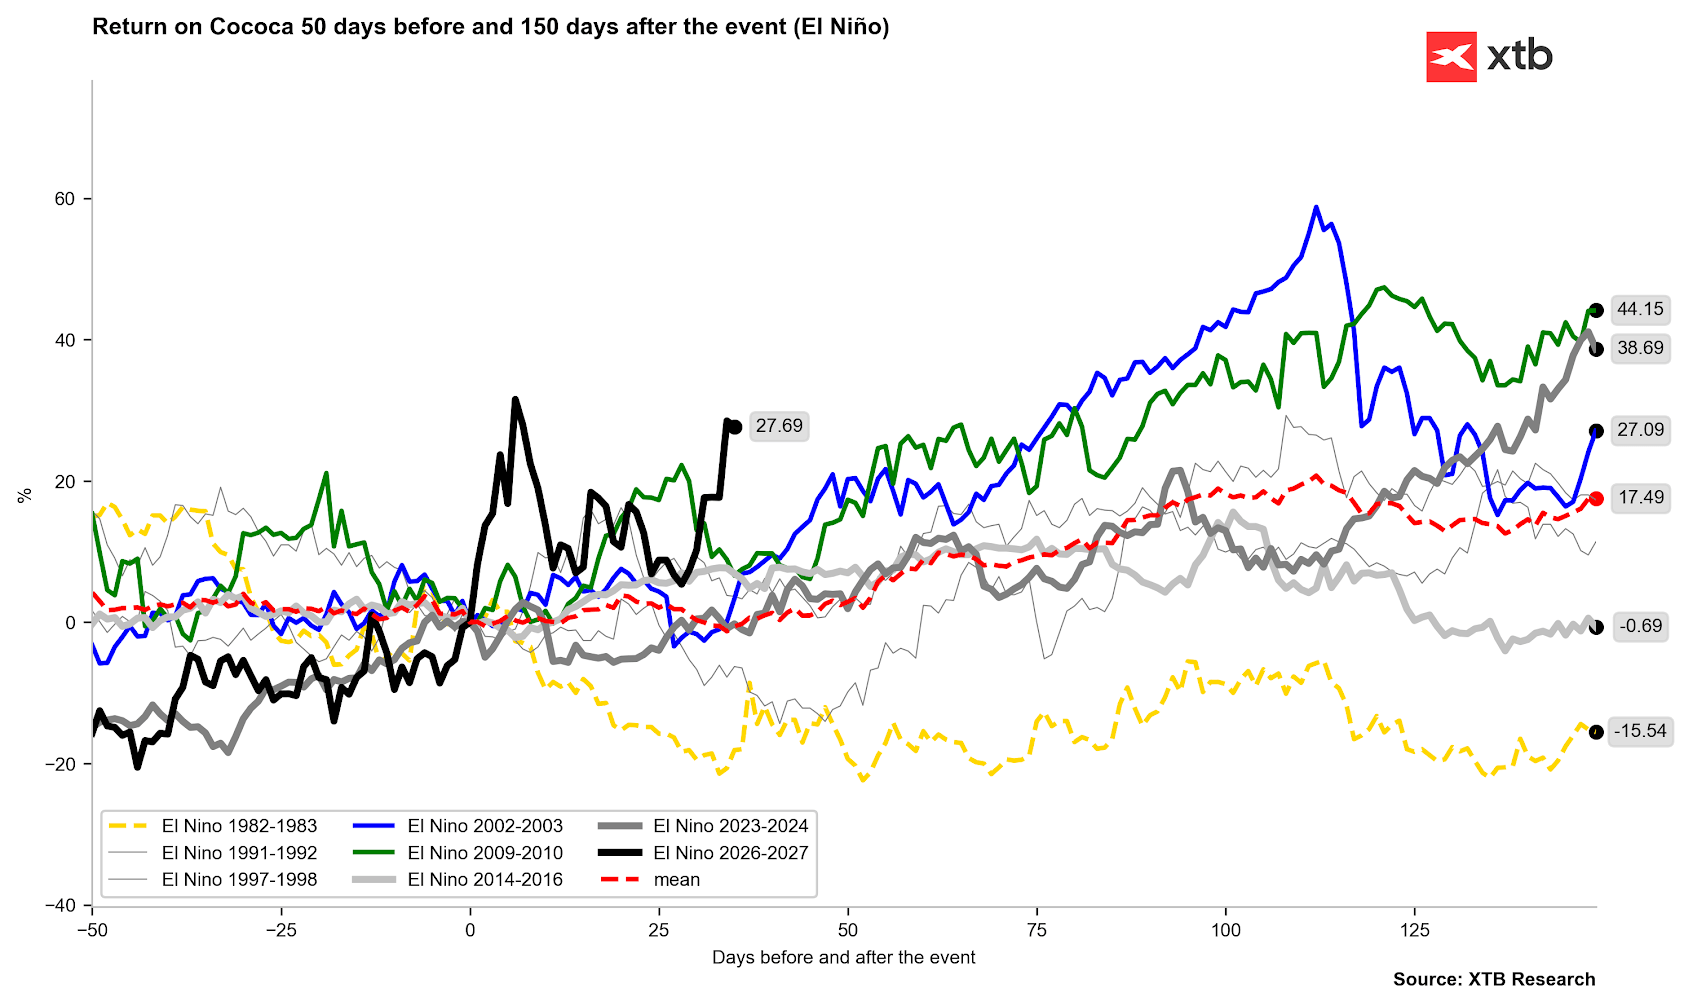
Most El Niño periods ended with clear price increases. What’s more, the impact of El Niño from 2023 still reached strongly into 2024. Source: Bloomberg Finance LP, XTB
Coffee: Extreme Drought for Robusta and Vegetative Anomalies for Arabica
In the coffee market, the El Niño phenomenon triggers starkly different reactions depending on the species and growing region:
- Robusta (Vietnam, Indonesia): Southeast Asia accounts for about 50% of global Robusta production. El Niño brings extreme heatwaves and droughts to these areas, which drastically lowers yields. Although Vietnamese exports in the period of January-May 2026 increased by 7.9% year-on-year, the upcoming lack of rainfall creates a high risk of a drastic supply shortage in the next several months, which is already pushing Robusta futures contracts to multi-month highs.
- Arabica (Brazil): El Niño initially brings excessive rains in Brazil. In the short term, this complicates and delays harvesting (by mid-June 2026, only 15.8% of crops were harvested compared to 26.6% in the same period of 2024). Although the USDA forecasts record Brazilian harvests at 71.9 million bags (up 14% year-on-year), rains deteriorate the quality of harvested beans and stimulate premature flowering of coffee trees before the harvest is complete, which threatens bud dropping and damage to production potential for the 2027/2028 season. There is also a high risk that heavy rains will give way to a severe drought in key growing regions in September and October 2026, which will prevent proper flowering and trigger a sharp rise in Arabica prices.
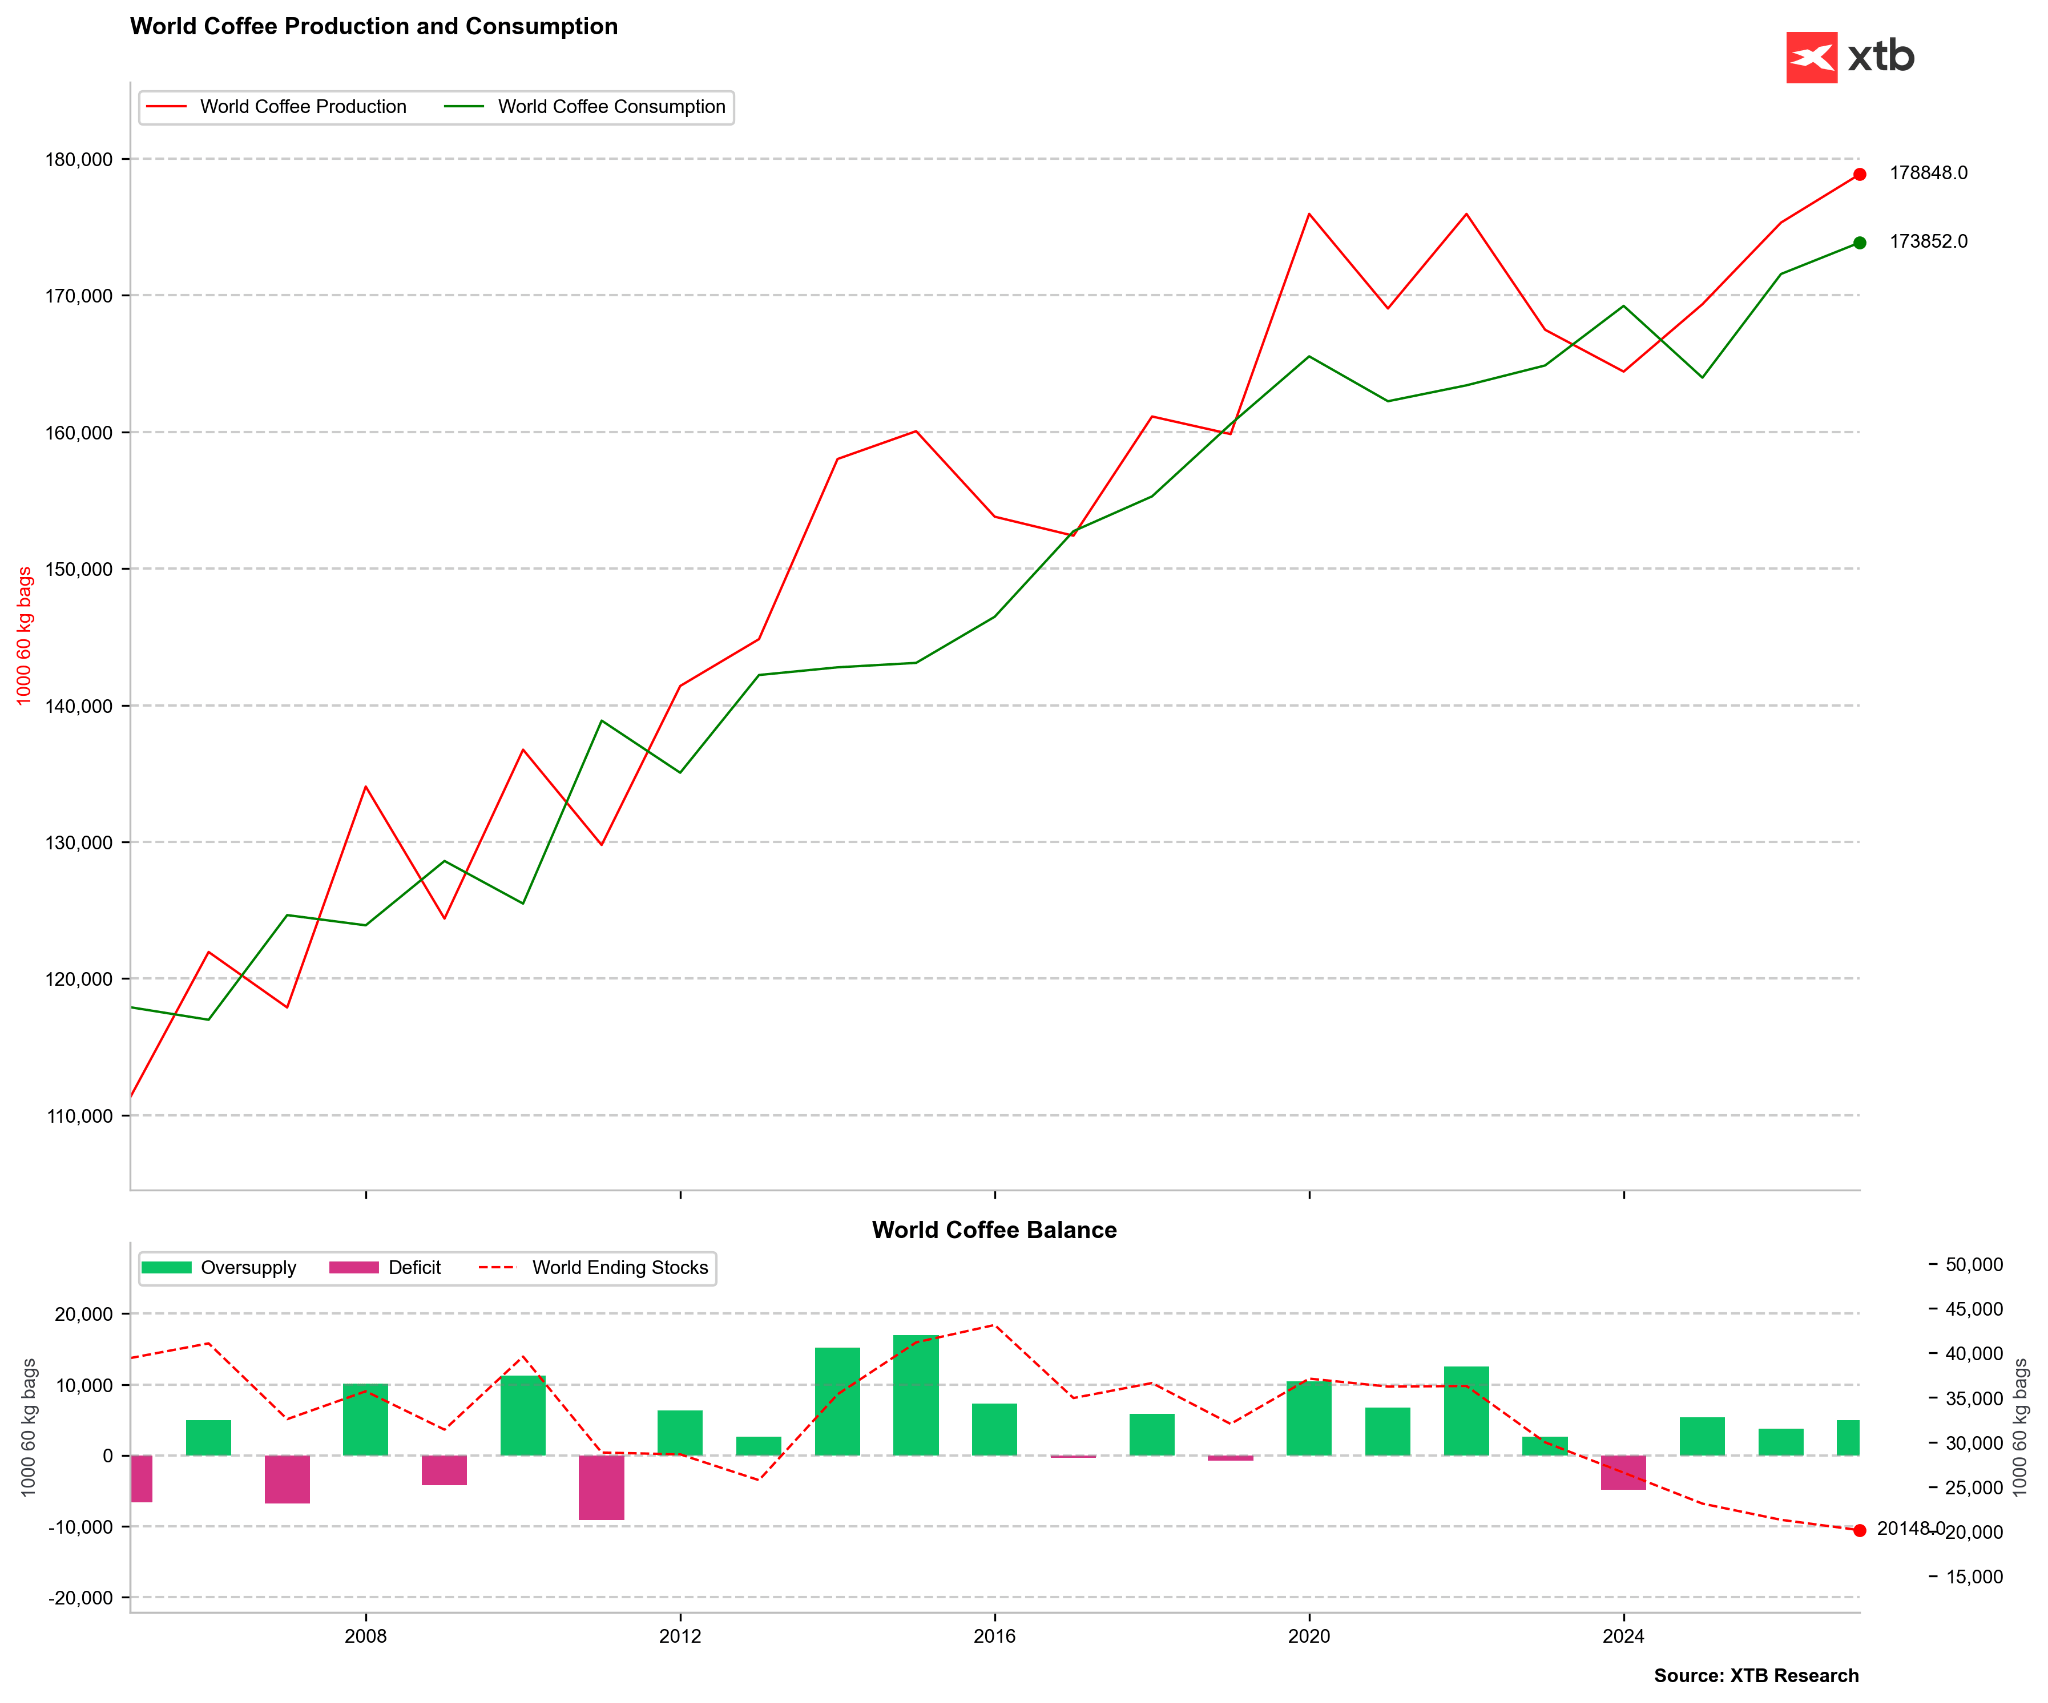
USDA data for several years has shown an oversupply, but this does not always coincide with the narrative from other institutions, particularly the Brazilian CONAB. Source: Bloomberg Finance LP
Market Paradoxes and Energy-Industrial Commodities
The impact of El Niño on commodity markets abounds in anomalies that defy the intuition of inexperienced market participants:
- Soybeans as a beneficiary of rainfall: While most crops are destroyed, soybeans are a structural beneficiary of El Niño. This phenomenon brings abundant rainfall to the US growing belt, in Argentina, and in southern Brazil. Historically, this translates into yield increases of 10% to 15% above the trend, generating global oversupply and triggering sharp price drops on the Chicago exchanges.
- Bearish pressure on American natural gas: El Niño brings milder and warmer winters to the northern United States. This results in a drastic drop in demand for gas for home heating, exerting strong downward pressure on the commodity’s price (bear market) in the USA, which stands in contradiction to the general trend of rising commodity prices.
- Hydroelectric crisis in China: Chinese electricity demand in 2026 is growing by 5% year-on-year, driven by the development of AI data centers and EV charging. The drought caused by El Niño drastically limits production from Chinese hydroelectric plants. Consequently, local governments are forced to substitute hydro energy with coal and gas generation. Beijing issued a categorical decree ordering power plants to rebuild coal stocks to a level covering a minimum of 20 days of consumption, which stimulates price increases for thermal coal.
- Copper logistics paralysis in Chile and Peru: South America in copper mining zones experiences heavy rains and floods. This leads to the washing out of transport roads, flooding of mine infrastructure, deficits in local hydro energy, and mudslides. The supply restriction from these two key countries constitutes a strong upward impulse for copper prices on the LME.
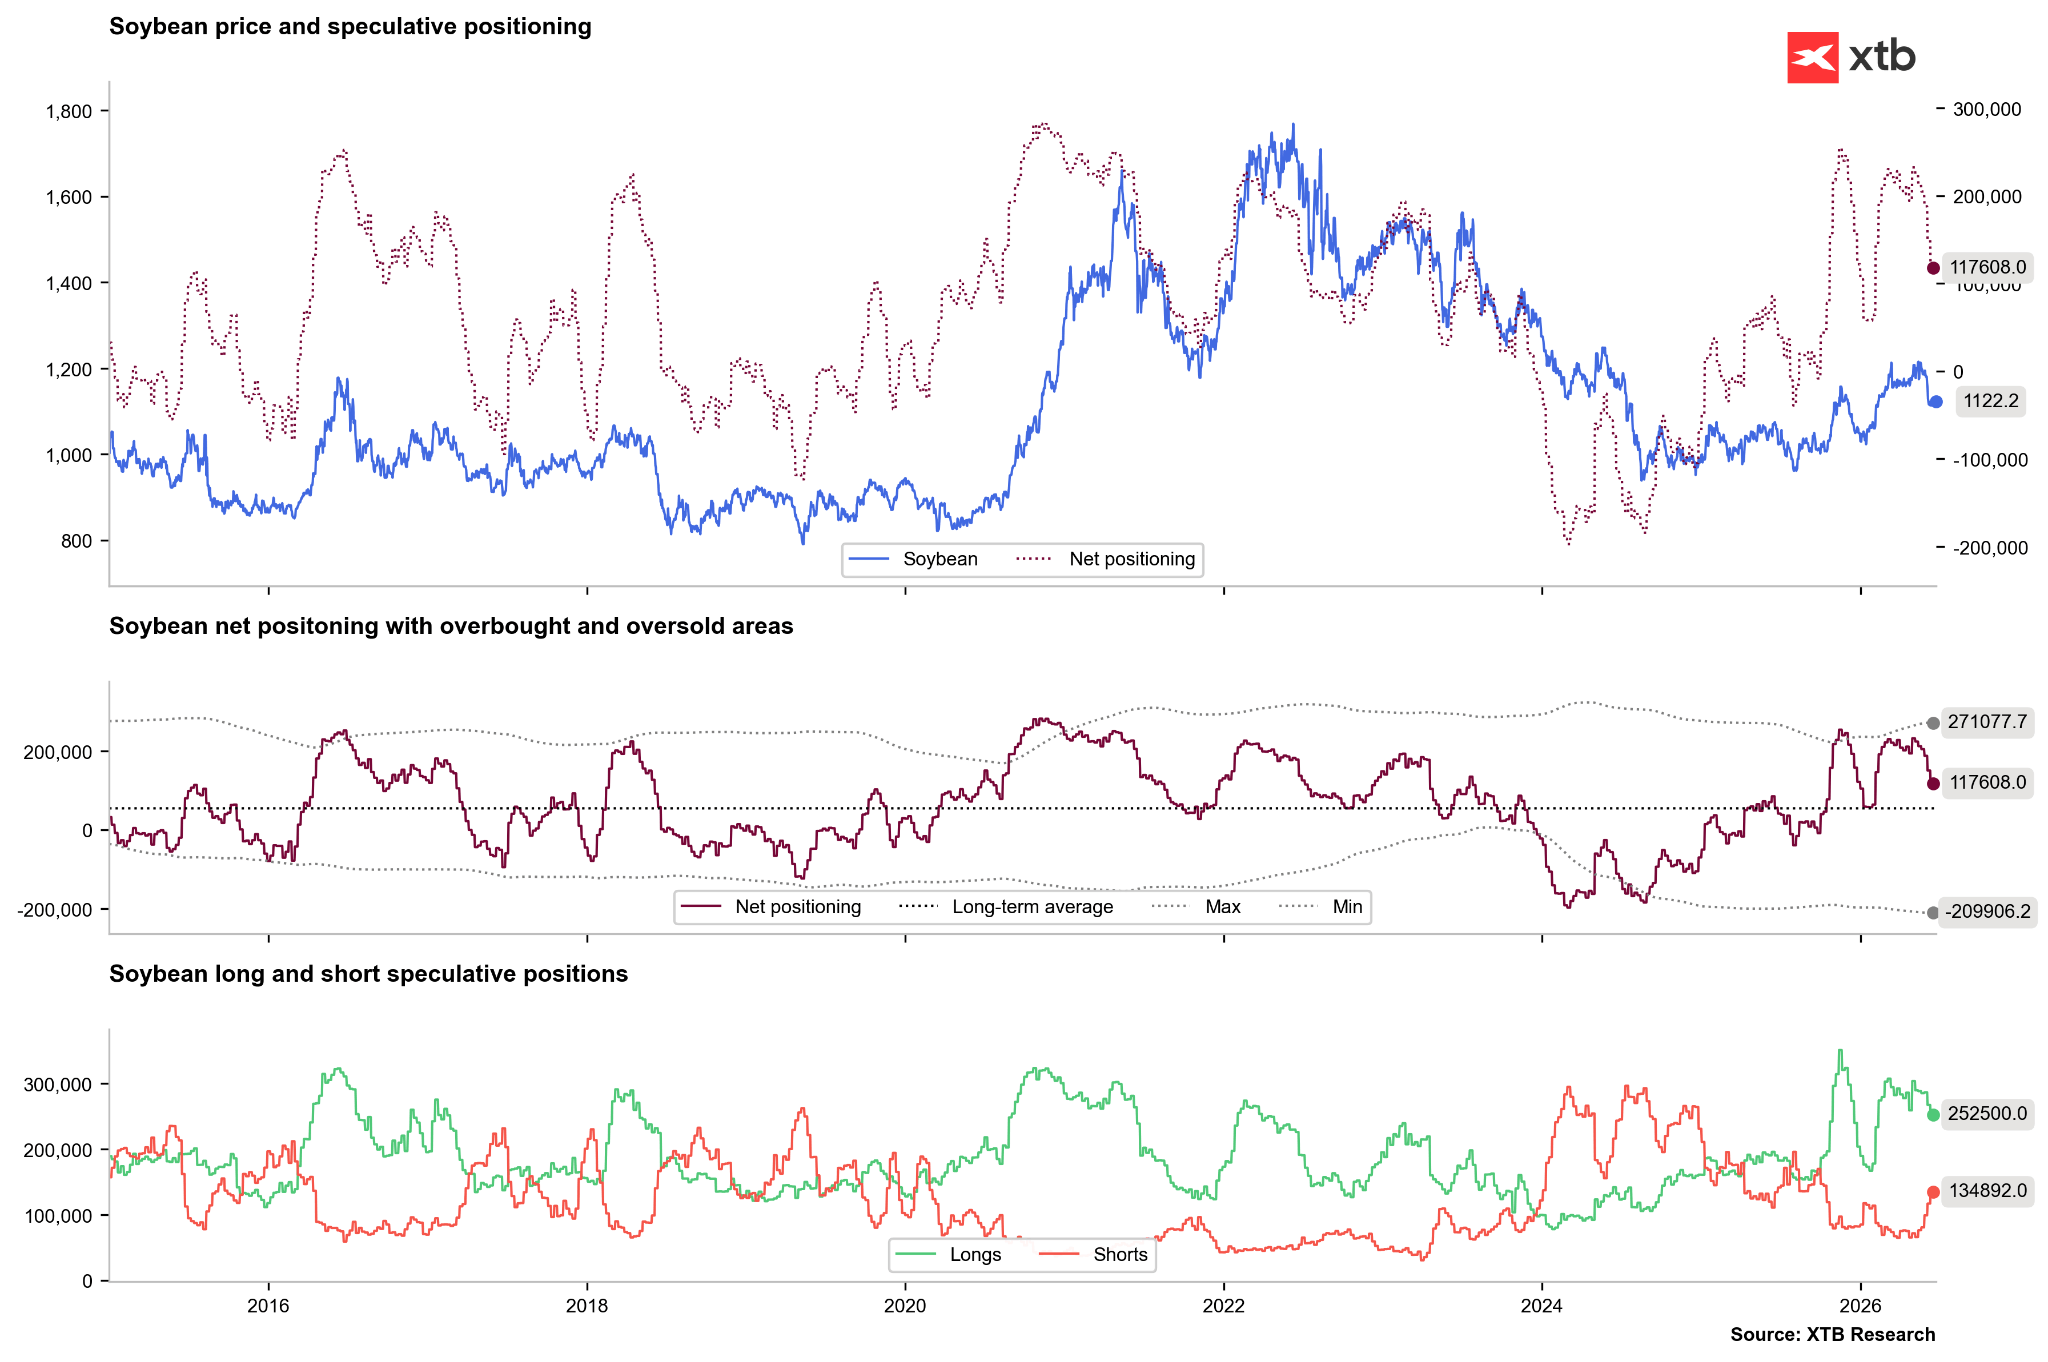
Investors are starting to position for a soybean production surplus. The number of longs is clearly being reduced, while the number of shorts is rising. Source: Bloomberg Finance LP, XTB
Guide to Listed Companies: Winners and Losers of Super El Niño
For stock market investors, Super El Niño constitutes a significant capital allocation factor. The following discussion presents companies that may see improvement in financial results, and those that are exposed to serious operational and financial risks.
Fertilizer and Crop Protection Sector
Weather anomalies and falling yields force farmers to intensify fertilization and protection of surviving crops to save revenues, which supports producers of agricultural production inputs.
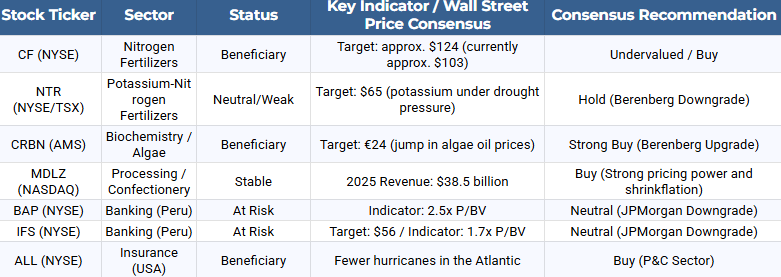
- CF Industries Holdings Inc. (CF): The company focuses on nitrogen fertilizers. In mid-2026, its valuation fluctuates around 102 dollars (about 19% below the analyst consensus of 124 dollars). CF Industries benefits from cheap gas in the USA (the main raw material for ammonia production), maintaining a high EBITDA margin while European competitors struggle with more expensive raw materials. An additional long-term factor is the implementation of the 3.7 billion dollar Blue Point project in the low-emission ammonia segment.
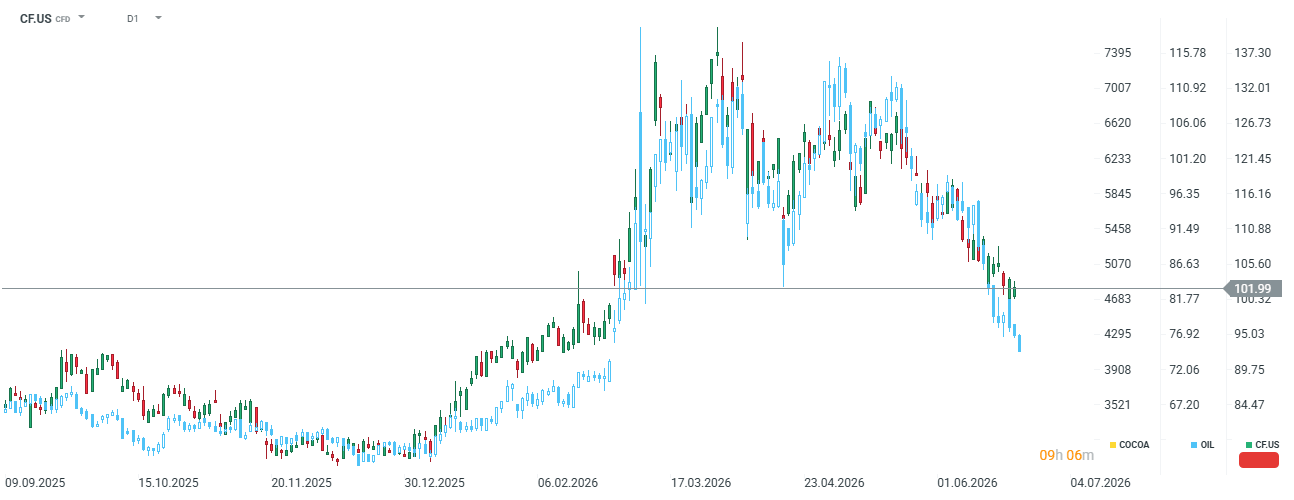
The company gained significantly in value during the crisis related to the Strait of Hormuz. It may turn out that fertilizers will again come under upward pressure. Source: xStation5
- Nutrien Ltd. (NTR): The company shows a more nuanced risk profile. It has strong nitrogen exposure, but droughts caused by El Niño drastically delay farmer demand for potash, leading Berenberg to downgrade NTR to “Hold” with a target price of 65 dollars. The company offers a stable dividend yield of 3.4%, but its growth potential in 2026 is limited by the fall in potash prices. Currently, shares are trading around 61 USD.
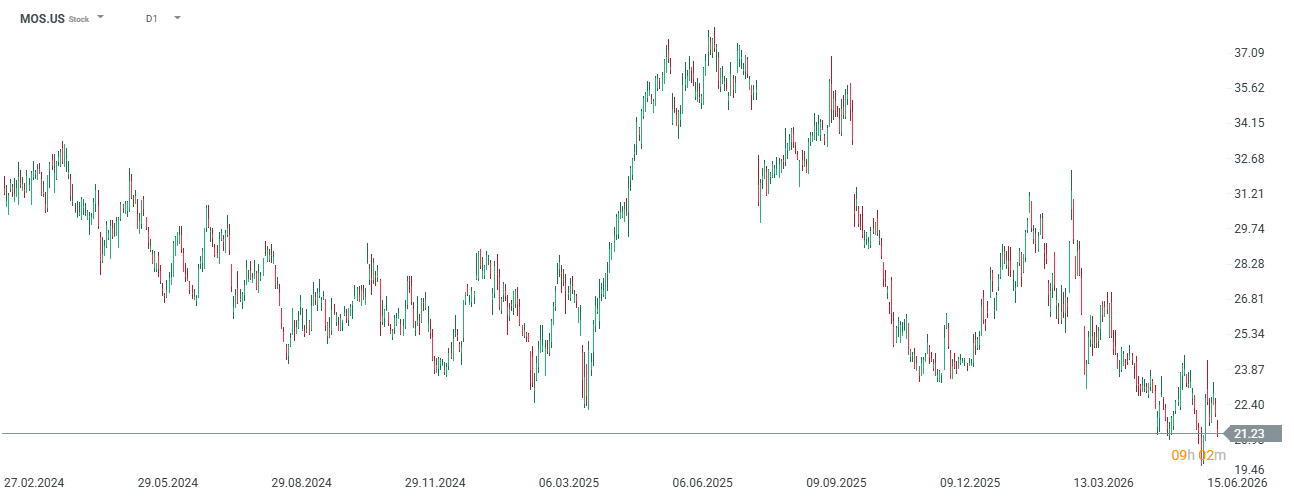
- The Mosaic Co. (MOS): The company is heavily dependent on potash sales, which in drought conditions weakening demand for this nutrient puts it in a worse market position. The company is currently at multi-year lows, around 21 USD, but in 2025 it traded as high as 37 USD.
- Corteva Inc. (CTVA): As a global provider of advanced seeds and chemical crop protection, it may see revenue growth as farmers pay a premium for drought- and pathogen-resistant biotechnologies.
Biochemical and Aquaculture Sector
Thermal anomalies in the Pacific drastically change the cost structure in global feed and food production.
- Corbion NV (CRBN.NL): The company is a key winner of the raw material crisis in Peru. The upwelling blockage off the coast of Peru led to a complete halt of anchovy fishing in May 2026. Prices of traditional fish oil (a key ingredient in salmon feeds and dietary supplements) jumped from 3.10 dollars per kilogram in July 2025 to a record 10 dollars per kilogram in June 2026. Corbion is a global leader in industrial production of alternative algae oil rich in Omega-3 fatty acids. The price jump of natural fish oil made Corbion’s product reach price parity, generating powerful demand from feed and baby formula producers. Berenberg raised its recommendation for Corbion to “Buy” with a target price of 24 euros, forecasting EBITDA growth from the algae segment alone to 44 million euros in 2026 and 49 million euros in 2027. The company is also cited as an attractive acquisition target for global players following the planned spin-off of the polylactic acid (PLA) segment.
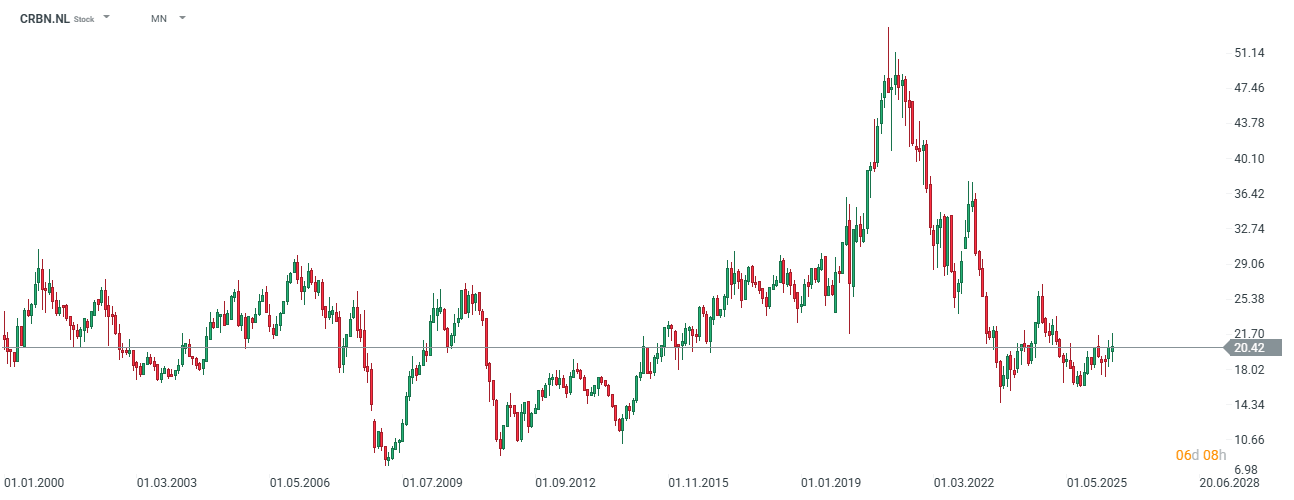
The company has lost almost 1/3 of its value since the peak in 2020. Source: xStation5
Food Processing and Candy Manufacturer Sector
- Mondelēz International Inc. (MDLZ): As the owner of brands such as Cadbury, Milka, and Toblerone, the company is one of the largest global consumers of cocoa and sugar. In conditions of raw material crisis caused by El Niño, Mondelez uses a highly effective margin protection strategy through so-called “shrinkflation” (reducing the weight of products while maintaining existing price points) and intense expansion in the premium segment. CEO Dirk Van de Put argues that consumers are more willing to accept a smaller bar than a higher price on the shelf. Additionally, the company invested 65 million CHF in expanding the Toblerone factory in Bern, transforming it into a global Center of Excellence. This strategy allows for maintaining high profitability (in 2025 revenues grew 5.8% y/y to 38.5 billion USD, and net profit reached 2.45 billion USD). Although CFO Luca Zaramella indicates some stabilization and “normalization” of cocoa prices from extreme highs, this raw material remains structurally expensive, meaning Mondelez’s ability to pass costs on to consumers (pricing power) will be a key factor deciding the preservation of margins in the 2026/2027 season.
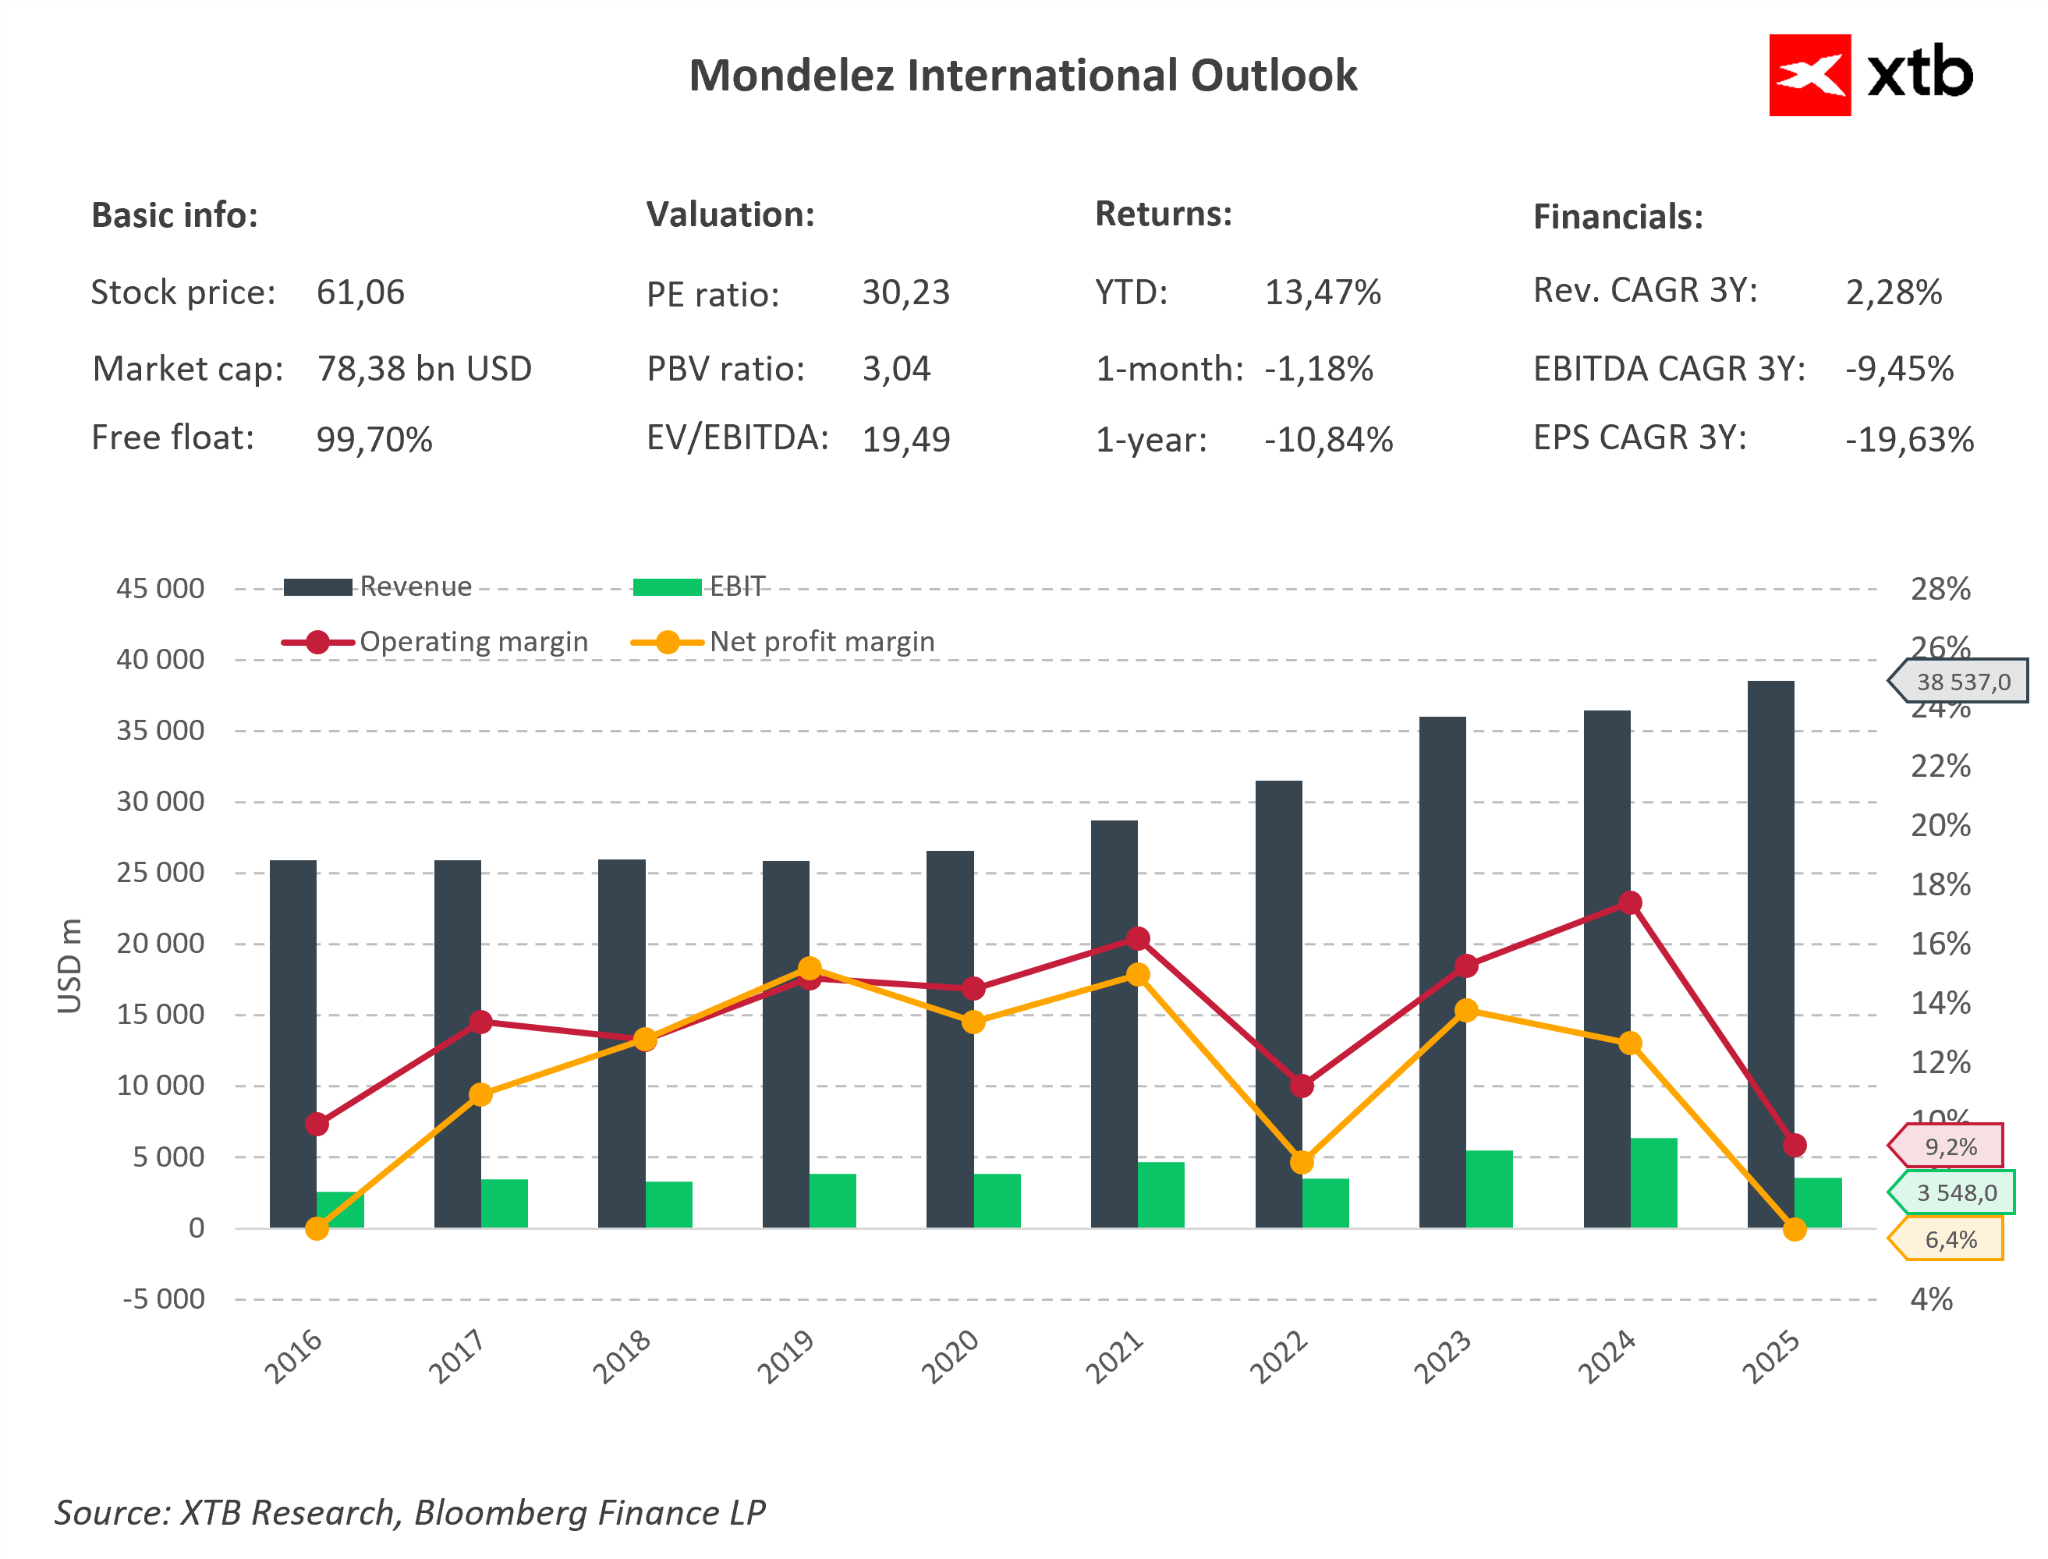
The company currently has fairly low margins, but due to the situation, there is significant potential for a return to the 2023 situation. Additionally, the company appears to be undervalued currently, looking at a fundamental valuation based on averages from the last 5 years. The company’s shares are more than 20% below historical peaks. Source: Bloomberg Finance LP, XTB
Insurance and Financial Sector
Shifts in jet streams caused by El Niño generate asymmetric risks for financial institutions.
- Allstate Corp. (ALL.US). Progressive Corp. (PGR) / Travelers (TRV): Theoretical beneficiaries of El Niño. This phenomenon causes strong wind shear over the Atlantic, which makes it difficult for destructive hurricanes to form off the coast of Florida and in the Gulf of Mexico (NOAA forecasts indicate a drop in the number of named storms to a level of 8 to 14 in the 2026 season compared to a norm of 14). Fewer hurricanes mean a radical reduction in claim costs for American property insurers. However, the unpredictability of climate change remains a risk, as it could bring other local disasters.
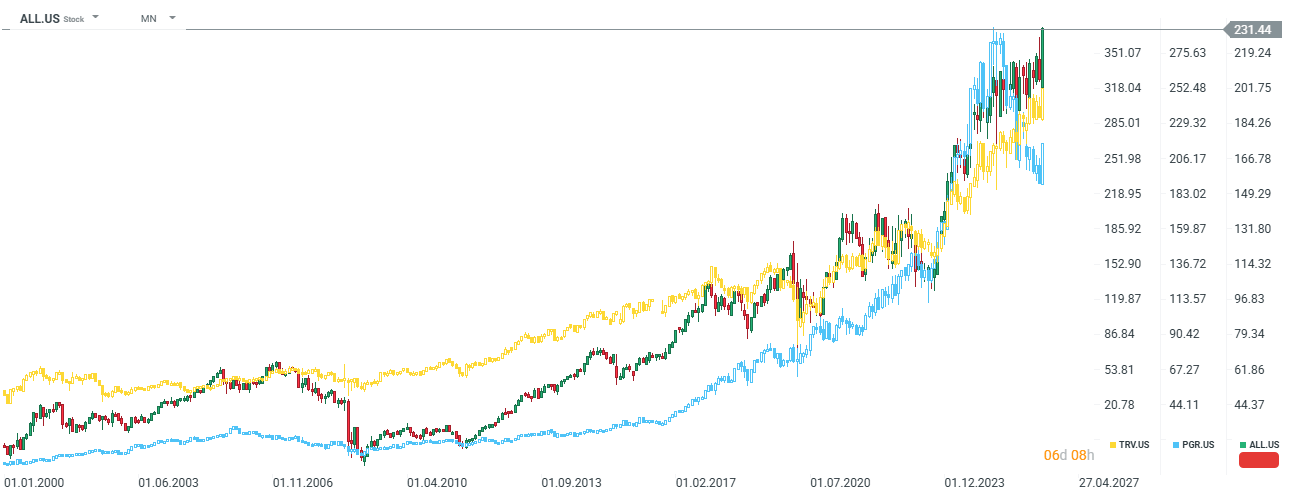
Allstate and Travelers are currently at historical levels, while Progressive Corp may appear somewhat undervalued relative to the sector. Source: xStation5
- Credicorp Ltd. (BAP). Intercorp Financial Services (IFS): Peruvian financial holdings were downgraded by JPMorgan to a “Neutral” recommendation. El Niño directly hits key sectors of the Peruvian economy, namely fishing and agriculture. JPMorgan indicates that bank valuations at 2.5 times book value for BAP (target price around 360 dollars) and 1.7 times for IFS (target price around 56 dollars) do not fully discount the risk of an increase in write-offs on unpaid agricultural and fishing loans and the political uncertainty associated with the power transition process in Peru.
Summary and Conclusions for Commodity and Equity Investors
The Super El Niño anomaly at the turn of 2026 and 2027 should not be treated as a simple signal for speculative purchase of all agricultural commodities. Precise positioning in the market requires considering climate asymmetry and overlapping structural factors. The basis of an effective strategy is abandoning traditional ONI index readings in favor of the RONI index, which is cleared of the ocean warming trend. Investors should avoid exposure to soybeans and American natural gas (or look for sell signals), which, due to the specificity of Pacific teleconnections, become natural beneficiaries and exhibit a downward trend.
In turn, the key growth potential lies in soft commodities such as Robusta coffee (which partially translates into Arabica coffee prices) and cocoa, where El Niño drastically deepens an already tight supply-demand balance. On the other hand, an aspect that El Niño does not take into account is demand, which is depleted after these commodities hit historical peaks. In the equity segment, the optimal choice is capital allocation into companies with a high barrier to entry and direct operational leverage on the effects of