Commerzbank’s Michael Pfister notes that the Russian Central Bank surprised markets by cutting rates only 25 bps to 14.25%, instead of the 50 bps expected, signalling a hawkish stance and caution on further easing. However, he argues this offers little support for the Russian Ruble (RUB), given capital controls, indirect pricing via Chinese Yuan (CNY) and US Dollar (USD), and the dominance of war and energy shocks for RUB performance.
Hawkish cut fails to lift RUB
“Instead of cutting rates by 50 basis points, they were cut by just 25 to 14.25%, accompanied by a statement that a decision on whether to implement further rate cuts would first have to be made at forthcoming meetings. This was thus a strong hawkish signal.”
“As expected, this did little to help the rouble. If the rouble were a freely tradable currency, such a signal would have triggered a rally despite considerable political pressure.”
“But the rouble is no longer freely tradable; it is now quoted solely via indirect links through the CNY-RUB and USD-CNY exchange rates.”
“Consequently, even if the central bank were to halt interest rate cuts in the near future, it would do the currency little good. As no real capital inflows are possible, market participants find it difficult to benefit from the higher interest rate, and the rouble cannot appreciate either.”
“The rouble only appreciates when there are prospects of an imminent end to the war (coupled with the hope that sanctions will be eased), or in the event of a significant energy price shock, as we have seen in recent months. Monetary policy cannot change this.”
EUR/USD declines to near 1.1465 in Monday’s early European session.
The pair keeps the bearish vibe, downside pressure prevails with RSI holding below the midline.
The first downside target to watch is 1.1450; the immediate resistance level emerges at 1.1570.
The EUR/USD pair loses ground to around 1.1465 during the early European session on Monday. The uncertainty surrounding the US-Iran peace deal, following threats from President Donald Trump to restart the war in the Middle East, weighs on the riskier assets such as the Euro (EUR) against the US Dollar (USD).
On Monday, Qatar and Pakistan issued a joint statement on the conclusion of negotiations between the US and Iran in Bürgenstock, Switzerland, saying that talks were conducted in a positive, constructive atmosphere. Meanwhile, Pakistani and Qatari mediation yields significant progress to end the Lebanon conflict, adding that oil and petrochemical exports are exempt, the blockade is removed, some frozen assets are freed, and a major reconstruction and development plan is initiated for Iran.
On the other hand, hawkish remarks from European Central Bank (ECB) officials might help limit the USD’s losses. On Friday, ECB policymaker and the head of Belgium’s central bank, Pierre Wunsch, said that the central bank may raise interest rates one more time as soon as next month if it sees more evidence of Eurozone inflation spreading beyond energy.
The ECB’s deposit rate currently stands at 2.25%, and financial markets expect additional 25 basis point hikes in September or October, possibly followed by one more in the early months of next year.
Technical Analysis:
In the daily chart, EUR/USD keeps a clear bearish bias as spot holds well below the 100-day simple moving average (SMA) and the Bollinger middle band. Price is nearing the lower Bollinger band support while the Relative Strength Index (RSI) at about 34 drifts towards oversold territory, which suggests persistent downside pressure but also warns that selling momentum could start to fatigue near current levels.
On the downside, the immediate cushion emerges at the lower Bollinger band near 1.1450; a sustained break under this level would open the door toward fresh lows in the broader downtrend. On the topside, initial resistance is seen at the Bollinger middle band around 1.1570, followed by the 100-day SMA at 1.1665 and the upper Bollinger band near 1.1695, with the pair needing to reclaim at least the mid-band to ease the prevailing bearish tone.
The week ahead will bring a fresh test for major currency pairs as investors digest the first Federal Reserve (Fed) policy decision under Chair Kevin Warsh and look ahead to the United States (US) Personal Consumption Expenditures (PCE) data, global PMI releases, and central-bank commentary.
The US Dollar Index (DXY) trades near the 100.70 price zone on Friday after reaching a 13-month high of 101.13 earlier in the day. The Greenback rose sharply this week following the Fed’s decision to leave interest rates unchanged in the 3.50%-3.75% range, and removing its previous reference to “additional rate adjustments” . A hotter-than-expected PCE report, the Fed’s favorite inflation gauge, could reinforce the Fed’s hawkish stance and extend the upward USD’s trend.
US Dollar Price Today
The table below shows the percentage change of US Dollar (USD) against listed major currencies today. US Dollar was the strongest against the Swiss Franc.
USD
EUR
GBP
JPY
CAD
AUD
NZD
CHF
USD
-0.16%
-0.22%
-0.06%
0.25%
-0.02%
0.23%
0.28%
EUR
0.16%
-0.05%
0.13%
0.41%
0.14%
0.37%
0.44%
GBP
0.22%
0.05%
0.17%
0.45%
0.21%
0.44%
0.50%
JPY
0.06%
-0.13%
-0.17%
0.30%
0.06%
0.27%
0.33%
CAD
-0.25%
-0.41%
-0.45%
-0.30%
-0.22%
-0.03%
0.03%
AUD
0.02%
-0.14%
-0.21%
-0.06%
0.22%
0.21%
0.30%
NZD
-0.23%
-0.37%
-0.44%
-0.27%
0.03%
-0.21%
0.05%
CHF
-0.28%
-0.44%
-0.50%
-0.33%
-0.03%
-0.30%
-0.05%
The heat map shows percentage changes of major currencies against each other. The base currency is picked from the left column, while the quote currency is picked from the top row. For example, if you pick the US Dollar from the left column and move along the horizontal line to the Japanese Yen, the percentage change displayed in the box will represent USD (base)/JPY (quote).
EUR/USD declined over 0.80% this week to the 1.1480 level amid a broadly strong US Dollar. The Eurozone calendar will keep its eyes on flash PMI data, which should give investors a clearer view of whether activity remains fragile across manufacturing and services. Germany will also be important, with flash PMIs, the Ifo Business Climate survey, and GfK Consumer Confidence due during the week. Any signs of weaker German business sentiment could weigh on the Euro, especially after ECB officials warned about uncertainty around energy prices, inflation transmission, and second-round wage effects.
GBP/USD is trading near 1.3230, with a strong weekly decline, after the Bank of England (BoE) left interest rates unchanged at 3.75% in a 7-2 vote, with two policymakers supporting a hike to 4.00%. Next week, the United Kingdom (UK) flash PMIs and final Q1 Gross Domestic Product (GDP) data will be key for the Pound Sterling.
USD/JPY remains near intervention levels at 161.30, focused on the balance between Fed caution and the Bank of Japan’s (BoJ) tightening bias. The BoJ recently raised interest rates to 1.00%, while officials continue to warn that inflation risks could require further action. Japan’s flash PMIs, Tokyo CPI, and comments from BoJ officials will be watched closely.
AUD/USD fell this week toward the 0.7020 level, a significant domestic test as Australia releases flash PMIs, monthly CPI, and labor market data. A stronger CPI print or resilient employment data could support the Aussie, while weaker numbers may leave AUD/USD vulnerable to renewed US Dollar strength.
Gold (XAU/USD) struggles near the $4,155 level as geopolitical uncertainty and concerns over the Middle East could limit downside for the precious metal.
West Texas Intermediate (WTI) Oil fell for a second consecutive week near $76.50 per barrel as the US-Iran agreed a peace deal, weighing on Oil prices. Markets will watch whether Oil flows continue to normalize, as lower energy prices could ease inflation fears and influence central-bank expectations.
Anticipating economic perspectives: Voices on the horizon
Monday, June 22
ECB President Lagarde
Fed’s Waller
ECB President Lagarde
Tuesday, June 23
ECB’s Lane
BoC Governor Macklem
ECB’s Elderson
ECB’s Vujčić
BoE’s Taylor
BoE’s Dhingra
Wednesday, June 24
ECB’s Nagel
BoE’s Breeden
ECB’s Cipollone
BoE’s Dhingra
Thursday, June 25
ECB’s Philip
ECB’s Cipollone
Fed’s Williams
Fed’s Goolsbee
Friday, June 26
ECB’s Nagel
Fed’s Williams
ECB’s Vujčić
Saturday, June 27
ECB’s Schnabel
RBA Governor Bullock
Central banks’ meetings and policy decisions to shape markets
No major Fed, BoE, BoJ, or RBA interest rate decisions are scheduled for the week, leaving investors focused on speeches, incoming data, and the market interpretation of the latest policy meetings.
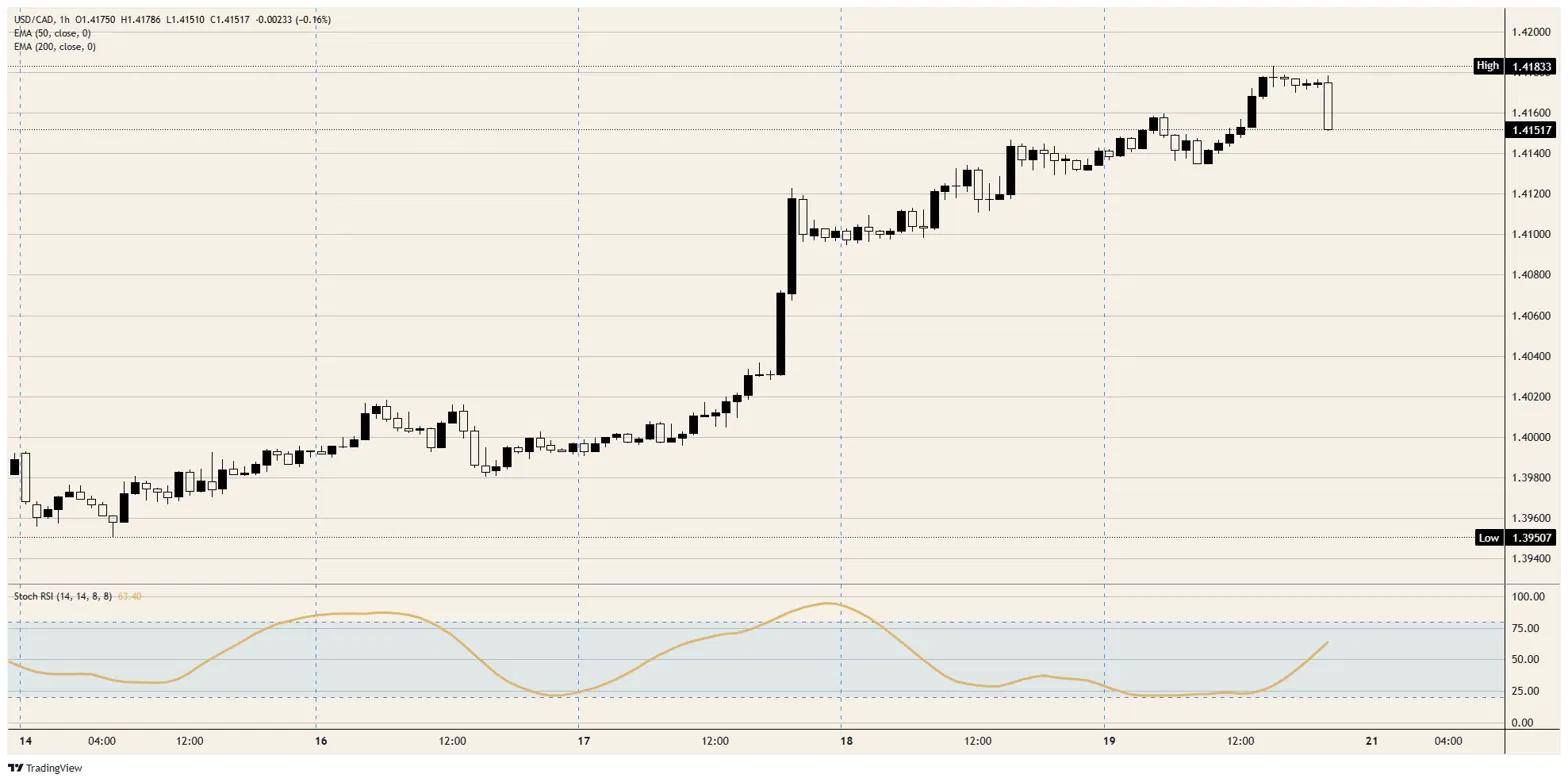
USD/CAD pushed to a fresh 14-month high this week, dragging the Loonie to its weakest against the Greenback since early 2025.
The slide defies firm Crude Oil prices; the Loonie’s traditional link to Crude Oil has broken down and even turned negative.
The real drivers are a widening Canada-US rate gap and a six-week slide in Gold.
The textbook calls the Canadian Dollar a petro-currency, which means that with a Middle East war keeping Crude Oil bid, the Loonie should be holding its own. Instead it spent this week sliding to a fresh 14-month low against the Greenback, capping a run in which the US Dollar has closed higher in six of the last seven weeks. The textbook is wrong, at least for now: the Loonie has quietly stopped trading like a Crude Oil proxy, with its weakness driven by two forces that have nothing to do with the price of a barrel.
A petro-currency in name only
For years the Loonie moved with the price of a barrel; that relationship has quietly inverted. The rolling correlation between daily moves in the currency and Crude Oil has turned negative in recent months, a clean break from the historical norm. In its place, a less obvious driver has taken over: Gold. Canada is a major bullion producer; with Gold down for six straight weeks and well off its recent record, that slide has become a genuine weight on the currency. The market has swapped one commodity anchor for another; traders still watching only the barrel have missed it.
Two central banks moving apart
The second force is the one doing most of the damage: a widening gap between the Federal Reserve (Fed) and the Bank of Canada (BoC). The Fed held at 3.75% this month and revised its dot plot higher, with markets pricing a possible 2026 hike; the BoC, at 2.25%, is going nowhere. It held again this month, caught in a two-way bind between a soft domestic economy and fresh, energy-driven inflation, and has signalled no intention of moving. When one central bank is leaning toward hikes and the other is frozen, the rate spread does the talking; right now it points squarely against the Loonie. Speculative short positions on the currency have climbed to their highest in months as a result.
Outgunned, but not without a say
What makes the move striking is that this is not simply a story about Canada falling apart. The domestic picture is mixed rather than broken: a strong May jobs report sits alongside Friday’s soft retail sales; the Loonie’s slide owes more to relative positioning than to outright collapse. That also means the currency has a busier week ahead than the bears might like.
Canada’s own May Consumer Price Index (CPI) lands Monday at 12:30 GMT. With inflation already running near 3% on elevated energy costs, a hot print would feed the BoC’s inflation side and could lend the Loonie a rare bid; Governor Macklem then speaks Tuesday. The dominant event still sits south of the border: on Thursday at 12:30 GMT the US delivers its first-quarter Gross Domestic Product (GDP) third estimate alongside the May Personal Consumption Expenditures Price Index (PCE), with core PCE seen accelerating to 0.3% MoM. A hot US PCE widens the rate gap further and points USD/CAD higher still; only a genuinely hot Canadian CPI on Monday gives the Loonie much to fight back with.
Resistance: USD/CAD is pressing the 1.4200 handle after this week’s run; a clean break opens 1.4250 and then 1.4300, levels last seen well over a year ago.
Support: Initial support sits near 1.4100, then 1.4050; only a move back below 1.4000 would suggest the Loonie has found real footing.
Bias: Higher for USD/CAD while the Fed-BoC gap widens and Gold stays heavy, meaning further Loonie weakness is the base case. The one caution is positioning: the daily Stochastic Relative Strength Index (Stoch RSI) is deep in overbought after a near-vertical climb; a sharp but shallow pullback toward 1.4100 would not surprise. A hot US PCE next week is the catalyst most likely to push the pair on toward 1.4250.
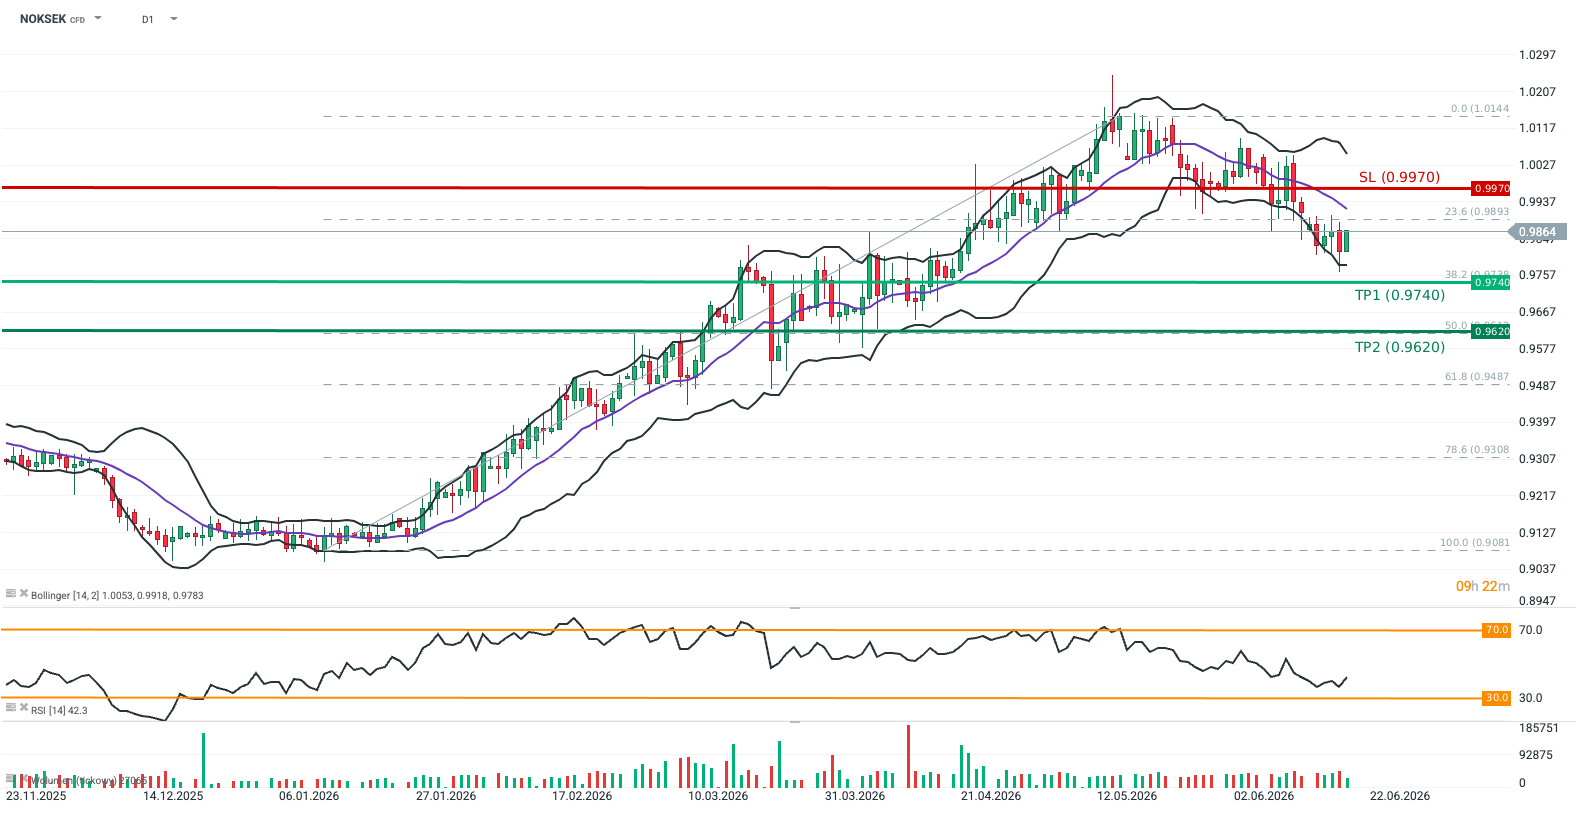
The NOKSEK closing price has remained below the 23.6% Fibonacci retracement level (measured from January 13 to May 15) for the last five consecutive sessions.
The exchange rate failed to return above the middle Bollinger Band on the 14-day timeframe, despite yesterday’s declaration from Norges Bank indicating its intention to hike interest rates in the coming months.
Crude oil futures (OIL) have lost approximately 7.5% since the beginning of the week.
NOKSEK broke its upward trend alongside the de-escalation of the Middle East conflict due to its tight correlation with oil prices (Norway remains one of the key net exporters of the commodity). The cross also failed to react significantly to the hawkish rhetoric from Norges Bank, which announced interest rate hikes in the coming months in the face of elevated CPI inflation (3.1% in May 2026). The rate remains in a downward trend (consistently trading between the middle and lower Bollinger Bands on the 14-day interval) despite the recent widening of the yield spread between 2-year Norwegian and Swedish government bonds.
This suggests that the exchange rate’s correlation with oil prices and the fading geopolitical risk premium remain the dominant drivers. Upside for the NOK may also be capped by the broader macroeconomic outlook—Norges Bank projects elevated inflation above target until 2029, alongside the risk of unemployment rising to pre-pandemic levels. Conversely, forecasts for Sweden point to accelerating GDP growth (1.8% in 2026 and 2.2% in 2027; source: Eurostat) combined with falling inflation below 2% (1.5% in 2026 and 1.8% in 2027; source: Eurostat).
Methodology
This recommendation was prepared based on a technical analysis of the NOKSEK chart, a fundamental analysis of the respective economies (monetary policy in Norway and Sweden), and the exchange rate’s correlation with crude oil prices. The directional bias of the recommendation was determined using Bollinger Bands. Take Profit and Stop Loss levels were established using Fibonacci retracements and price action (TP1 and TP2 at the 38.2% and 50.0% Fibo levels of the latest upward wave; SL placed at the resistance of the last rebound prior to the trend reversal).
The British pound is regaining momentum at the end of the week, driven by a stronger-than-expected batch of UK economic data.
This surprise surge in retail sales successfully halted sterling’s broad decline against most G10 currencies. Leading the recovery is the GBP/CHF pair, which broke cleanly above key moving averages to cement the pound’s robust positioning across Europe this Friday.
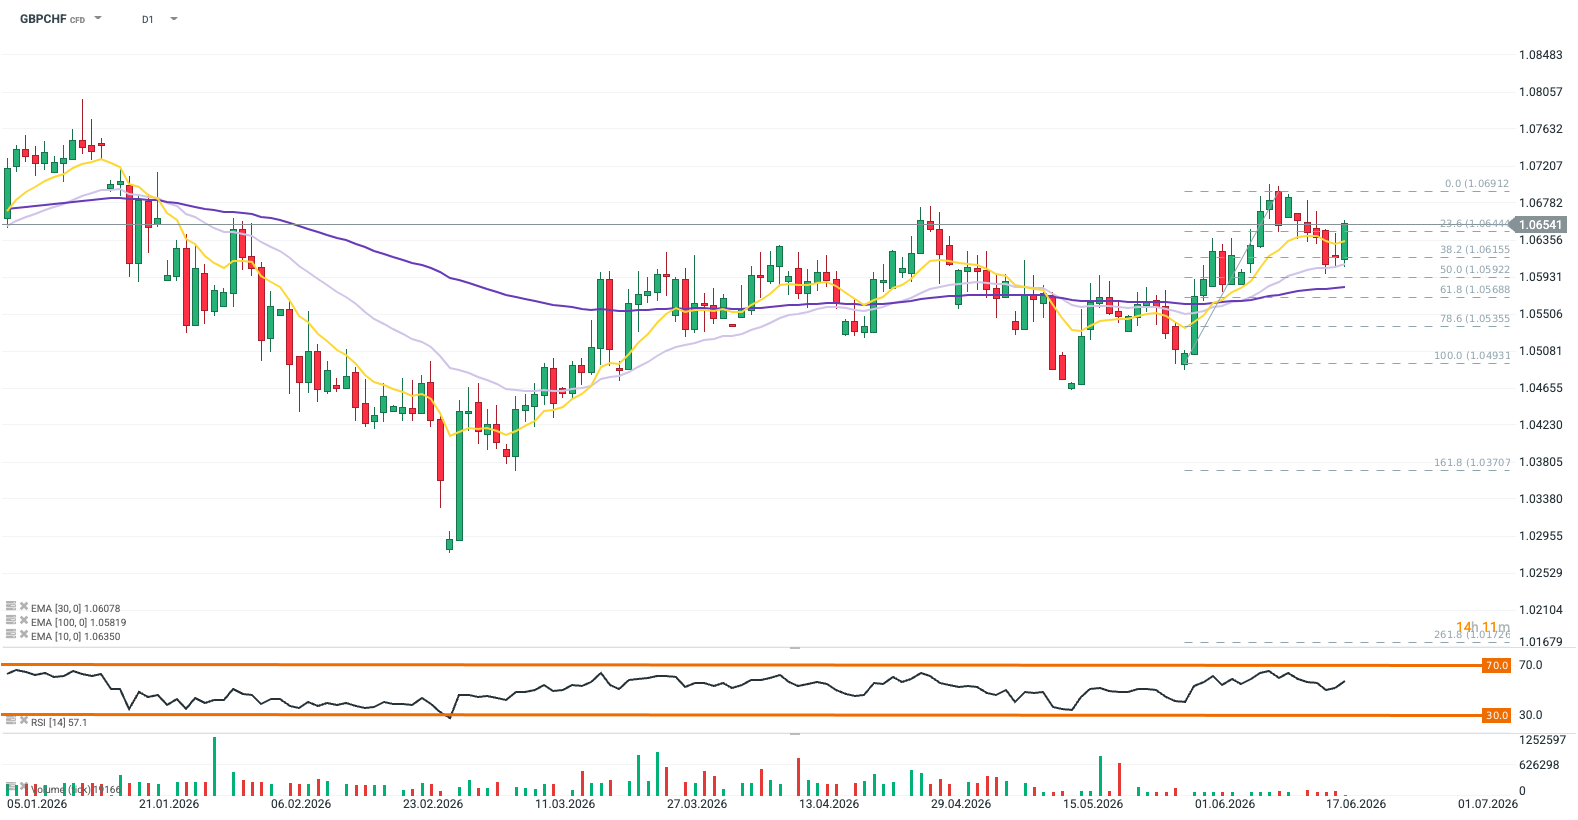
GBPCHF is exhibiting a bullish outlook, rebounding firmly to 1.0651 after finding support near the 38.2% Fibonacci level. The pair trades cleanly above its 10, 30, and 100-day EMAs, saving the upward trend. With the RSI at 56.7, there is plenty of room for further gains toward recent local highs. Source: xStation5
What’s Driving GBPCHF Today?
Sales Surprise on the Upside: Driven by the joint-third warmest May on record and retail promotions, UK retail sales volumes jumped 1.2% in May 2026, bouncing back from a 1.0% decline in April. This growth significantly outperformed economists’ forecasts, with annual sales rising 3.2%. Department and online stores performed particularly well, boosting the online sales share to 28.8%, though overall volumes still remain 0.4% below their pre-pandemic February 2020 levels.
Fragile Trend Sustainability: Over the three months to May 2026, sales volumes edged up 0.4%, supported by strong demand for tech products and outdoor items. However, long-term consumer confidence remains fragile. Shoppers are showing caution regarding big-ticket purchases due to cost-of-living pressures and geopolitical uncertainty surrounding the conflict in Iran. Major supermarket groups like Tesco and Morrisons have already noted a distinct slowdown in sales growth since this conflict began.
Burnham’s Turning Point: Greater Manchester Mayor Andy Burnham’s decisive parliamentary victory in Makerfield has cleared the way for a potential challenge against the deeply unpopular Prime Minister Keir Starmer, threatening fresh political instability in the UK. Positioned as a prime minister-in-waiting and heavily favored by party members, Burnham’s win severely weakens Starmer—who already faces resignation calls from a quarter of his lawmakers—and sets the stage for a high-stakes battle over the future direction of the Labour government.
USD/CHF extends its upside to near 0.8075 in Friday’s early European session.
US Vice President JD Vance pulled out of a planned trip to Switzerland for talks with Iran.
SNB left its key interest rate at 0%, with a focus on currency risks.
The USD/CHF pair advances to around 0.8075, the highest since December 10, 2025, during the early European session on Friday. The US Dollar (USD) strengthens against the Swiss Franc (CHF) as the Federal Reserve (Fed) officials left interest rates unchanged at its June policy meeting and signaled the possibility of higher rates later this year.
Hawkish signals from the Fed provide some support to the Greenback. On Wednesday, the US central bank decided to hold its benchmark interest rate steady between 3.50% and 3.75% after Kevin Warsh’s first meeting in charge of the central bank. Warsh said during the press conference that “price stability” would be the Fed’s guiding principle.
Futures traders have priced in that the Fed is likely to raise rates by 25 basis points (bps) at its September meeting, with some chance seen of a move as soon as next month’s meeting.
On the geopolitical front, US Vice President JD Vance cancelled a planned trip to meet Iranian negotiators in Switzerland to begin complex talks on implementing a 14-point agreement struck between Tehran and Washington to end their war. Traders will closely watch the US-Iran peace deal developments. Uncertainty in the Middle East could underpin the USD against the CHF in the near term.
The Swiss National Bank (SNB) left its main policy rate unchanged at 0% on Thursday, as widely expected by markets, keeping borrowing costs well below those seen in other major economies. The SNB also said that it is ready to intervene in foreign exchange markets if a rebound in demand for the safe-haven franc drives the currency higher.
NZD/USD remains on the defensive as the Fed’s hawkish tilt continues to underpin the USD.
US Vice President JD Vance cancels his trip for talks with Iran, keeping a lid on the optimism.
Bets for more aggressive RBNZ rate hikes could support the NZD and limit losses for the pair.
The NZD/USD pair turns lower for the third straight day following a modest Asian session uptick to the 0.5775 region and touches a fresh low since April 8 in the last hour. Spot prices currently trade just below mid-0.5700s and seem poised to register heavy weekly losses amid a bullish US Dollar (USD).
The USD Index (DXY), which tracks the Greenback against a basket of currencies, preserves its recent strength to the highest level since May 2025 in the face of the US Federal Reserve’s (Fed) hawkish tilt. In fact, policymakers projected the fed funds rate at 3.8% by the end of this year, up from 3.4% in March, implying at least one 25-basis-point (bps) rate hike in the coming months. This, to a larger extent, overshadows the US-Iran peace deal and continues to underpin the buck, which, in turn, is seen acting as a headwind for the NZD/USD pair.
Meanwhile, CNN reported that US Vice President JD Vance canceled his trip to talks with Iran in Switzerland. This further keeps a lid on the latest optimism and turns out to be another factor supporting the Greenback. However, the Reserve Bank of New Zealand’s (RBNZ) hawkish shift might hold back traders from placing aggressive bearish bets around the New Zealand Dollar (NZD) and limit losses for the NZD/USD pair. In fact, the RBNZ indicated that the OCR could reach roughly 2.85% by the end of this year, implying up to three rate hikes.
Moving ahead, the liquidity and trading volumes could remain low in the face of a US bank holiday in observance of Juneteenth National Independence Day. This further makes it prudent to wait for strong follow-through selling before positioning for an extension of the recent retracement slide from the vicinity of the 0.6000 psychological mark, or the May monthly swing high.
US Dollar Price This week
The table below shows the percentage change of US Dollar (USD) against listed major currencies this week. US Dollar was the strongest against the British Pound.
USD
EUR
GBP
JPY
CAD
AUD
NZD
CHF
USD
1.04%
1.60%
0.66%
1.11%
0.55%
1.41%
1.14%
EUR
-1.04%
0.52%
-0.37%
0.06%
-0.51%
0.36%
0.09%
GBP
-1.60%
-0.52%
-1.06%
-0.44%
-1.04%
-0.17%
-0.44%
JPY
-0.66%
0.37%
1.06%
0.45%
-0.11%
0.79%
0.47%
CAD
-1.11%
-0.06%
0.44%
-0.45%
-0.60%
0.33%
0.02%
AUD
-0.55%
0.51%
1.04%
0.11%
0.60%
0.88%
0.60%
NZD
-1.41%
-0.36%
0.17%
-0.79%
-0.33%
-0.88%
-0.27%
CHF
-1.14%
-0.09%
0.44%
-0.47%
-0.02%
-0.60%
0.27%
The heat map shows percentage changes of major currencies against each other. The base currency is picked from the left column, while the quote currency is picked from the top row. For example, if you pick the US Dollar from the left column and move along the horizontal line to the Japanese Yen, the percentage change displayed in the box will represent USD (base)/JPY (quote).
To provide the best experiences, we use technologies like cookies to store and/or access device information. Consenting to these technologies will allow us to process data such as browsing behavior or unique IDs on this site. Not consenting or withdrawing consent, may adversely affect certain features and functions.
Functional
Always active
The technical storage or access is strictly necessary for the legitimate purpose of enabling the use of a specific service explicitly requested by the subscriber or user, or for the sole purpose of carrying out the transmission of a communication over an electronic communications network.
Preferences
The technical storage or access is necessary for the legitimate purpose of storing preferences that are not requested by the subscriber or user.
Statistics
The technical storage or access that is used exclusively for statistical purposes.The technical storage or access that is used exclusively for anonymous statistical purposes. Without a subpoena, voluntary compliance on the part of your Internet Service Provider, or additional records from a third party, information stored or retrieved for this purpose alone cannot usually be used to identify you.
Marketing
The technical storage or access is required to create user profiles to send advertising, or to track the user on a website or across several websites for similar marketing purposes.