- USD/CAD pushed to a fresh 14-month high this week, dragging the Loonie to its weakest against the Greenback since early 2025.
- The slide defies firm Crude Oil prices; the Loonie’s traditional link to Crude Oil has broken down and even turned negative.
- The real drivers are a widening Canada-US rate gap and a six-week slide in Gold.
The textbook calls the Canadian Dollar a petro-currency, which means that with a Middle East war keeping Crude Oil bid, the Loonie should be holding its own. Instead it spent this week sliding to a fresh 14-month low against the Greenback, capping a run in which the US Dollar has closed higher in six of the last seven weeks. The textbook is wrong, at least for now: the Loonie has quietly stopped trading like a Crude Oil proxy, with its weakness driven by two forces that have nothing to do with the price of a barrel.
A petro-currency in name only
For years the Loonie moved with the price of a barrel; that relationship has quietly inverted. The rolling correlation between daily moves in the currency and Crude Oil has turned negative in recent months, a clean break from the historical norm. In its place, a less obvious driver has taken over: Gold. Canada is a major bullion producer; with Gold down for six straight weeks and well off its recent record, that slide has become a genuine weight on the currency. The market has swapped one commodity anchor for another; traders still watching only the barrel have missed it.
Two central banks moving apart
The second force is the one doing most of the damage: a widening gap between the Federal Reserve (Fed) and the Bank of Canada (BoC). The Fed held at 3.75% this month and revised its dot plot higher, with markets pricing a possible 2026 hike; the BoC, at 2.25%, is going nowhere. It held again this month, caught in a two-way bind between a soft domestic economy and fresh, energy-driven inflation, and has signalled no intention of moving. When one central bank is leaning toward hikes and the other is frozen, the rate spread does the talking; right now it points squarely against the Loonie. Speculative short positions on the currency have climbed to their highest in months as a result.
Outgunned, but not without a say
What makes the move striking is that this is not simply a story about Canada falling apart. The domestic picture is mixed rather than broken: a strong May jobs report sits alongside Friday’s soft retail sales; the Loonie’s slide owes more to relative positioning than to outright collapse. That also means the currency has a busier week ahead than the bears might like.
Canada’s own May Consumer Price Index (CPI) lands Monday at 12:30 GMT. With inflation already running near 3% on elevated energy costs, a hot print would feed the BoC’s inflation side and could lend the Loonie a rare bid; Governor Macklem then speaks Tuesday. The dominant event still sits south of the border: on Thursday at 12:30 GMT the US delivers its first-quarter Gross Domestic Product (GDP) third estimate alongside the May Personal Consumption Expenditures Price Index (PCE), with core PCE seen accelerating to 0.3% MoM. A hot US PCE widens the rate gap further and points USD/CAD higher still; only a genuinely hot Canadian CPI on Monday gives the Loonie much to fight back with.
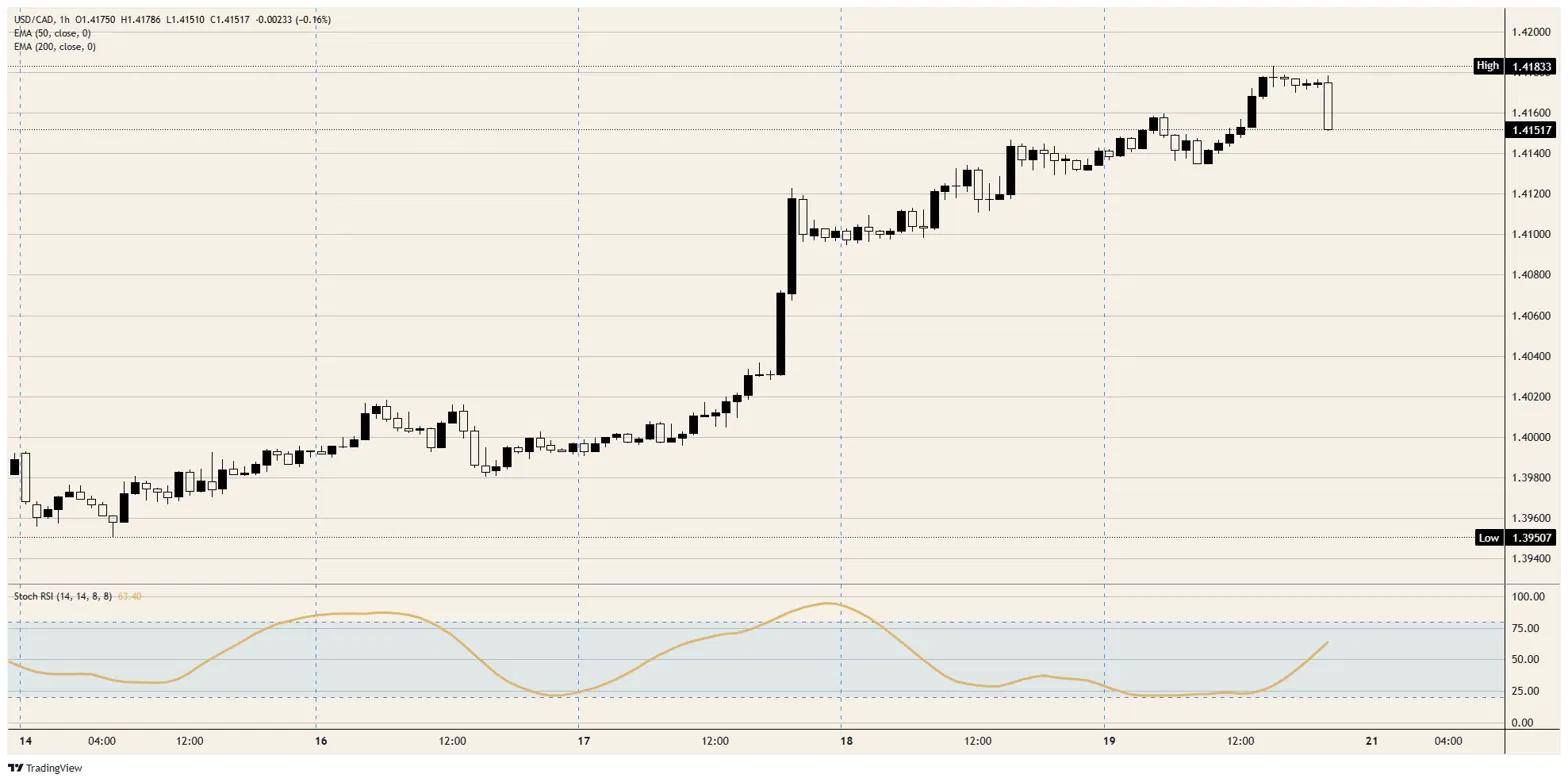
Resistance: USD/CAD is pressing the 1.4200 handle after this week’s run; a clean break opens 1.4250 and then 1.4300, levels last seen well over a year ago.
Support: Initial support sits near 1.4100, then 1.4050; only a move back below 1.4000 would suggest the Loonie has found real footing.
Bias: Higher for USD/CAD while the Fed-BoC gap widens and Gold stays heavy, meaning further Loonie weakness is the base case. The one caution is positioning: the daily Stochastic Relative Strength Index (Stoch RSI) is deep in overbought after a near-vertical climb; a sharp but shallow pullback toward 1.4100 would not surprise. A hot US PCE next week is the catalyst most likely to push the pair on toward 1.4250.
USD/CAD hourly chart