EURUSD starts today’s session in a noticeably tense yet somewhat uneven atmosphere, where the market lacks a single dominant narrative. On one side, investors are already looking ahead to the evening and the Federal Reserve’s decision, which could set the tone for the US dollar over the coming weeks. On the other side, Europe refuses to fade into the background, as fresh inflation data once again highlights that the ECB story and its future policy response to price pressures remain unresolved.
In practice, EURUSD is trading in an environment where no clear narrative has taken control. Market participants are simultaneously trying to price in the Fed, the ECB, and the widening divergence between them, which naturally increases volatility and means that any new impulse can quickly shift the balance of forces. In such a setup, the currency pair becomes particularly sensitive to changes in expectations, especially on a day filled with major macroeconomic events.
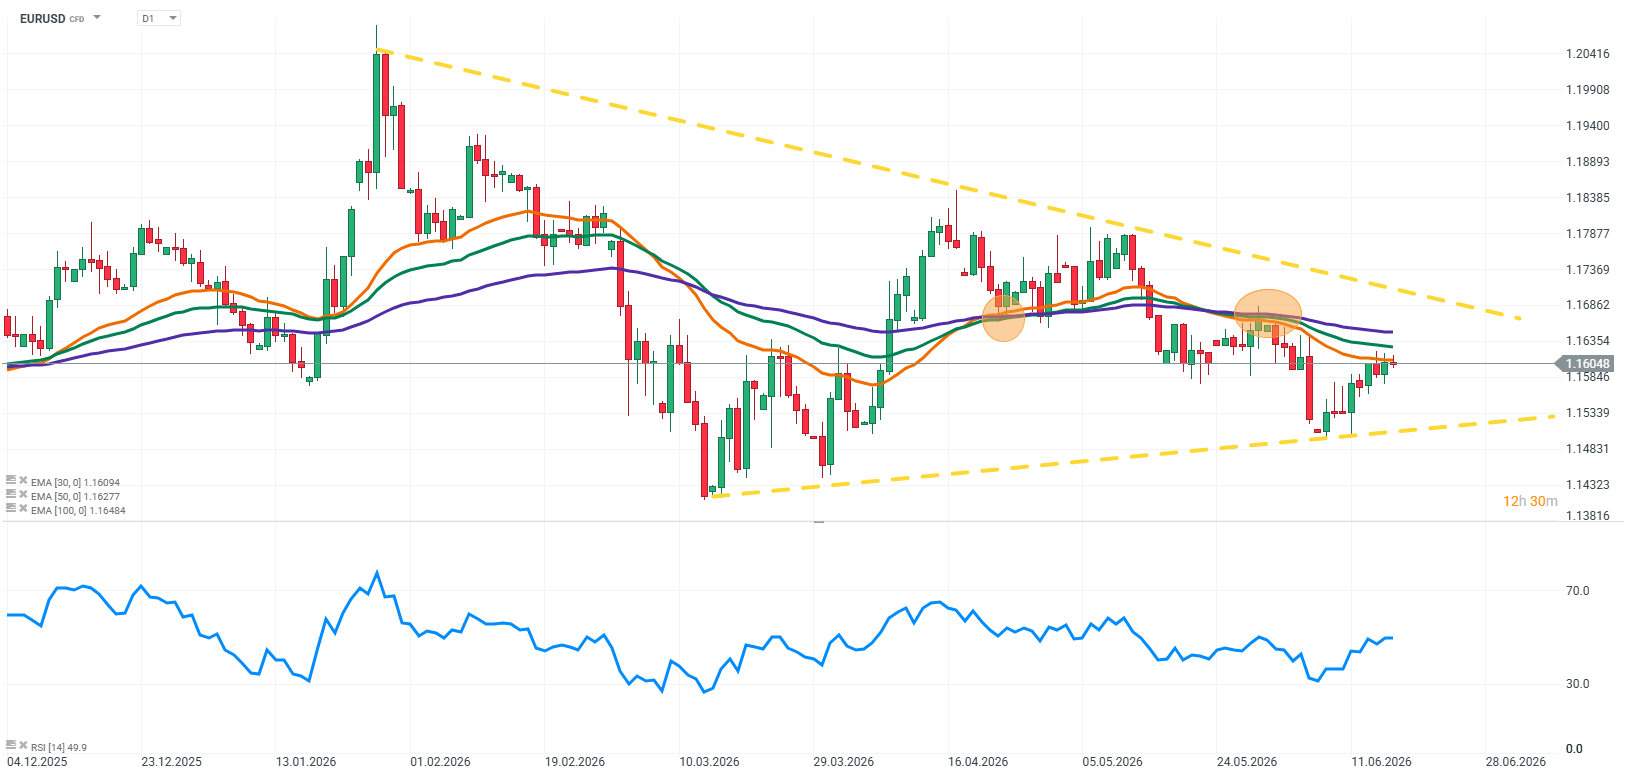
Source: xStation5
What is driving EURUSD today? Kevin Warsh’s debut and the Fed credibility test
Today’s Federal Reserve meeting carries special significance as it is the first under the leadership of Kevin Warsh. Markets are almost fully aligned in expecting interest rates to remain unchanged in the 3.50–3.75% range, but the decision itself is not the key focus. Far more important will be the tone of communication and how the new Fed Chair outlines the future path of monetary policy. Warsh takes control at a time when US inflation remains sticky and the economy continues to show relative resilience, limiting room for an early policy easing cycle. This makes today’s message potentially a directional signal for the entire Fed cycle. Even a subtle shift toward a more hawkish stance could strengthen the US dollar and add downward pressure on EURUSD.
Europe: inflation in line with forecasts, but pressure persists
On the European side, today brought the final release of May HICP inflation. The reading of 3.2% year on year came in exactly in line with consensus expectations, which helps stabilize short-term market positioning. However, it does not change the broader picture, where inflation remains elevated compared to last year. This keeps price pressures firmly on the radar of the European Central Bank. Particular attention continues to be drawn to persistent core inflation and the services component, both of which still show no clear disinflationary trend.
ECB and rising risks of further tightening
The lack of any positive surprise in inflation data leaves the ECB in a challenging position. After its recent rate hike, markets are once again reassessing whether the tightening cycle is truly over. If price pressures in services remain elevated and core inflation fails to meaningfully ease, the European Central Bank may be forced into another move later this year. Such a scenario limits the downside potential for the euro and acts as an important counterbalance to US dollar strength.
Market picture: tension between two central banks
EURUSD remains a market driven by two opposing narratives. On one side, investors are focused on the Fed and its impact on US dollar valuation. On the other, persistent inflation in Europe continues to support cautious expectations regarding the ECB. In this environment, markets become highly sensitive to central bank communication, while the technical structure of price action reinforces the sense of a fragile equilibrium, vulnerable to sharp shifts.
Key takeaways
- Today’s EURUSD session is shaped by two opposing forces that broadly offset each other
- The Fed remains the primary driver for the US dollar and could set the tone for the coming period
- Europe continues to face persistent inflation with no clear signs of meaningful easing
- The market remains in a wait-and-see mode with no dominant narrative
- The key resolution will likely come only after the evening Fed decision and press conference