The Reserve Bank of Australia (RBA) left its cash rate unchanged at 4.35% , ending a streak of three consecutive rate hikes and opting for its first pause of the year. The decision was widely expected and unanimous, but the tone of the statement remained clearly cautious. The RBA emphasized that inflation is still too high and warned that further monetary tightening remains possible if price pressures fail to ease.
Inflation remains the main concern
The RBA noted that inflation accelerated noticeably in the second half of 2025, partly due to growing demand and supply-side pressures in the economy. Although CPI inflation declined to 4.2% in April , it remains well above the RBA’s 2–3% target range , while underlying inflation also remains elevated. Key inflation risks include:
- Higher fuel and energy prices feeding through into transportation, food, construction materials, and services costs.
- Businesses passing higher input costs on to consumers.
- Persistently high inflation in the services sector.
- Wage pressures, including recent increases in the minimum wage and regulated salaries.
- Uncertainty regarding the pace of normalization in global oil supplies.
The RBA’s primary concern is that the energy-driven inflation shock could become entrenched.
Slowing economy gives the RBA room to pause
The main argument for keeping rates unchanged was weaker economic activity data. Australia’s economy expanded by just 0.3% q/q in the first quarter , compared with 0.9% in Q4 2025 , largely due to softer consumer spending. Households are facing increasing pressure from higher mortgage repayments, rising living costs, and declining savings. The labor market has also started to cool. The unemployment rate rose to 4.5% , its highest level in several years, although the RBA noted that broader labor market indicators remain relatively resilient. At the same time, the slowdown is not yet severe enough to justify a shift in policy direction.
Monetary policy outlook: a pause, not a pivot toward easing
The RBA’s message is clear: the current decision represents a pause to assess incoming data, not the end of the tightening cycle. In other words, it is a classic
hawkish hold :
- Interest rates remain at 4.35% .
- The RBA wants to assess the impact of previous rate hikes.
- Inflation remains too high to consider easing policy.
- Oil and energy prices remain significant upside risks to inflation.
- Further rate hikes remain possible if price pressures prove persistent.
Nevertheless, most major Australian banks expect rates to remain at 4.35% , with potential rate cuts not arriving until 2027 . Westpac remains the most hawkish, forecasting two additional rate hikes this year , which would lift the cash rate to 4.85% .
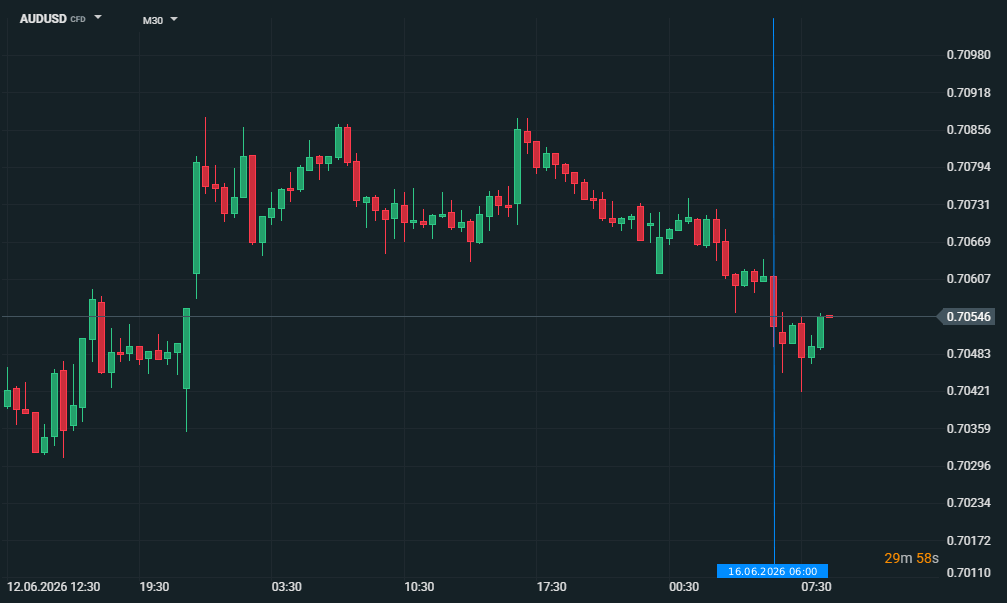
AUD reaction
The Australian dollar weakened following the RBA decision, suggesting that investors interpreted the rate hold as reducing the near-term probability of another hike. AUDUSD fell from around 0.7060 to 0.7050 immediately after the announcement, losing approximately 0.3% on the day . The reaction was relatively modest because the decision itself was fully anticipated by markets. However, the decline in the currency indicates that investors placed greater weight on the pause and signs of economic slowing than on the RBA’s warnings that further rate increases remain possible.