- The Indian Rupee rises at open against the US Dollar at the start of the RBI policy and the US NFP week.
- Oil prices rebound due to the exchange of attacks between Israel and Lebanon.
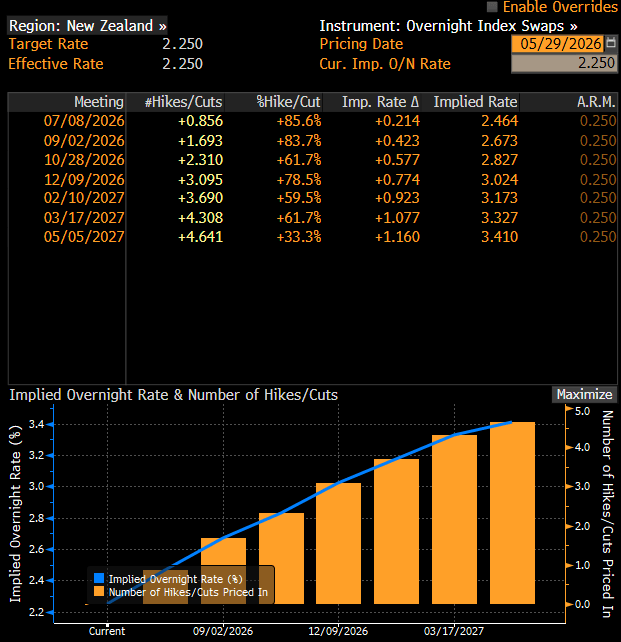
- The RBI is expected to leave interest rates unchanged on Friday.
The Indian Rupee (INR) opens on a positive note against the US Dollar (USD) at the start of the Reserve Bank of India (RBI) policy week. The USD/INR pair slides to near 94.78 as the Indian currency strengthens further amid solid hopes over the United States (US)-Iran permanent peace deal, even as oil prices have bounced back.
At press time, the WTI Oil price trades 2% higher to near $89.00 after registering over-a-month low at $85.41 on Friday. Theoretically, currencies from economies, such as India, which rely heavily on oil imports to meet their energy needs, tend to underperform when oil prices recover.
Oil prices have regained ground, following attacks from Israeli Defense Forces (IDF) in Lebanon on Iran-backed Hezbollah, which renewed fears of an energy supply crisis.
US President Trump revises terms for Iran deal
The comments from US and Iranian officials clearly state that negotiations toward a permanent peace deal are ongoing, and Washington doesn’t want Tehran to have nuclear weapons in any way.
US President Donald Trump said in an interview with Fox News over the weekend that Washington wants to make sure Iran neither develops nuclear weapons nor purchases them before reaching a deal, adding that he has inculcated tougher terms for Iran relating to nukes and the Strait of Hormuz. “So now [the agreement] says, ‘We will not develop or in any way purchase a military weapon,” Trump said.
After US President Trump’s interview, Iran’s Foreign Minister Abbas Araghchi said that negotiations with Washington were ongoing, and any deal could not be judged before a definitive outcome is reached, Reuters reported.
RBI policy and India’s Q1 GDP data awaited
This week, key triggers for the Indian currency will be the RBI’s monetary policy announcement and the Q1 GDP data, which will be released on Friday. According to the latest Reuters poll, the RBI will hold its key Repo Rate unchanged at 5.25% and deliver a hawkish stance on the monetary policy outlook, as high oil prices due to the energy supply crisis have prompted inflationary pressures globally.
The poll also showed that a majority of economists anticipated at least one interest rate hike by the year-end.
Over the weekend, India’s Finance Ministry warned that a depreciating Indian Rupee, higher energy prices, and below-average expected monsoon pose a threat to nation’s inflation outlook.
US NFP will be key trigger for US Dollar
The US Dollar starts the week with a mild bullish tone, with investors awaiting key US labor market and economic activity data releases, especially the Nonfarm Payroll (NFP) data, which will be released on Friday.
The impact of the US NFP data is expected to be limited on the Federal Reserve’s (Fed) monetary policy outlook, unless there is a dramatic change, as the latest comments from policymakers have shown that they are more concerned about high inflation than weak job demand.
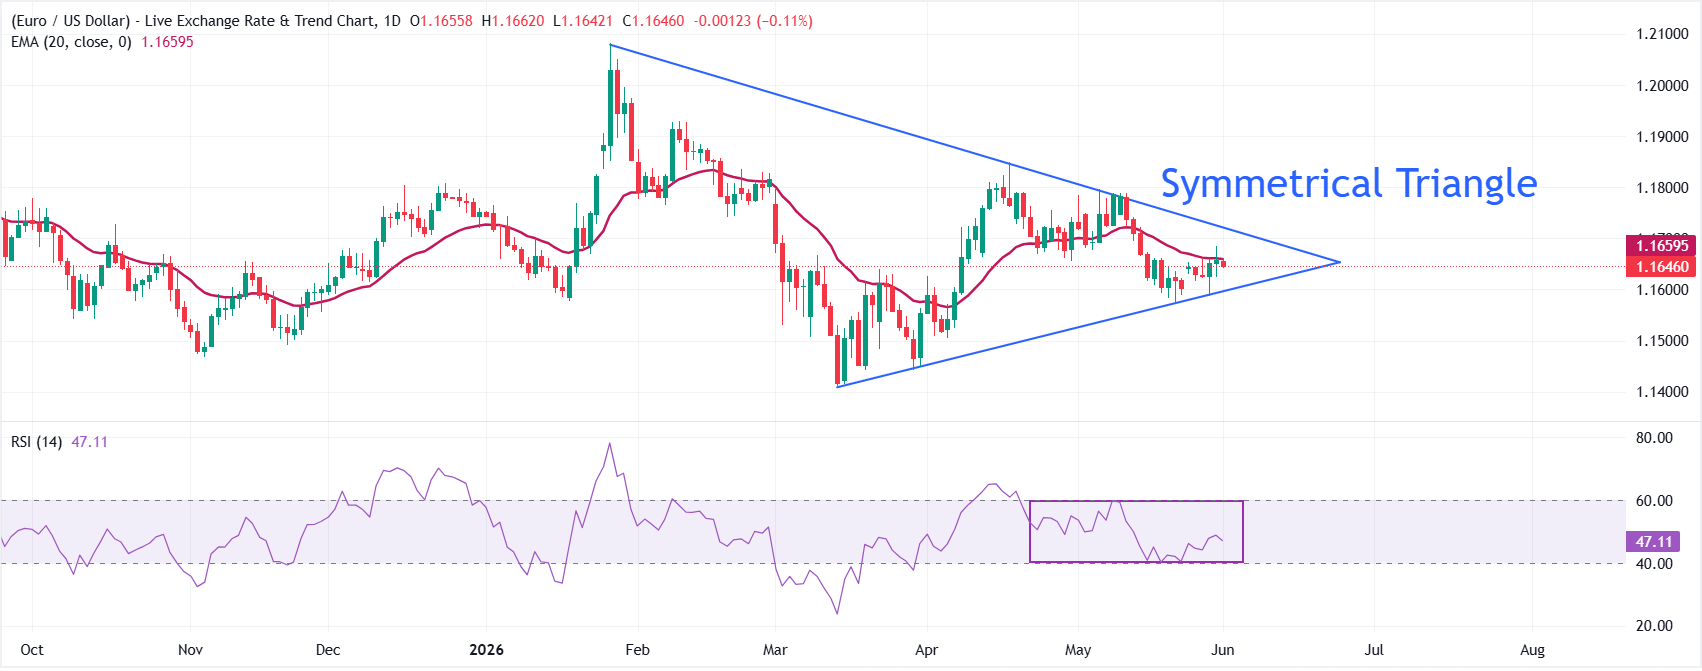
Technical Analysis: USD/INR settles below 20-day EMA
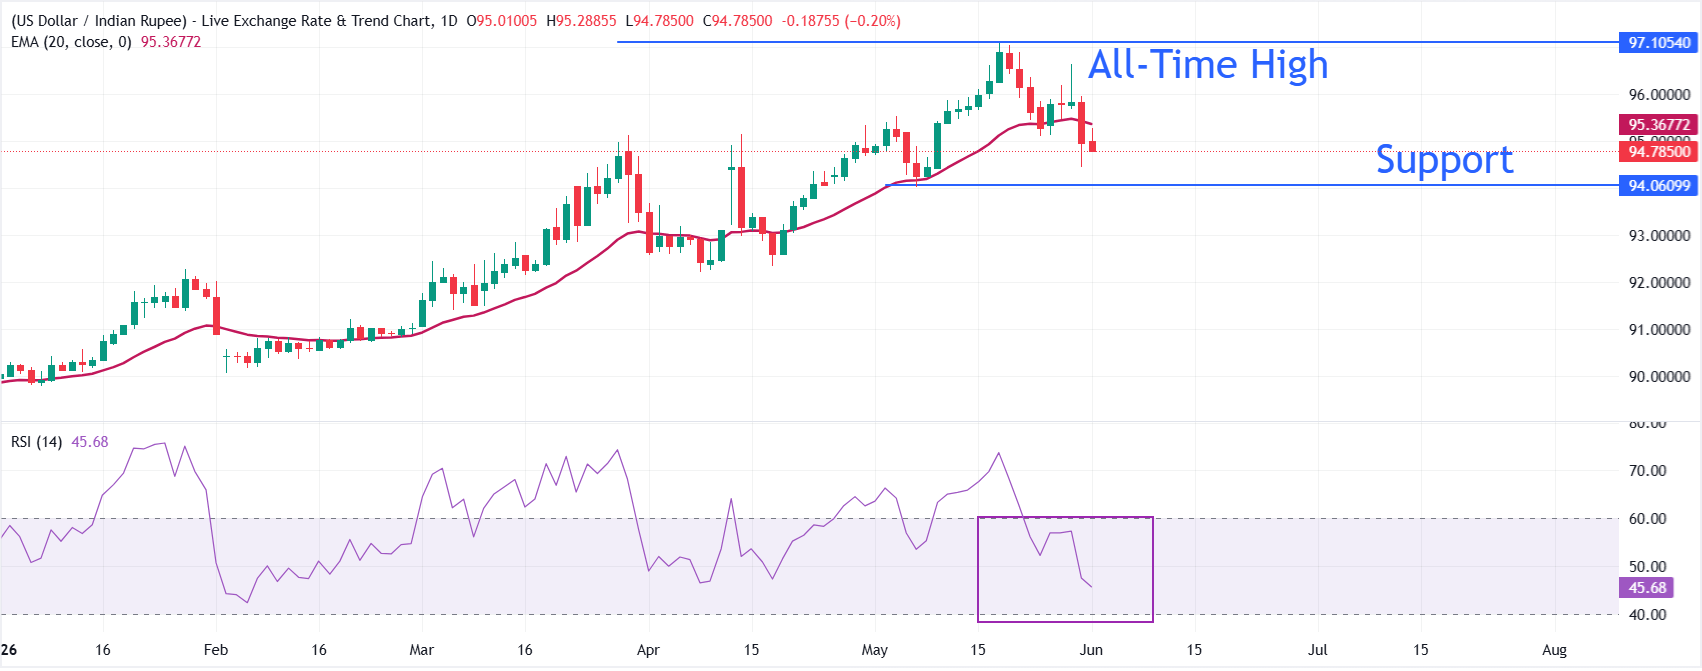
USD/INR trades lower at around 94.78, holding below the 20-day exponential moving average (EMA) at 95.3677 and keeping a mild bearish near-term bias.
The pair has slipped away from recent highs, and with price capped beneath this short-term EMA, rallies appear vulnerable to selling while the Relative Strength Index (RSI) at 45.7 drifts below the neutral 50 line, hinting at waning upside momentum rather than outright oversold conditions.
On the topside, initial resistance is defined by the 20-day EMA at 95.37, and a sustained break above this barrier would be needed to ease immediate downside pressure and open the way toward 96.00. Looking down, the pair could extend its decline towards May 7 low at around 94.00