- USD/JPY edges up to near 159.32 as the Japanese Yen trades with caution.
- Tokyo CPI ex. Fresh Food grew at a moderate pace of 1.3% YoY in May.
- Japan’s FM Katayama warned that authorities could intervene in the forex market to counter excessive volatility.
The USD/JPY pair trades marginally higher to near 159.32 during the Asian trading session on Friday. The pair edges up as the Japanese Yen (JPY) trades cautiously, following the release of the Tokyo Consumer Price Index (CPI) data for May and verbal intervention warning from Japan’s Finance Minister (FM) Satsuki Katayama.
Tokyo’s CPI ex. Fresh Food, which is closely tracked by Bank of Japan (BoJ) officials, arrived lower at 1.3% Year-on-Year (YoY), lower than estimates and the previous reading of 1.5%. The CPI data ex. Fresh Food stayed below the BoJ’s 2% target for a fourth straight month as fuel and education subsidies offset rising raw material costs from the U.S.-Israeli war on Iran, Reuters reports.
Meanwhile, Japan’s FM Katayama warned that authorities could intervene in the foreign exchange (Forex) market to counter excessive volatility against the Japanese Yen.
As of writing, the US Dollar Index (DXY), which tracks the Greenback’s value against six major currencies, trades slightly higher to near 99.00, but is close to Thursday’s low, which is 98.95.
On Thursday, the US Dollar faced a sharp selling pressure after media reports that a deal between the United States (US) and Iran has been prepared and only needs approval from President Donald Trump.
USD/JPY technical analysis
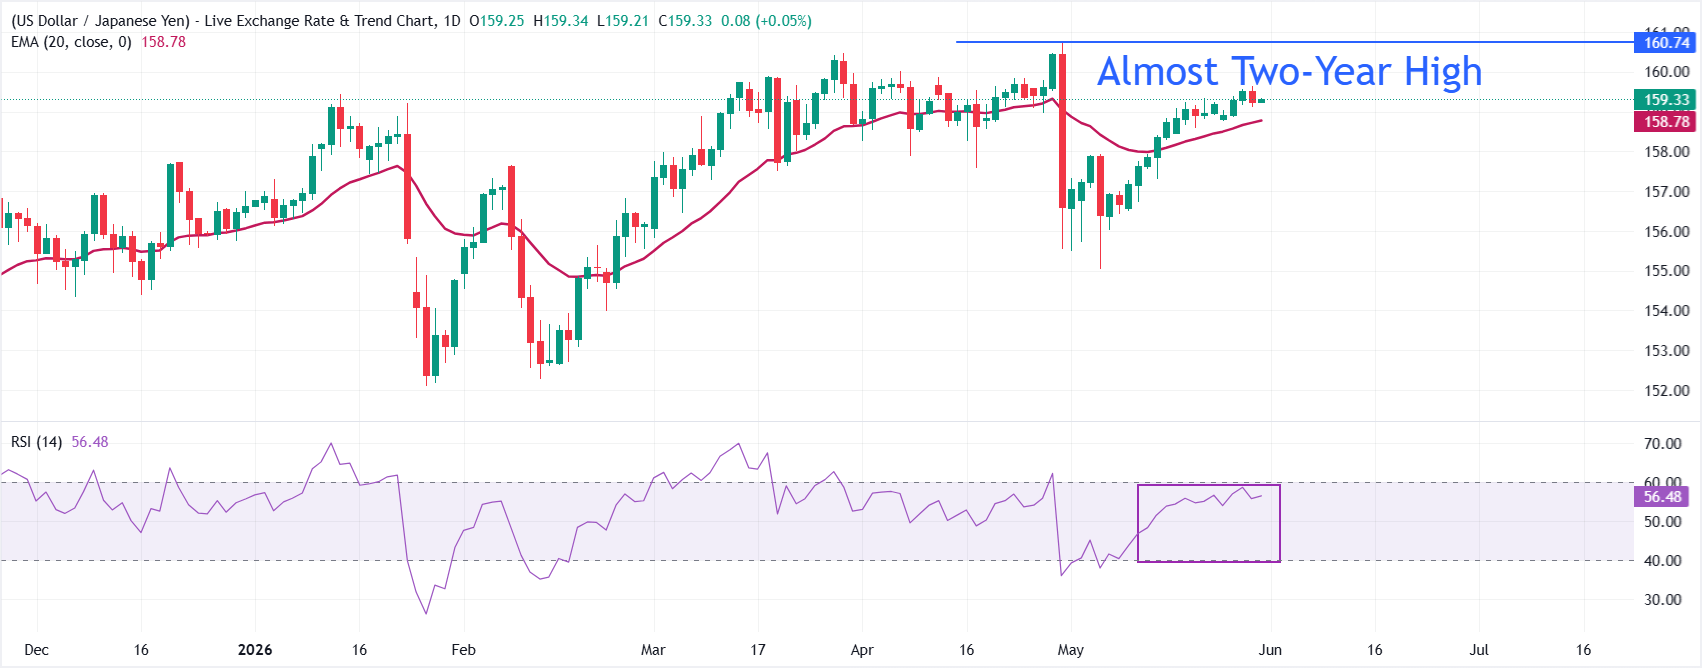
USD/JPY ticks higher at around 159.32 in the Asian trade. The pair holds a constructive bullish bias as spot remains above the 20-day exponential moving average (EMA) at 158.78, keeping the short-term trend underpinned despite recent volatility.
The Relative Strength Index (RSI) near 56 suggests moderate upside momentum rather than overbought conditions, allowing room for further gains while price stays supported above the EMA.
On the downside, immediate support is seen at the 20-day EMA around 158.78, where buyers are likely to defend the short-term uptrend; a decisive break below this area would expose a deeper corrective move towards the May 6 high at 157.94. Looking up, the pair aims to revisit an almost two-year high at 160.74