AUD/JPY attracts some sellers near 112.75 in Tuesday’s early European session.
The cross keeps a mildly bullish vibe, but further consolidation cannot be ruled out with RSI holding below the midline.
The first upside barrier emerges at 113.40; the initial support level to watch is 112.70.
The AUD/JPY cross trades in negative territory around 112.75 during the early European trading hours on Tuesday. The Japanese Yen (JPY) strengthens against the Australian Dollar (AUD) as traders are on high alert for currency intervention from Japanese authorities. Japan’s Chief Cabinet Secretary Minoru Kihara said on Tuesday that he will take appropriate action against the foreign exchange moves if needed.
On the other hand, a hawkish interest rate hold from the Reserve Bank of Australia (RBA) might underpin the Aussie. The Australian central bank decided to leave the Official Cash Rate (OCR) unchanged at 4.35% after its June monetary policy meeting last week. Despite pausing the interest rates, the board members signaled that further rate hikes might be necessary to achieve its goals.
Technical Analysis:
In the daily chart, AUD/JPY retains a mildly constructive bias while it holds above the 100-day Simple Moving Average (SMA) and the lower Bollinger Band, suggesting underlying demand remains in place despite the recent pullback from the highs. The Relative Strength Index (RSI) at 43.6 leans slightly bearish but not oversold, hinting more at consolidation than a decisive reversal as price oscillates within the upper half of its broader Bollinger envelope.
On the topside, initial resistance is aligned with the Bollinger middle band at 113.40, and a sustained break above this area would open the door for a retest of the upper Bollinger Band around 114.78. On the downside, the immediate focus is on the 100-day SMA at 112.20 ahead of the lower Bollinger Band at 112.00, where buyers would be expected to show more interest if the pullback deepens.
USD/JPY holds steady following the previous day’s late pullback from the 162.00 neighborhood.
Intervention fears keep the JPY bears on the back foot and act as a headwind for spot prices.
Economic concerns and the wide US-Japan rate differential offer support amid a bullish setup.
The USD/JPY pair enters a bullish consolidation phase during the Asian session on Tuesday and currently trades just above 161.50 amid mixed fundamental cues. Spot prices, however, remain well within striking distance of a 40-year peak, around the 162.00 neighborhood set in July 2024, as traders remain on edge amid fears that Japanese authorities will step in to prop up the Japanese Yen (JPY).
Local broadcaster TBS reported that Japan’s Finance Minister Katayama held an online meeting with US Treasury Secretary Bessent to discuss the JPY’s sharp decline and potential intervention. Adding to this, Japan’s Chief Cabinet Secretary Minoru Kihara said that he will take appropriate action against the foreign exchange (FX) moves if needed. This holds back JPY bears from placing fresh bets and caps the upside for the USD/JPY pair.
However, economic risks stemming from the Middle East conflict and energy supply disruptions through the Strait of Hormuz continue to undermine the JPY. Apart from this, a persistently wide Japan-US rate differential keeps the JPY bulls on the back foot. The US Dollar (USD), on the other hand, stands firm near its highest level since May 2025, lending additional support to the USD/JPY pair.
Last week’s sustained breakout through the previous intervention zone, around the 160.50-160.60 area, comes on top of the recent solid bounce from the 200-day Exponential Moving Average (EMA) and keeps the broader uptrend intact. That said, the Relative Strength Index (14) is hovering in overbought territory near 70, which hints at risk of consolidation or a corrective pause rather than a confirmed near-term top for the USD/JPY pair.
Meanwhile, the Moving Average Convergence Divergence (MACD) indicator remains positive above the zero line, reinforcing the underlying upward pressure. In the meantime, the structural pivot around 160.60-160.50 should protect the immediate downside. Moreover, the 200-day EMA at 156.47 should provide a deeper layer of trend support if a sharper corrective pullback unfolds amid elevated RSI readings.
(The technical analysis of this story was written with the help of an AI tool.)
USD/JPY daily chart
Japanese Yen Price Last 30 days
The table below shows the percentage change of Japanese Yen (JPY) against listed major currencies last 30 days. Japanese Yen was the strongest against the New Zealand Dollar.
USD
EUR
GBP
JPY
CAD
AUD
NZD
CHF
USD
1.73%
1.49%
1.66%
2.90%
2.62%
3.16%
2.85%
EUR
-1.73%
-0.24%
-0.09%
1.12%
0.88%
1.42%
1.11%
GBP
-1.49%
0.24%
0.21%
1.43%
1.16%
1.68%
1.39%
JPY
-1.66%
0.09%
-0.21%
1.17%
0.99%
1.51%
1.10%
CAD
-2.90%
-1.12%
-1.43%
-1.17%
-0.17%
0.33%
-0.04%
AUD
-2.62%
-0.88%
-1.16%
-0.99%
0.17%
0.53%
0.22%
NZD
-3.16%
-1.42%
-1.68%
-1.51%
-0.33%
-0.53%
-0.31%
CHF
-2.85%
-1.11%
-1.39%
-1.10%
0.04%
-0.22%
0.31%
The heat map shows percentage changes of major currencies against each other. The base currency is picked from the left column, while the quote currency is picked from the top row. For example, if you pick the Japanese Yen from the left column and move along the horizontal line to the US Dollar, the percentage change displayed in the box will represent JPY (base)/USD (quote).
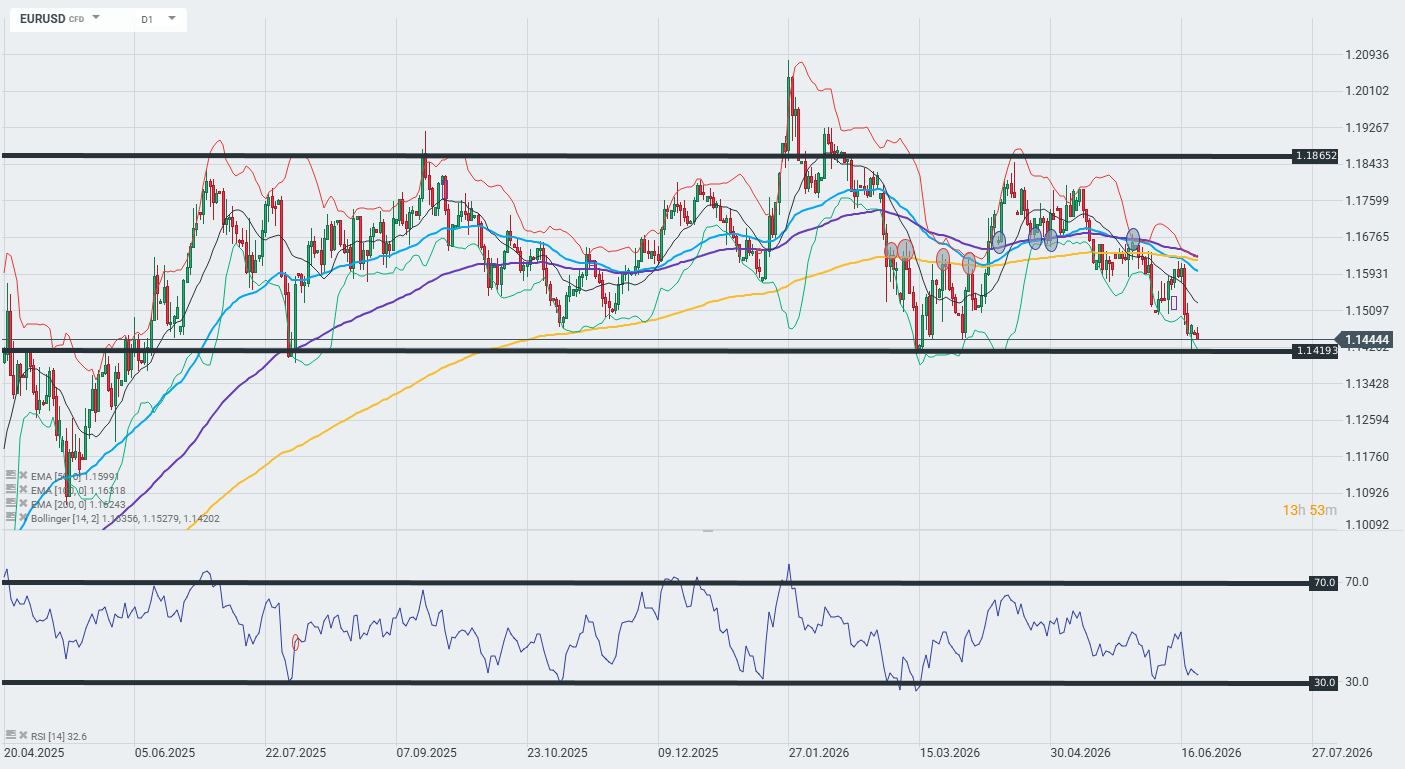
EUR/USD: The dollar takes centre stage — geopolitics, the Fed and the ECB are driving the pair EUR/USD has come under strong selling pressure, testing key support around 1.1440–1.1420 — a level clearly visible on the chart as a broad, horizontal zone of demand, which has repeatedly halted sell-offs over recent months.
Geopolitics: the US–Iran relationship and the Strait of Hormuz
Today, 22 June, technical talks are taking place in Switzerland between the US, Iran, Pakistan and Qatar, and both sides have agreed on a ‘roadmap’ to finalise the agreement within 60 days. However, tensions remain due to the fact that Iran has once again closed the Strait of Hormuz just before the talks began, and Trump is not backing down from his threats to resume attacks — this is fuelling volatility in the energy markets and limiting the euro’s appreciation. Geopolitical de-escalation is, in theory, a tailwind for the euro (capital outflows from safe-haven assets such as the USD), but until the negotiations are concluded, it will be difficult to weaken the dollar on a sustained basis.
Fed: Are we expecting rate hikes?
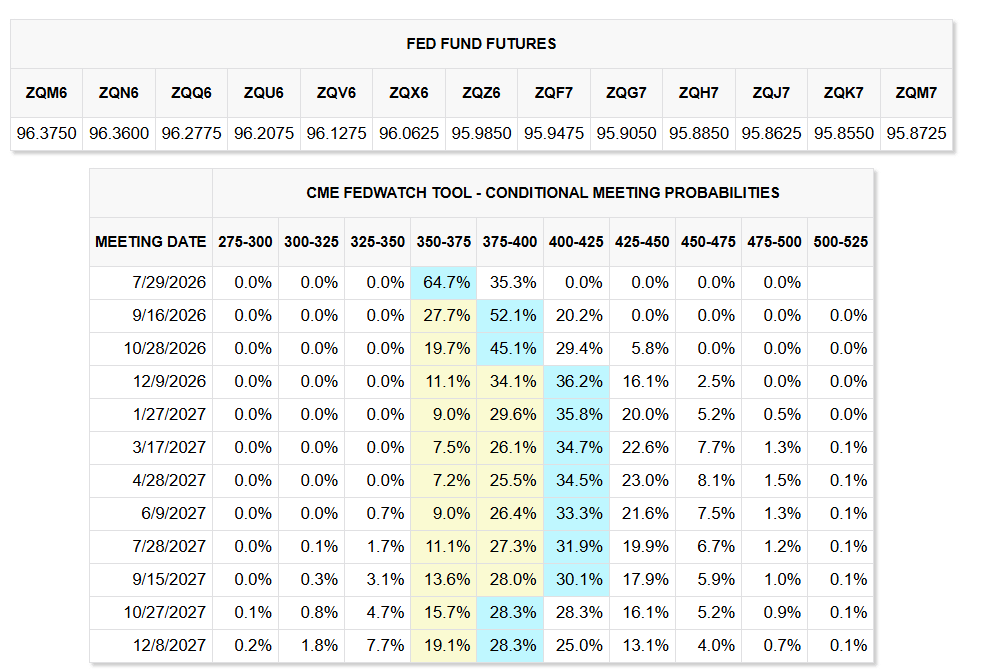
The Fed Fund Futures table and the CME FedWatch Tool clearly show how expectations have evolved. For the upcoming meeting on 29 July 2026 the market is pricing in a 64.7% probability that rates will remain in the 350–375 bps range, whilst the chances of a rise to 375–400 bps stand at 35.3%. At its meeting on 16–17 June 2026 — the first chaired by the new Fed chair, Kevin Warsch — the FOMC unanimously kept rates at 3.50–3.75% , leaving them unchanged for the fourth consecutive time. However, this is not the main news. The key message comes from the new dot-plot projections: 9 out of 18 Fed officials now expect at least one rate hike in 2026, whilst 6 of them anticipate two or more hikes — this is a dramatic shift from March, when none of the committee members had forecast any rises.
The media projection for the interest rate at the end of 2026 now stands at 3.8% — 0.16 percentage points above the current level — which the market interprets as a clear shift towards tightening. Inflationary pressure, fuelled by a surge in oil prices resulting from the US–Iran conflict, has forced the Fed to revise its stance: almost half of the FOMC does not believe that simply maintaining interest rates will be sufficient to bring inflation down to the 2% target.
Derivatives markets are already pricing in ~60% chance of at least one rate rise before the end of the year , with the highest probability at the September or October meeting. This is fundamentally a bullish environment for the dollar — and directly explains the pressure on EUR/USD visible on the chart. The prospect of higher US interest rates, coupled with divergence from the ECB (deposit rate of 2.25%), is widening the yield spread in favour of the USD. The Fed Funds Futures table confirms this picture: from the December 2026 meeting onwards, the probability of rates in the 400–425 bps range is increasing, which means that the market is gradually pricing in a cycle of rate rises — not cuts.
ECB: The rate rise is a backdrop, not a catalyst
On 11 June, the ECB raised the deposit rate by 25 basis points to 2.25% — in line with expectations. The bank also raised its inflation forecast for 2026 to 3.0% from the previous 2.6%. However, this move had already been fully priced in by the market and does not provide direct support for the EUR — as can be seen in the chart, where the pair continues to weaken despite the rate rise. The interest rate differential between the Fed (4.25–4.50 per cent) and the ECB (2.25 per cent) continues to strongly favour the dollar, and the ECB’s rate rise alone does not alter this arithmetic to a sufficient extent.
What can be seen on the EUR/USD D1 chart
The EUR/USD daily chart shows the pair testing critical support at ~1.1420–1.1444 — a level that has been defended several times by the bulls since spring 2025. The RSI(14) at 32.6 is close to the oversold zone (the 30 threshold), signalling a potential technical rebound. However, the moving average configuration is bearish: the price has broken below the EMA50 (1.1599) and the EMA100 (1.1682) and is approaching the EMA200 (1.1824) from below — all three moving averages above the price are forming dynamic resistance. The Bollinger Bands indicate the lower band at 1.1420, which coincides with the support zone.
Outlook for the coming days:
If the 1.1420 support level holds and US–Iran talks confirm progress, the RSI may rebound and the pair could move back towards 1.15–1.16. A break below 1.1420 would pave the way for a test of 1.13+. As long as the Fed remains ‘hawkish-cautious’ and negotiations on the Middle East front remain volatile, any rebound in the EUR is likely to be short-lived.
GBP/USD trades lower to near 1.3220 on renewed UK political uncertainty.
US President Trump says UK PM Starmer could resign on failing to fix immigration and energy issues.
The Fed is expected to deliver at least two interest rate hikes this year.
The GBP/USD pair recovers some of its early losses, but is still 0.1% down to near 1.3220 during the early European trading session on Monday. The pair remains under pressure amid renewed United Kingdom (UK) political uncertainty after comments from United States (US) President Donald Trump that Prime Minister (PM) Keir Starmer could resign on failing to fix immigration and energy issues.
“Keir Starmer will resign as Prime Minister of The United Kingdom. He failed badly on two very important subjects- IMMIGRATION AND ENERGY (OPEN NORTH SEA OIL!). I wish him well!,” US President Trump wrote in a post on Truth Social.
Meanwhile, calls from Labour lawmakers against PM Starmer continuing UK leadership have also accelerated, following Andy Burnham’s strong win in the Makerfield constituency in north-west England.
A Reuters report has shown that UK PM Starmer could decide as early as Monday whether to remain in office and fight a leadership contest or begin the process of stepping down.
Also, an upbeat US Dollar (US) due to increased expectations that the Federal Reserve (Fed) could deliver two interest rate hikes this year is also keeping Cable under pressure. According to the CME FedWatch tool, the odds of the Fed delivering at least two interest rate hikes this year is 58.5%, a sharp increase from 17.1% seen a week ago.
Hawkish Fed bets have strengthened following the first monetary policy announcement on Wednesday under new Chairman Kevin Warsh.
GBP/USD technical analysis
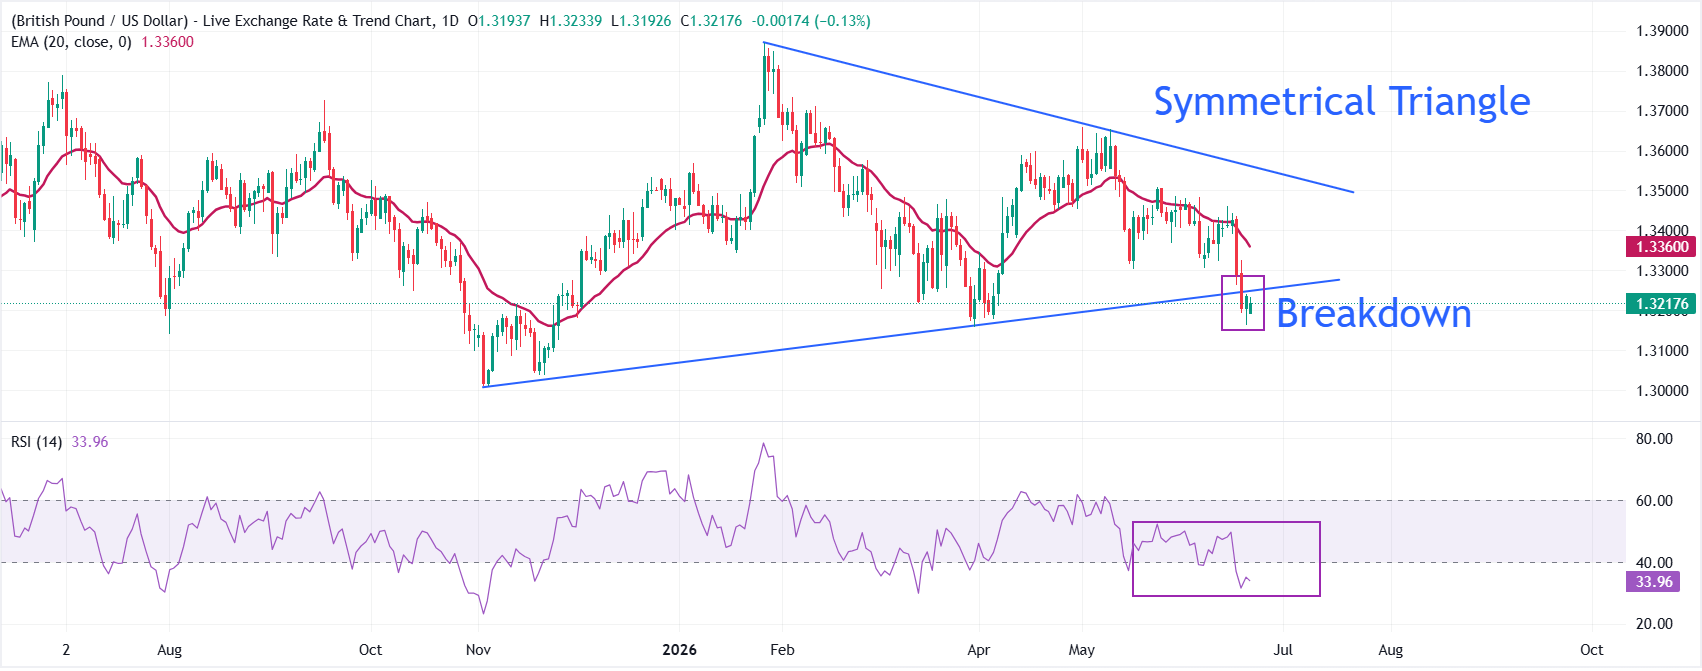
Bias: GBP/USD trades lower at around 1.3218 at press time. The pair maintains a bearish near-term tone as it holds below the 20-period Exponential Moving Average (EMA) at 1.3360. Also, a breakdown of the Symmetrical Triangle strengthens the bearish bias. The Relative Strength Index (RSI) near 34 hovers just above oversold territory, hinting at a dominant downside momentum.
Resistance: On the topside, initial resistance is seen at the broken rising trend-line region near 1.3250, followed by the 20-period EMA at 1.3360.
Support: On the downside, the pair could slide towards the November 25 low at 1.3096 if it resumes its decline below the June 19 low at 1.3163. The pair could extend its decline towards the psychological support at 1.3000 once it falls below 1.3096.
EUR/USD declines to near 1.1465 in Monday’s early European session.
The pair keeps the bearish vibe, downside pressure prevails with RSI holding below the midline.
The first downside target to watch is 1.1450; the immediate resistance level emerges at 1.1570.
The EUR/USD pair loses ground to around 1.1465 during the early European session on Monday. The uncertainty surrounding the US-Iran peace deal, following threats from President Donald Trump to restart the war in the Middle East, weighs on the riskier assets such as the Euro (EUR) against the US Dollar (USD).
On Monday, Qatar and Pakistan issued a joint statement on the conclusion of negotiations between the US and Iran in Bürgenstock, Switzerland, saying that talks were conducted in a positive, constructive atmosphere. Meanwhile, Pakistani and Qatari mediation yields significant progress to end the Lebanon conflict, adding that oil and petrochemical exports are exempt, the blockade is removed, some frozen assets are freed, and a major reconstruction and development plan is initiated for Iran.
On the other hand, hawkish remarks from European Central Bank (ECB) officials might help limit the USD’s losses. On Friday, ECB policymaker and the head of Belgium’s central bank, Pierre Wunsch, said that the central bank may raise interest rates one more time as soon as next month if it sees more evidence of Eurozone inflation spreading beyond energy.
The ECB’s deposit rate currently stands at 2.25%, and financial markets expect additional 25 basis point hikes in September or October, possibly followed by one more in the early months of next year.
Technical Analysis:
In the daily chart, EUR/USD keeps a clear bearish bias as spot holds well below the 100-day simple moving average (SMA) and the Bollinger middle band. Price is nearing the lower Bollinger band support while the Relative Strength Index (RSI) at about 34 drifts towards oversold territory, which suggests persistent downside pressure but also warns that selling momentum could start to fatigue near current levels.
On the downside, the immediate cushion emerges at the lower Bollinger band near 1.1450; a sustained break under this level would open the door toward fresh lows in the broader downtrend. On the topside, initial resistance is seen at the Bollinger middle band around 1.1570, followed by the 100-day SMA at 1.1665 and the upper Bollinger band near 1.1695, with the pair needing to reclaim at least the mid-band to ease the prevailing bearish tone.
The week ahead will bring a fresh test for major currency pairs as investors digest the first Federal Reserve (Fed) policy decision under Chair Kevin Warsh and look ahead to the United States (US) Personal Consumption Expenditures (PCE) data, global PMI releases, and central-bank commentary.
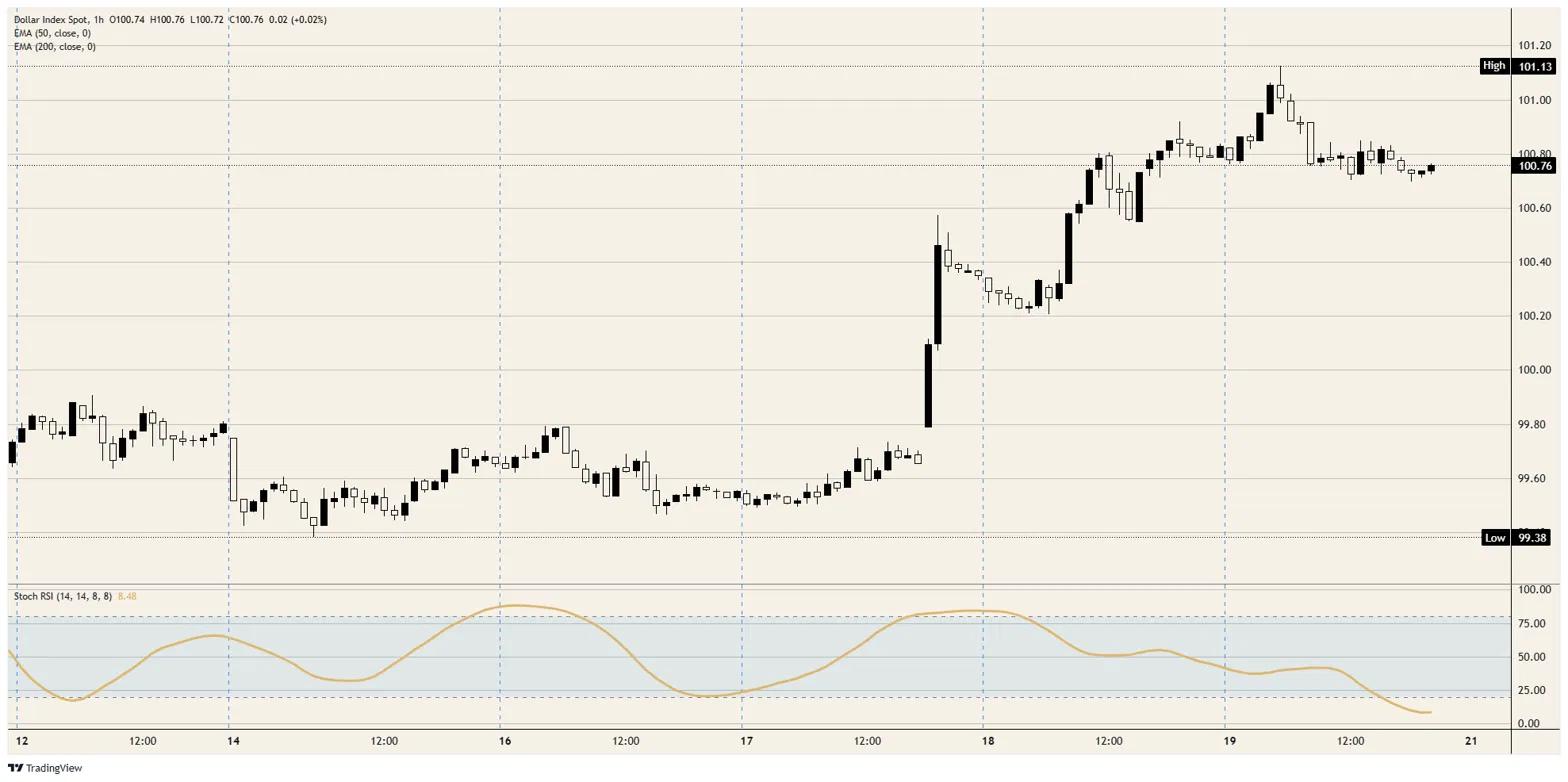
The US Dollar Index (DXY) trades near the 100.70 price zone on Friday after reaching a 13-month high of 101.13 earlier in the day. The Greenback rose sharply this week following the Fed’s decision to leave interest rates unchanged in the 3.50%-3.75% range, and removing its previous reference to “additional rate adjustments” . A hotter-than-expected PCE report, the Fed’s favorite inflation gauge, could reinforce the Fed’s hawkish stance and extend the upward USD’s trend.
US Dollar Price Today
The table below shows the percentage change of US Dollar (USD) against listed major currencies today. US Dollar was the strongest against the Swiss Franc.
USD
EUR
GBP
JPY
CAD
AUD
NZD
CHF
USD
-0.16%
-0.22%
-0.06%
0.25%
-0.02%
0.23%
0.28%
EUR
0.16%
-0.05%
0.13%
0.41%
0.14%
0.37%
0.44%
GBP
0.22%
0.05%
0.17%
0.45%
0.21%
0.44%
0.50%
JPY
0.06%
-0.13%
-0.17%
0.30%
0.06%
0.27%
0.33%
CAD
-0.25%
-0.41%
-0.45%
-0.30%
-0.22%
-0.03%
0.03%
AUD
0.02%
-0.14%
-0.21%
-0.06%
0.22%
0.21%
0.30%
NZD
-0.23%
-0.37%
-0.44%
-0.27%
0.03%
-0.21%
0.05%
CHF
-0.28%
-0.44%
-0.50%
-0.33%
-0.03%
-0.30%
-0.05%
The heat map shows percentage changes of major currencies against each other. The base currency is picked from the left column, while the quote currency is picked from the top row. For example, if you pick the US Dollar from the left column and move along the horizontal line to the Japanese Yen, the percentage change displayed in the box will represent USD (base)/JPY (quote).
EUR/USD declined over 0.80% this week to the 1.1480 level amid a broadly strong US Dollar. The Eurozone calendar will keep its eyes on flash PMI data, which should give investors a clearer view of whether activity remains fragile across manufacturing and services. Germany will also be important, with flash PMIs, the Ifo Business Climate survey, and GfK Consumer Confidence due during the week. Any signs of weaker German business sentiment could weigh on the Euro, especially after ECB officials warned about uncertainty around energy prices, inflation transmission, and second-round wage effects.
GBP/USD is trading near 1.3230, with a strong weekly decline, after the Bank of England (BoE) left interest rates unchanged at 3.75% in a 7-2 vote, with two policymakers supporting a hike to 4.00%. Next week, the United Kingdom (UK) flash PMIs and final Q1 Gross Domestic Product (GDP) data will be key for the Pound Sterling.
USD/JPY remains near intervention levels at 161.30, focused on the balance between Fed caution and the Bank of Japan’s (BoJ) tightening bias. The BoJ recently raised interest rates to 1.00%, while officials continue to warn that inflation risks could require further action. Japan’s flash PMIs, Tokyo CPI, and comments from BoJ officials will be watched closely.
AUD/USD fell this week toward the 0.7020 level, a significant domestic test as Australia releases flash PMIs, monthly CPI, and labor market data. A stronger CPI print or resilient employment data could support the Aussie, while weaker numbers may leave AUD/USD vulnerable to renewed US Dollar strength.
Gold (XAU/USD) struggles near the $4,155 level as geopolitical uncertainty and concerns over the Middle East could limit downside for the precious metal.
West Texas Intermediate (WTI) Oil fell for a second consecutive week near $76.50 per barrel as the US-Iran agreed a peace deal, weighing on Oil prices. Markets will watch whether Oil flows continue to normalize, as lower energy prices could ease inflation fears and influence central-bank expectations.
Anticipating economic perspectives: Voices on the horizon
Monday, June 22
ECB President Lagarde
Fed’s Waller
ECB President Lagarde
Tuesday, June 23
ECB’s Lane
BoC Governor Macklem
ECB’s Elderson
ECB’s Vujčić
BoE’s Taylor
BoE’s Dhingra
Wednesday, June 24
ECB’s Nagel
BoE’s Breeden
ECB’s Cipollone
BoE’s Dhingra
Thursday, June 25
ECB’s Philip
ECB’s Cipollone
Fed’s Williams
Fed’s Goolsbee
Friday, June 26
ECB’s Nagel
Fed’s Williams
ECB’s Vujčić
Saturday, June 27
ECB’s Schnabel
RBA Governor Bullock
Central banks’ meetings and policy decisions to shape markets
No major Fed, BoE, BoJ, or RBA interest rate decisions are scheduled for the week, leaving investors focused on speeches, incoming data, and the market interpretation of the latest policy meetings.
DXY printed a fresh 13-month high this week after a hawkish FOMC pushed markets toward pricing a 2026 rate hike.
The move is driven by rate differentials, not a growth scare, as the Fed out-hawks a stalling field of peers.
Next week’s combined GDP and PCE print is the validation test for the rally.
The US Dollar Index (DXY) spent the back half of this week doing something most desks had written off six months ago: rallying on the prospect of a Federal Reserve (Fed) rate hike. The index pushed to a fresh 13-month high before easing back; the move owed less to safe-haven flight than to a cold read on rate differentials. With the Federal Open Market Committee (FOMC) leaning hawkish at its June meeting, the Greenback has become the cleanest way to play the only major central bank still willing to tighten into an energy shock.
A yield gap, not a panic
Underneath the geopolitical noise, the Dollar’s bid is a yield story. The Fed has parked itself in a higher-for-longer posture while the field around it has stalled or blinked. The Bank of England (BoE) and the Swiss National Bank (SNB) both held this week, with the Greenback taking its largest gains against the Pound and the Franc. Even the European Central Bank (ECB), which delivered its first hike since 2023, is tightening defensively into a contracting economy rather than a strong one; that distinction is the entire trade.
Warsh pulls the guidance rug
New Fed Chair Kevin Warsh used his first meeting to do less, not more. The Committee held at 3.75% as expected; the updated dot plot told the real story, with the rate projections revised higher across the board and the median now embedding a hike bias for the year. Warsh himself declined to signal the next move, leaning instead on the line that inflation has sat above target for years and that restoring price stability comes first. Markets took the hint and ran: pricing on CME FedWatch now leans toward a hike by the autumn, with inflation forecasts revised higher on the back of the Middle East conflict. A central bank that refuses to promise cuts, in a world where everyone else is cornered, is a powerful tailwind for its currency.
The number that settles it
Every bar of this rally is implicitly long the hawkish-Fed thesis, which means next week hands the Dollar its first real audit. Thursday delivers a rare double-header at 12:30 GMT: the third estimate of first-quarter Gross Domestic Product (GDP) lands alongside the May Personal Consumption Expenditures Price Index (PCE), the Fed’s preferred inflation gauge. The growth print is seen confirming 1.6%, down from the initial 2.0%; the spotlight therefore falls on PCE. Core PCE is already pencilled in to accelerate to 0.3% MoM from 0.2%, which means even an in-line print stamps reacceleration onto core inflation; an upside surprise, coming after May headline Consumer Price Index (CPI) leapt above 4% YoY, would cement the hike pricing and send the index back to test its highs. A soft one would expose how much good news is already in the price.
Resistance: The 101.00 round figure caps the immediate upside, with this week’s 13-month peak just above it; a clean break opens room toward 102.00.
Support: Initial support sits near 100.50, then the psychological 100.00 handle; below that, the 50-day and 200-day Exponential Moving Average (EMA) cluster near 99.00 marks where the trend would come into question. The hourly Stochastic Relative Strength Index (Stoch RSI) is washed out near oversold, which argues the current dip is a pause rather than a turn.
Bias: Bullish while the index holds above 100.00 and the hawkish-Fed narrative survives next week’s data. A hot PCE keeps the path toward 102.00 open; a downside inflation surprise is the one catalyst that turns this stretched-but-intact rally into a deeper pullback toward 99.00.
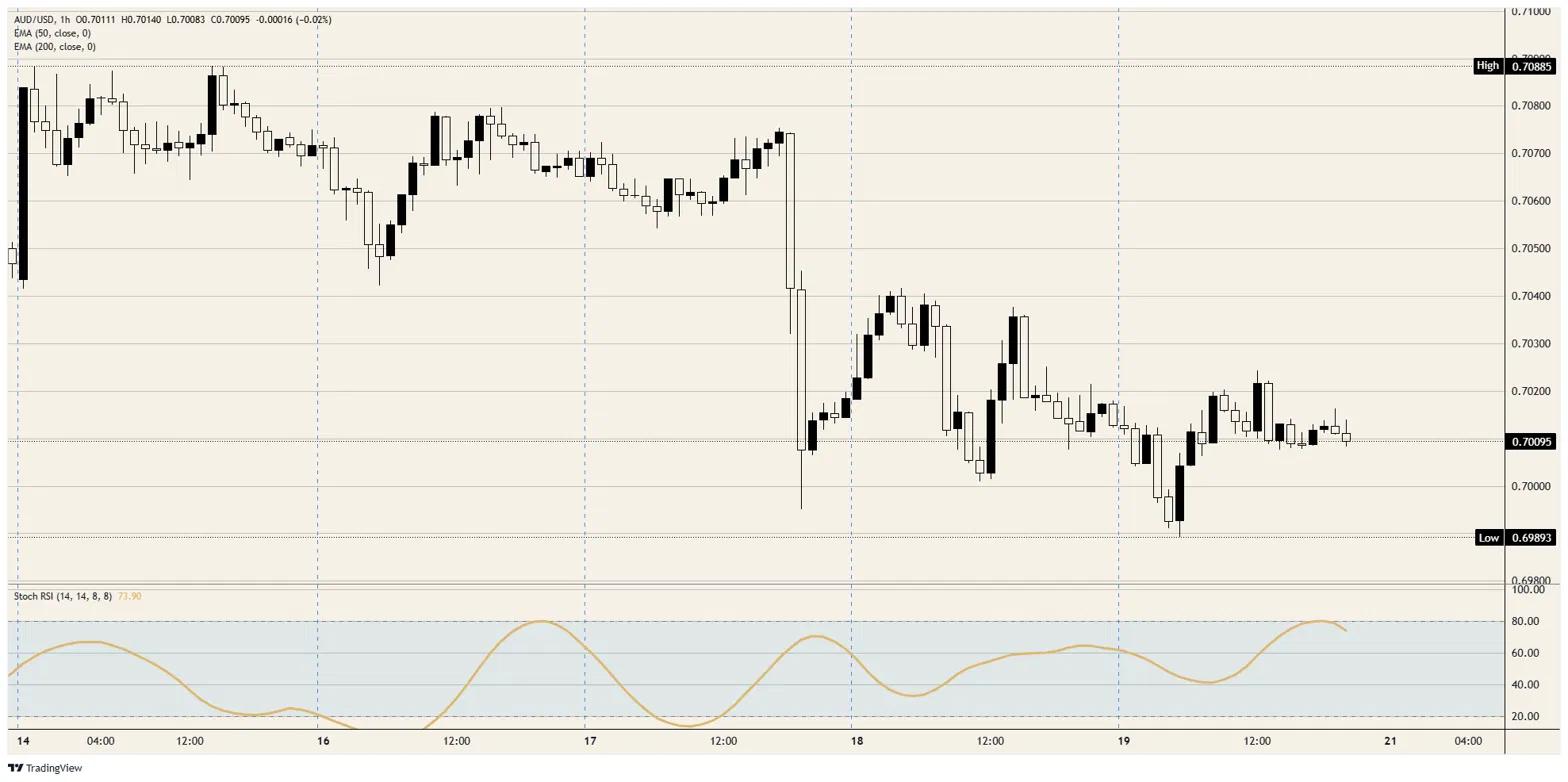
AUD/USD was knocked lower this week as a hawkish FOMC powered the US Dollar broadly higher.
The RBA held this month, with above-target inflation keeping a further hike on the table.
Wednesday’s Australian CPI is the Aussie’s best chance to trade on something other than the Dollar.
The Australian Dollar spent this week as a passenger in someone else’s trade. A hawkish Federal Open Market Committee (FOMC) and a surging US Dollar dragged the Aussie down to the 0.7000 handle, with the pair’s sharp mid-week drop owing more to events in Washington than to anything out of Canberra. Yet the Aussie is not quite the pure risk-proxy it tends to get treated as. It carries a domestic inflation problem of its own; next week hands it a rare chance to trade on that rather than on the Greenback’s momentum.
The RBA is not done being hawkish
The Reserve Bank of Australia (RBA) left its cash rate unchanged at 4.35% this month, yet struck a far-from-dovish tone. Policymakers flagged that inflation remains elevated and has picked up materially, driven in part by higher fuel and commodity prices tied to the Middle East conflict, with pass-through into goods and services already visible. Several desks still see scope for additional tightening before any easing cycle begins; the central bank’s own projections keep inflation above target into 2027. That is a meaningfully firmer footing than most of the Aussie’s peers can claim.
Why the carry can’t catch a bid
None of that has been enough to lift the currency, because the Aussie answers to more than its own rate story. It trades as a liquid proxy for both risk appetite and China, neither of which has helped: a stronger Dollar saps risk sentiment, while soft Chinese demand and a heavy Iron Ore market cap any rebound in Australia’s terms of trade. The result is a currency with real domestic inflation pressure that still cannot pull away from the 0.7000 handle. As long as the Dollar owns the tape, the Aussie’s better fundamentals stay academic.
Two home prints, then the Dollar
Next week finally gives the Aussie a domestic slate to trade. Australia’s monthly Consumer Price Index (CPI) for May lands on Wednesday at 01:30 GMT, with the annual rate seen ticking up to 4.3% and the trimmed mean, the RBA’s preferred core measure, in focus; a hot reading would revive hike bets and hand the currency a genuinely idiosyncratic reason to firm, even against a strong Dollar.
The May employment report follows on Thursday in the same early slot, after the prior month’s surprise contraction in jobs; a rebound would reinforce the hawkish case. The complication is timing: that jobs print lands the same day the US delivers its first-quarter Gross Domestic Product (GDP) third estimate and the May Personal Consumption Expenditures Price Index (PCE) at 12:30 GMT. A firm Australian double-header into a hot US PCE would leave the Aussie pulled in both directions; the Dollar leg usually wins that tug-of-war.
Resistance: The 0.7050 level is the first hurdle, with the 50-day Exponential Moving Average (EMA) near 0.7100 capping the broader pullback; the Aussie needs a close back above 0.7100 to argue the down-leg is over.
Support: The 0.7000 handle is the line that matters; it has so far held. A sustained break exposes 0.6950, then the 200-day EMA near 0.6900.
Bias: Neutral-to-bearish while price sits below 0.7100 and the Dollar dominates, but with a clear two-way risk next week. The daily Stochastic Relative Strength Index (Stoch RSI) near oversold leaves room for a bounce; a hot Australian CPI is the catalyst most likely to deliver one. A soft CPI into a firm US PCE points the pair back through 0.7000 toward 0.6950.
To provide the best experiences, we use technologies like cookies to store and/or access device information. Consenting to these technologies will allow us to process data such as browsing behavior or unique IDs on this site. Not consenting or withdrawing consent, may adversely affect certain features and functions.
Functional
Always active
The technical storage or access is strictly necessary for the legitimate purpose of enabling the use of a specific service explicitly requested by the subscriber or user, or for the sole purpose of carrying out the transmission of a communication over an electronic communications network.
Preferences
The technical storage or access is necessary for the legitimate purpose of storing preferences that are not requested by the subscriber or user.
Statistics
The technical storage or access that is used exclusively for statistical purposes.The technical storage or access that is used exclusively for anonymous statistical purposes. Without a subpoena, voluntary compliance on the part of your Internet Service Provider, or additional records from a third party, information stored or retrieved for this purpose alone cannot usually be used to identify you.
Marketing
The technical storage or access is required to create user profiles to send advertising, or to track the user on a website or across several websites for similar marketing purposes.