- AUD/USD remains on the back foot for the second straight day, though it lacks follow-through.
- The RBA’s hawkish tilt supports the Aussie, while the US-Iran peace deal undermines the USD.
- Traders seem hesitant ahead of the crucial FOMC rate decision amid a bearish technical setup.
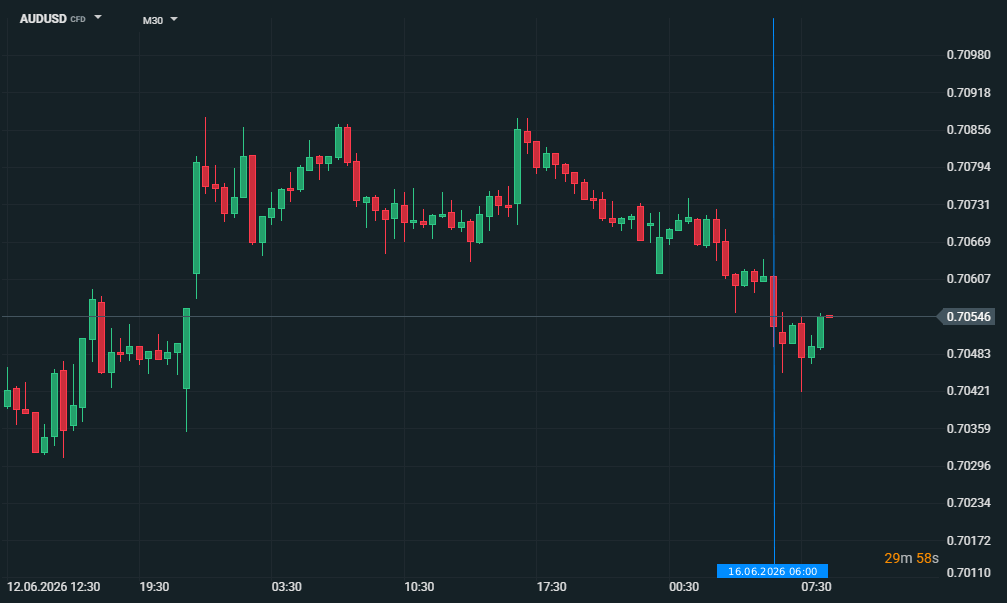
The AUD/USD pair trades with a negative bias for the second straight day, though it lacks bearish conviction and holds above the 0.7050 level through the Asian session on Wednesday amid mixed cues.
The Reserve Bank of Australia (RBA) maintained a hawkish hold on Tuesday and warned that further rate increases are possible if inflation remains stubbornly elevated, which acts as a tailwind for the Australian Dollar (AUD). Furthermore, an interim US-Iran peace agreement undermines the safe-haven US Dollar (USD) and supports the AUD/USD pair. Traders, however, seem hesitant and opt to wait for the highly anticipated FOMC policy decision before placing fresh directional bets.
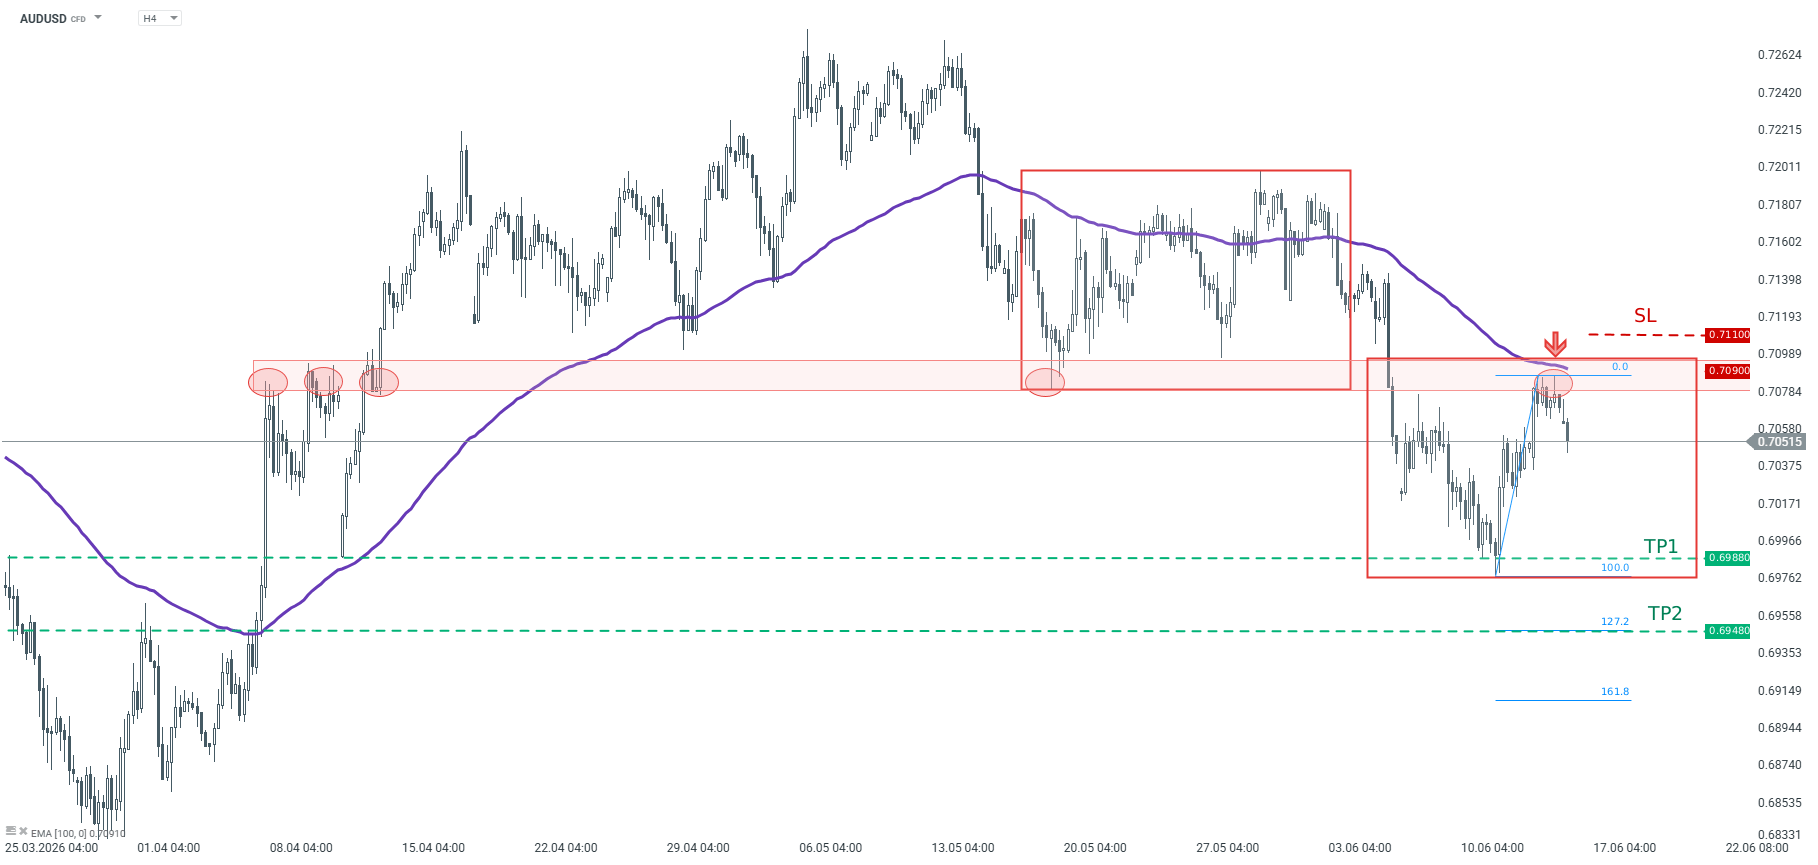
The AUD/USD pair keeps a bearish near-term tone 0.7085-0.7090 confluence – comprising the 100-day Simple Moving Average (SMA) and the 38.2% Fibonacci retracement of the May-June downfall. Adding to this, momentum oscillators hint that a short-term downward trend is still in play. The Relative Strength Index (RSI) is near 43, while the Moving Average Convergence Divergence (MACD) line remains below zero and the signal line, with the histogram remaining slightly negative.
On the topside, the immediate hurdle is clustered around the 0.7085-0.7090 confluence, with further barriers seen at the 50% level at 0.7124 and the 61.8% retracement at 0.7159. A sustained break above these would be needed to ease the current bearish pressure and expose the 78.6% retracement at 0.7209 and the swing high near 0.7272. On the downside, initial support is aligned with the 23.6% Fibo. at 0.7046, ahead of the monthly low near 0.6976, where a break would reinforce the broader decline.
(The technical analysis of this story was written with the help of an AI tool.)