GBP/USD attracts some buyers to around 1.3290 in Thursdayโs Asian session.
Burnhamโs commitment to fiscal rules calms traders’ nerves, supporting the British Pound.
The US jobs data for June will be in the spotlight later on Thursday.
The GBP/USD pair gains traction to near 1.3290 during the Asian trading hours on Thursday. The British Pound (GBP) strengthens against the US Dollar (USD) as the UK’s likely next Prime Minister, Andy Burnham, has eased market concerns by pledging strict fiscal discipline. The US Nonfarm Payrolls (NFP) data for June will take center stage later on Thursday.
Burnham vowed on Monday to deliver radical change to the nation’s politics by handing more power to its regions and by encouraging collaboration over argument in a 10-year mission to spur “good” growth. Traders continue to assess the political transition in the UK following Burnham’s emergence as the next leader.
Natixis analysts believe that maintaining investor confidence in the UK’s public finances will be critical. While Burnham’s commitment to fiscal discipline offers near-term support, markets will closely monitor future budgets for any signs that fiscal rules are being relaxed to finance higher public spending.
All eyes will be on the US jobs data later in the day as it could offer some hints about the US interest rate path. The US Nonfarm Payrolls (NFP) is expected to show 110,000 job additions in June, while the Unemployment Rate is projected to hold steady at 4.3% during the same period. Any signs of a resilient US labor market could lift the Greenback and act as a headwind for the major pair.
GBP/USD attracts fresh sellers on Wednesday as traders await speeches from central bank chiefs.
The broader technical setup favors bearish traders and backs the case for a further depreciation.
A sustained strength beyond the 23.6% Fibo. level is needed to back the case for any recovery.
The GBP/USD pair meets with a fresh supply during the Asian session on Wednesday and moves away from a nearly two-week high around the 1.3275 region, touched the previous day. Spot prices currently trade around the 1.3235 zone, down 0.20% for the day, as traders look to speeches from Bank of England (BoE) Governor Andrew Bailey and Federal Reserve (Fed) Chair Kevin Warsh for a fresh impetus.
From a technical perspective, the GBP/USD pair has been struggling to make it through the 23.6% Fibonacci retracement level of the May-June downfall. This comes on top of the recent repeated failures near the 200-period Simple Moving Average (SMA) on the 4-hour chart and a breakdown below the 1.3300 mark, which, in turn, favors bearish traders. However, mixed momentum indicators warrant some caution before positioning for deeper losses.
In fact, the Relative Strength Index (RSI) is hovering near 52, while the Moving Average Convergence Divergence (MACD) is showing a fading positive bias. This, in turn, hints at limited upside while the GBP/USD pair remains capped by the clustered resistance overhead. In the meantime, the key support around 1.3139 remains the key structural floor, and a clear break below would open the door for a continuation of the broader downtrend.
On the topside, immediate resistance emerges at the 23.6% Fibo. level at 1.3260, with further barriers aligned at the 38.2% retracement around 1.3335 and the 200-period SMA at 1.3360, ahead of the 50.0% retracement near 1.3396. A sustained move beyond the said barriers would start to ease the broader bearish bias and pave the way for a more convincing recovery phase. However, a failure would leave the GBP/USD pair vulnerable to slide further.
GBP/USD meets with a fresh supply and snaps a three-day winning streak to a one-week high.
The US-Iran uncertainty and elevated Fed rate hike expectations help revive the USD demand.
The mixed technical setup warrants some caution before placing aggressive directional bets.
The GBP/USD pair attracts some sellers during the Asians session on Tuesday and reverses a part of the previous day’s strong move up to a one-week top. Spot prices, for now, seem to have snapped a three-day winning streak and currently trade around the 1.3235-1.3230 region, down nearly 0.20% for the day.
The US Dollar (USD) regains some positive traction amid mixed signals on US-Iran talks and firming expectations that the US Federal Reserve (Fed) will hike interest rates in 2026. Furthermore, the UK political uncertainty ahead of a leadership contest is seen as undermining the British Pound (GBP) and exerting some downward pressure on the GBP/USD pair.
From a technical perspective, the recent repeated failures near the 200-period Simple Moving Average (SMA) on the 4-hour chart favor bearish traders. Moreover, spot prices retain a negative bias below the 1.3300 mark, though momentum indicators suggest that upside attempts could persist while the broader structure is still constrained by the overhead supply zone.
In fact, the Relative Strength Index (RSI) hovers near 54 while the Moving Average Convergence Divergence (MACD) histogram remains modestly positive. Hence, any further decline is more likely to find a decent support near the 1.3200 mark, below which the GBP/USD pair could aim to retest the year-to-date low, around the 1.3140 region, and decline further.
On the topside, initial resistance is located near the 1.3300 round figure, which is followed by the 200-period SMA at 1.3366. A sustained strength above this barrier would start to ease the broader bearish bias and open the way for a more convincing recovery phase, though a failure would leave the GBP/USD pair vulnerable to resume its downtrend.
(The technical analysis of this story was written with the help of an AI tool.)
GBP/USD 4-hour chart
US Dollar Price Today
The table below shows the percentage change of US Dollar (USD) against listed major currencies today. US Dollar was the strongest against the Euro.
USD
EUR
GBP
JPY
CAD
AUD
NZD
CHF
USD
0.28%
0.19%
0.16%
0.16%
0.21%
-0.02%
0.24%
EUR
-0.28%
-0.09%
-0.15%
-0.16%
-0.08%
-0.31%
-0.05%
GBP
-0.19%
0.09%
-0.04%
-0.08%
0.02%
-0.21%
0.03%
JPY
-0.16%
0.15%
0.04%
0.00%
0.05%
-0.16%
0.07%
CAD
-0.16%
0.16%
0.08%
-0.00%
0.03%
-0.17%
0.08%
AUD
-0.21%
0.08%
-0.02%
-0.05%
-0.03%
-0.20%
0.07%
NZD
0.02%
0.31%
0.21%
0.16%
0.17%
0.20%
0.23%
CHF
-0.24%
0.05%
-0.03%
-0.07%
-0.08%
-0.07%
-0.23%
The heat map shows percentage changes of major currencies against each other. The base currency is picked from the left column, while the quote currency is picked from the top row. For example, if you pick the US Dollar from the left column and move along the horizontal line to the Japanese Yen, the percentage change displayed in the box will represent USD (base)/JPY (quote).
GBP/USD remains flat at 1.3200, halfway through the last two weeks’ trading range.
Investors’ appetite for risk remains subdued amid a fresh escalation of the US-Iran hostilities this weekend.
Technical indicators are showing initial signs of bottoming at the 1.3050 area.
The British Pound (GBP) is practically flat against the US Dollar (USD) on Monday, with Pound bulls subdued amid rising geopolitical tensions and the UKโs political impasse, while the safe-haven USD treads water, awaiting an array of US employment indicators. The GBP/USD pair remains steady at 1.3200 halfway through the last two weeksโ trading range.
Investors are wary of risk at the weekโs opening, despite the latest agreement to end a series of attacks in the Strait of Hormuz this weekend, which had shaken a precarious ceasefire. US and Iranian negotiators have also agreed to restart peace talks this week, in the latest attempt to end a four-month-long conflict that threatened to collapse the global economy.
In the UK, political uncertainty is likely to keep the Poundโs upside attempts limited until the next Prime Minister starts to define his political agenda. In the US, on the other hand, a string of employment indicators, including Thursdayโs key Nonfarm Payrolls report, are expected to shed further light on the Federal Reserveโs monetary policy path.
Technical Indicator: Pound shows initial signs of bottoming
GBP/USD trades at 1.3210, with the bearish bias still in place after a nearly 3% decline in the last two months. Recent price action, however, shows signs of a potential bottoming in the mid-range of the 1.3100s, with momentum indicators in 4-hour charts turning bullish.
The 4-hour Relative Strength Index (14) around 50.7 hints at neutral momentum, and the Moving Average Convergence Divergence (MACD), hovering slightly above zero with a modestly positive line, shows an incipient upside pressure ahead of key resistance levels.
Bulls are likely to be tested at the top of the last two weeks’ horizontal channel, near 1.3270 (June 22 high). Further up the 1.3320 area (June 8, 11 lows, and June 18 high) is likely to pose some resistance ahead of the mid-June highs at the 1.3440-1.3450 area.
On the downside, session lows at 1.3195 are holding bears on Monday, ahead of last week’s horizontal floor at 1.3140, which guards the path toward the November 2025 lows near the 1.3000 psychological level.
Pound Sterling Price Today
The table below shows the percentage change of British Pound (GBP) against listed major currencies today. British Pound was the strongest against the Japanese Yen.
USD
EUR
GBP
JPY
CAD
AUD
NZD
CHF
USD
-0.15%
-0.15%
0.05%
-0.09%
-0.09%
-0.25%
-0.11%
EUR
0.15%
-0.01%
0.20%
0.05%
0.09%
-0.09%
0.04%
GBP
0.15%
0.01%
0.21%
0.07%
0.08%
-0.11%
0.05%
JPY
-0.05%
-0.20%
-0.21%
-0.13%
-0.14%
-0.32%
-0.16%
CAD
0.09%
-0.05%
-0.07%
0.13%
-0.00%
-0.18%
-0.05%
AUD
0.09%
-0.09%
-0.08%
0.14%
0.00%
-0.17%
-0.02%
NZD
0.25%
0.09%
0.11%
0.32%
0.18%
0.17%
0.16%
CHF
0.11%
-0.04%
-0.05%
0.16%
0.05%
0.02%
-0.16%
The heat map shows percentage changes of major currencies against each other. The base currency is picked from the left column, while the quote currency is picked from the top row. For example, if you pick the British Pound from the left column and move along the horizontal line to the US Dollar, the percentage change displayed in the box will represent GBP (base)/USD (quote).
The GBP/USD rate is rebounding slightly as the dollar (specifically the dollar index, USDIDX) corrects across the broader market after breaking out to a 13-month high. Technically, however, we are far from breaking the downward trend on GBPUSD. Even after the recent bounce, the price has been moving below the 10-day exponential moving average (EMA10; yellow) for 9 days. Furthermore, the cascade of the remaining EMAs (longer over shorter: EMA100 over EMA30, and EMA30 over EMA10) signals a clear downtrend, the reversal of which would require a series of bullish turnarounds. The chances of a strictly pro-pound turnaround remain slim. The British currency is primarily weighed down by a period of political uncertainty and the ongoing leadership transition within the ruling Labour Party following Prime Minister Starmer’s resignation.
The Guardian reported that according to preliminary internal party plans, Burnham could assume the office of Prime Minister as early as July 17. However, the anticipationโespecially regarding the appointments of key cabinet members such as the Chancellorโshould continue to test the pound. On the dollar side, we see a persistently hawkish Fed narrative, an increase in core PCE inflation to 3.4%, and a Q1 2026 GDP revision from 1.6% to 2.1%. The backdrop of a gathering momentum in the US economy alongside elevated inflation contrasts sharply with stagflationary tendencies in the UK. This divergence should extend the current trend on GBPUSD and the UK/US 10-year bond yield spread, until potential wage effects emerge from the recent UK energy shock, which could force the Bank of England into a more hawkish monetary policy stance. However, UK policy is already restrictive, which limits the potential for a sharp pivot.
Methodology
This recommendation was prepared based on a technical analysis of the GBPUSD chart and a fundamental analysis of the economies in question (monetary policy in the United Kingdom and the United States). The directional bias of the recommendation was determined using moving averages and market expectations regarding central bank policies. Take Profit and Stop Loss levels were established using Fibonacci retracements and price action:
TP1 and TP2 are located at the nearest support levels from November 2025.
SL is placed halfway between the EMA10 and EMA30, as well as between the 23.6% and 38.2% Fibo levels.
GBP/USD attracts some buyers for the second straight day amid a mildly softer US Dollar.
The UK political crisis holds back GBP bulls from placing fresh bets and caps spot prices.
The bearish technical setup suggests that a further move up is more likely to be sold into.
The GBP/USD pair sticks to its positive bias for the second straight day, though it lacks bullish conviction and trades just above the 1.3200 mark during the early European session on Friday. The US Dollar (USD) remains depressed below its highest level since May 2025, touched on Thursday, and acts as a tailwind for spot prices.
However, the UK political crisis holds back traders from placing aggressive bullish bets around the British Pound (GBP) and caps the upside for the GBP/USD pair. Furthermore, a bearish technical setup warrants caution before positioning for any meaningful recovery from the 1.3140 area, or the lowest since November, set on Wednesday.
Against the backdrop of the recent repeated failures near the 200-period Simple Moving Average (SMA) on the 4-hour chart, this week’s break below the 1.3300 mark was seen as a key trigger for the GBP/USD bears. Moreover, the Relative Strength Index (RSI) is at 47, suggesting consolidative conditions rather than clear trend strength.
However, the Moving Average Convergence Divergence (MACD) indicator shows the MACD line modestly above the signal line and hovering around zero. This hints at tentative bullish momentum that is not yet strong enough to challenge the GBP/USD pair’s dominant downtrend witnessed over the past two months or so.
On the topside, initial resistance is located at the 200-period SMA at 1.3384, and spot prices would need a sustained break above this level to ease the broader bearish bias and open the way for a more constructive recovery phase. On the downside, intraday setbacks are likely to be driven more by price action than by clearly defined structural supports.
Meanwhile, traders will be watching the recent lows around the mid-1.3100s as a provisional near-term floor for the GBP/USD pair until fresh technical levels emerge.
(The technical analysis of this story was written with the help of an AI tool.)
GBP/USD 4-hour chart
US Dollar Price Today
The table below shows the percentage change of US Dollar (USD) against listed major currencies today. US Dollar was the strongest against the Australian Dollar.
USD
EUR
GBP
JPY
CAD
AUD
NZD
CHF
USD
-0.14%
-0.07%
-0.10%
-0.04%
0.29%
0.04%
-0.22%
EUR
0.14%
0.07%
0.06%
0.13%
0.44%
0.16%
-0.07%
GBP
0.07%
-0.07%
0.00%
0.06%
0.38%
0.12%
-0.13%
JPY
0.10%
-0.06%
0.00%
0.06%
0.39%
0.11%
-0.12%
CAD
0.04%
-0.13%
-0.06%
-0.06%
0.33%
0.05%
-0.20%
AUD
-0.29%
-0.44%
-0.38%
-0.39%
-0.33%
-0.26%
-0.52%
NZD
-0.04%
-0.16%
-0.12%
-0.11%
-0.05%
0.26%
-0.24%
CHF
0.22%
0.07%
0.13%
0.12%
0.20%
0.52%
0.24%
The heat map shows percentage changes of major currencies against each other. The base currency is picked from the left column, while the quote currency is picked from the top row. For example, if you pick the US Dollar from the left column and move along the horizontal line to the Japanese Yen, the percentage change displayed in the box will represent USD (base)/JPY (quote).
GBP/USD rebounds to around 1.3175 in Thursdayโs Asian session.
UK PM Keir Starmer resigned on Monday, throwing UK politics into sudden turmoil.
Traders will keep an eye on the US PCE Price Index report for May, which is due on Thursday.
The GBP/USD pair recovers some lost ground to near 1.3175 during the Asian trading hours on Thursday. However, the potential upside for the major pair might be limited amid UK political instability and rising expectations of US interest rate hikes this year. Traders await the US May Personal Consumption Expenditures (PCE) inflation data on Thursday for fresh impetus.
UK Prime Minister Keir Starmer resigned on Monday, throwing the country into yet another political crisis. Starmer stepped down under intense pressure following Andy Burnham’s victory in the Makerfield by-election last week. His Labour Party will now need to select a new leader to lead the country.
Traders will closely monitor what Burnhamโs policy would look like. Analysts warned that Burnhamโs preferred expansionary fiscal stance, higher taxation, and increased gilt issuance could weigh on the British Pound (GBP) against the US Dollar (USD).
The US PCE Price Index report for May will take center stage on Thursday. The headline PCE is expected to show a rise of 4.1% YoY in May, compared to 3.8% in April. The core CPE inflation is projected to show an increase of 3.4% YoY in May, versus 3.3% prior. Any signs of easing inflation in the US could undermine the Greenback and create a tailwind for the major pair.
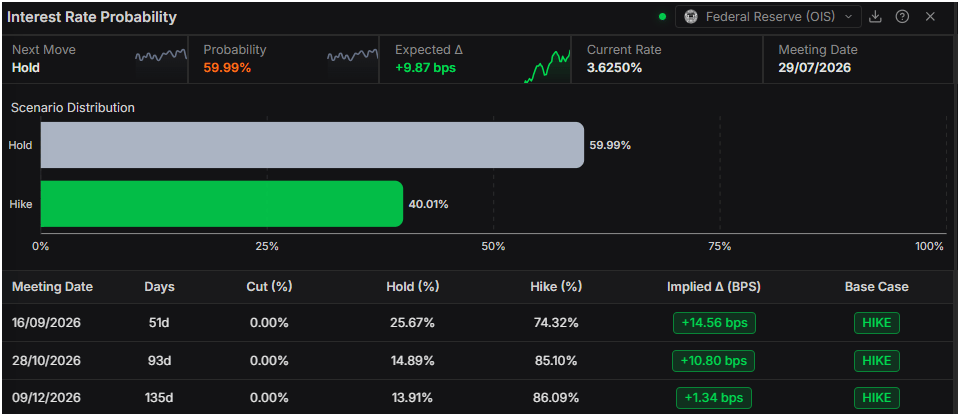
Meanwhile, traders reassess the timing of possible US rate hikes after the Federal Reserveโs (Fed) hawkish signal. Markets have priced in nearly a 34.2% probability of a 25 basis points (bps) hike at the July meeting, up from 8.5% a week ago, and 66.4% for September, up from 29.1%, according to the CME FedWatch tool.
EUR/GBP depreciates 0.6% so far this week to test 10-month lows in the 0.8610 area.
A tech rout in stock markets and frictions in the US-Iran peace deal are weighing on risk appetite on Wednesday.
Momentum indicators suggest that upside attempts are likely to find sellers.
The Euro (EUR) extends losses for the fourth consecutive day against the British Pound (GBP) on Wednesday. The EUR/GBP pair has lost about 0.6% so far this week and is testing the 0.8610 area at the time of writing, its lowest level in the last 10 months.
The Pound sterling seems to be faring better than the Euro amid the risk-off market mood. Stock markets in Asia and the US have been dragged down by sharp declines in tech shares, as investors take profits after a long AI rally, while frictions between the US and Iran regarding nuclear inspections have cast a shadow over the outcome of the peace deal.
On the macroeconomic front, the Bank of Englandโs (BoE) official, Alan Taylor, stated on Tuesday that an extended hold is the right response to the increase in price pressures and that the bank should be ready to cut rates if a benign scenario plays out. In the Eurozone, the focus on Wednesday will be on German ZEW Business Climate data, which is expected to show a minor improvement in June.
Technical Analysis: Euro remains under significant bearish pressure
EUR/GBP trades at 0.8615 with a bearish near-term tone, holding a few pips above the lows of March 2026 and August 2025, with momentum indicators in most timeframes highlighting strong negative pressure. The 4-hour Relative Strength Index (14) sits just above oversold levels, while the Moving Average Convergence Divergence (MACD) remains slightly negative.
A confirmation below the mentioned 0.8611 would expose the August 2025 bottom, at 0.8595, and the 161.8% Fibonacci extension of Monday’s sell-off, at the 0.8585 area. On the topside, initial resistance appears at Tuesday’s highs of 0.8634, followed by the June 19 low, at 0.8657. A break above these would open the way toward the June 18 and 21 highs, around 8.8680.
(The technical analysis of this story was written with the help of an AI tool.)
Pound Sterling Price Today
The table below shows the percentage change of British Pound (GBP) against listed major currencies today. British Pound was the strongest against the Swiss Franc.
USD
EUR
GBP
JPY
CAD
AUD
NZD
CHF
USD
0.14%
0.08%
0.06%
0.09%
0.08%
0.24%
0.22%
EUR
-0.14%
-0.06%
-0.07%
-0.06%
-0.06%
0.06%
0.09%
GBP
-0.08%
0.06%
-0.04%
-0.02%
0.00%
0.12%
0.14%
JPY
-0.06%
0.07%
0.04%
0.02%
0.00%
0.13%
0.15%
CAD
-0.09%
0.06%
0.02%
-0.02%
-0.01%
0.10%
0.15%
AUD
-0.08%
0.06%
-0.00%
-0.01%
0.00%
0.12%
0.13%
NZD
-0.24%
-0.06%
-0.12%
-0.13%
-0.10%
-0.12%
0.02%
CHF
-0.22%
-0.09%
-0.14%
-0.15%
-0.15%
-0.13%
-0.02%
The heat map shows percentage changes of major currencies against each other. The base currency is picked from the left column, while the quote currency is picked from the top row. For example, if you pick the British Pound from the left column and move along the horizontal line to the US Dollar, the percentage change displayed in the box will represent GBP (base)/USD (quote).
To provide the best experiences, we use technologies like cookies to store and/or access device information. Consenting to these technologies will allow us to process data such as browsing behavior or unique IDs on this site. Not consenting or withdrawing consent, may adversely affect certain features and functions.
Functional
Always active
The technical storage or access is strictly necessary for the legitimate purpose of enabling the use of a specific service explicitly requested by the subscriber or user, or for the sole purpose of carrying out the transmission of a communication over an electronic communications network.
Preferences
The technical storage or access is necessary for the legitimate purpose of storing preferences that are not requested by the subscriber or user.
Statistics
The technical storage or access that is used exclusively for statistical purposes.The technical storage or access that is used exclusively for anonymous statistical purposes. Without a subpoena, voluntary compliance on the part of your Internet Service Provider, or additional records from a third party, information stored or retrieved for this purpose alone cannot usually be used to identify you.
Marketing
The technical storage or access is required to create user profiles to send advertising, or to track the user on a website or across several websites for similar marketing purposes.