- GBP/USD rises as the US Dollar struggles after soft US data prompts markets to scale back Fed rate hike bets.
- Fed policy outlook softens as a cooling employment report and dropping crude oil prices ease inflationary pressures.
- The British Pound may face headwinds as markets slash expectations from two interest rate hikes down to just a 70% chance of one.
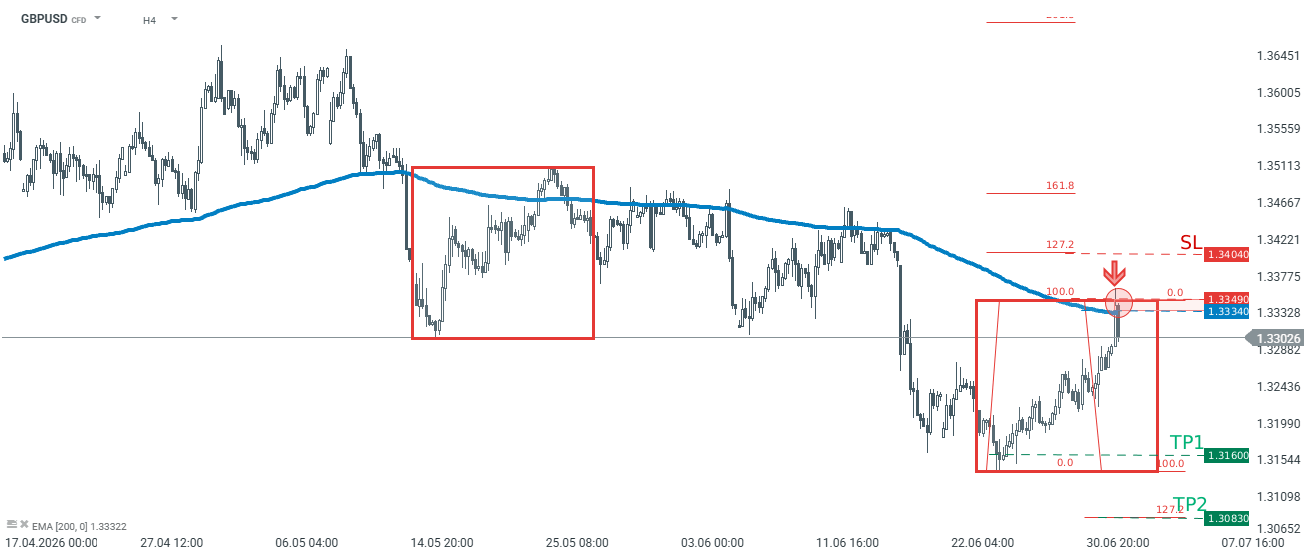
GBP/USD continues its winning streak for the ninth consecutive day, trading around 1.3390 during the Asian hours on Tuesday. The currency pair rises as the US Dollar (USD) faces headwinds as market participants scale back expectations for Federal Reserve (Fed) rate hikes this month and in September. This shift in sentiment followed a cooling employment report that revealed fewer jobs added across April, May, and June than Wall Street had anticipated.
Furthermore, a recent drop in crude oil prices, driven by an OPEC+ production boost and a US-Iran peace deal, has alleviated broader inflationary pressures, softening the urgency for an aggressive Fed policy outlook.
The Greenback could find baseline support from hawkish remarks by Federal Reserve (Fed) Governor Christopher Waller and resilient domestic economic data.
Waller underscores flexible forward guidance and firm 2% inflation pledge
Fed’s Waller delivers a moderately stronger-than-usual performance, with a 7.1/10 FXS Speechtracker score compared to the established baseline of 6.4/10, emphasizing both the usefulness and the pitfalls of forward guidance. The focus on forward guidance as a “valuable tool” that can accelerate policy transmission, yet becomes a hindrance when too rigid or when facing multiple plausible economic paths, signals a preference for more flexible communication and reinforces the importance of a well-understood reaction function. Waller’s insistence on the credibility of the 2% inflation pledge, rejection of keeping rates low to aid deficit financing, and preference for an inflation target range (without changing the current target) collectively lean hawkish for the Dollar, even without explicit comments on the near-term outlook.
The FXS Fed Sentiment Index rose by 1.83 points to 125.72, confirming a move further into hawkish territory relative to the neutral 100 benchmark. This upward shift, aligned with the above-baseline FXS Speechtracker score, suggests markets will read Waller’s remarks as reinforcing the Fed’s anti-inflation stance and limiting expectations for policy accommodation, a backdrop that tends to support the Dollar against other major currencies.
Although business activity in the United States (US) services sector cooled slightly, it remained firmly in expansionary territory, with the June ISM Services Purchasing Managers’ Index (PMI) printing at 54.0 in line with consensus estimates. Within the sub-components of the report, the Prices Index dipped from 71.3 to 67.7, while the Employment Index saw a notable improvement, climbing out of contractionary territory from 47.9 to 51.2.
On the other side of the equation, the British Pound (GBP) could face its own pressures as markets lowered expectations for Bank of England (BoE) tightening. Investors are now pricing in just a 70% chance of a single rate hike this year, a sharp decline from the two increases anticipated just a few weeks ago.
While BoE Governor Andrew Bailey recently confirmed that inflation remains on track to hit the bank’s 2% target, he acknowledged it would take longer than previously forecast and firmly ruled out any imminent rate cuts.
This cautious approach follows the BoE’s June 18 monetary policy meeting, where officials voted 7-2 to hold the benchmark interest rate at 3.75%. Although the status quo is maintained, the hawkish camp has doubled since April, with two dissenting voters pushing for an immediate hike to 4.00%.
While UK inflation currently sits at 2.8%, the central bank’s internal projections indicate it could bounce back above 3% by autumn due to delayed war-era energy cost pass-throughs, leading major sell-side institutions to forecast the next rate hike around late 2026.