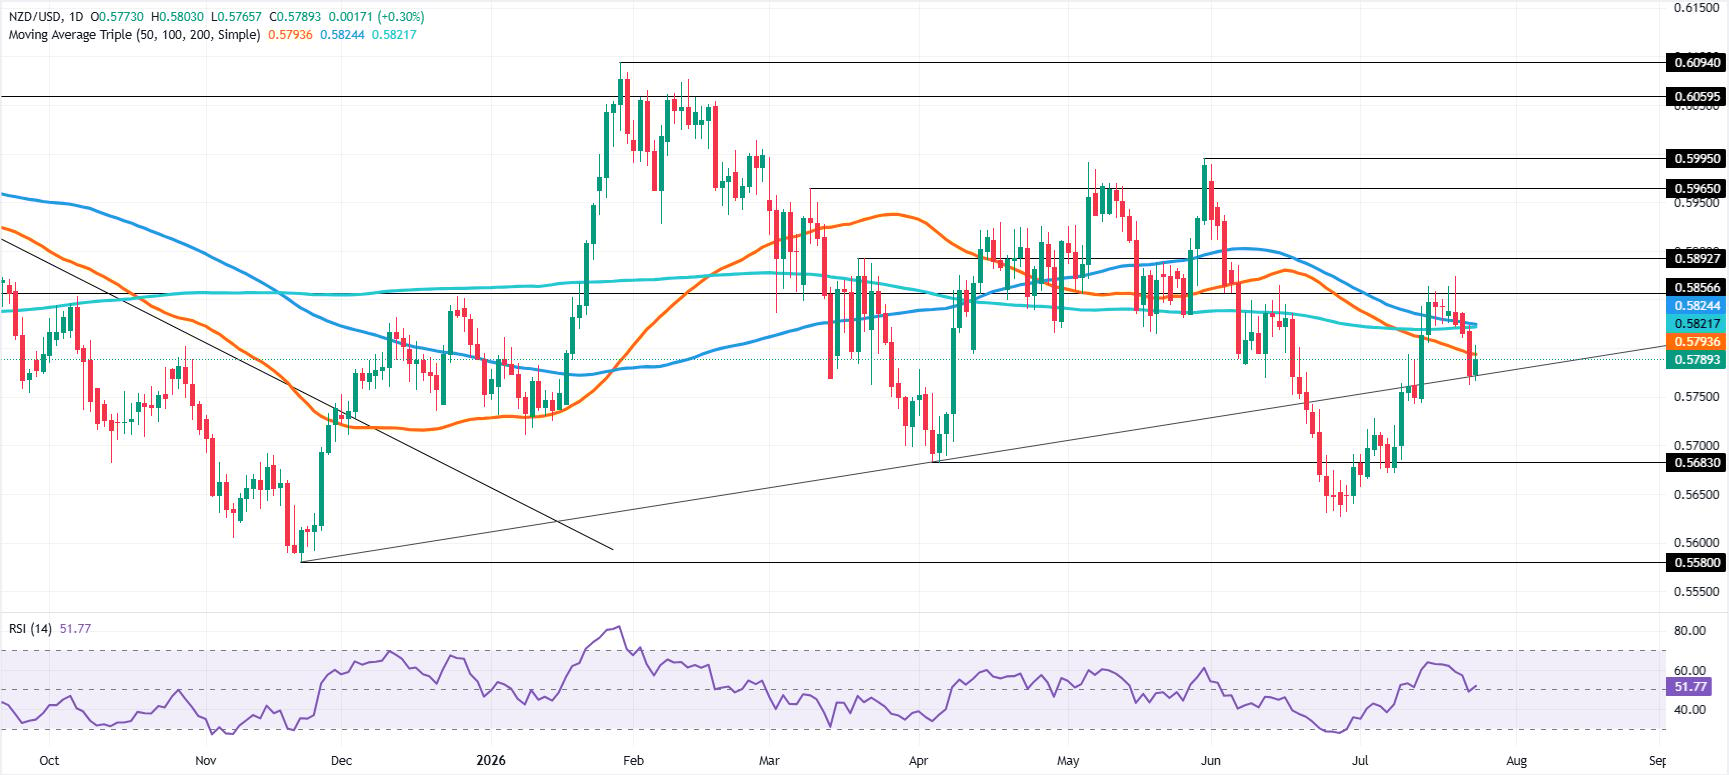
Currency Hedger No Comments

Euro: Complex rate path questions for EUR โ€“ Commerzbank

Commerzbankโ€™s Thu Lan Nguyen notes the European Central Bank sounded slightly hawkish, but investors already price in two further hikes, leaving the Euro softer after President Lagarde avoided clear guidance. Nguyen argues whether hikes come in July or later still matters, as an earlier move would signal urgency, yet markets may see rapid tightening as a policy mistake and price in future cuts, limiting Euro support.

ECB timing debate clouds Euro outlook

“Basically, things turned out just as my colleague Michael had predicted in the morning: in our view the ECB sounded slightly hawkish yesterday. But that was not enough to lure investors out of hiding who are already pricing in two further rate hikes by the end of the year anyway. Accordingly, the euro ultimately edged slightly lower, as President Lagarde avoided sending a clear signal in favour of further rate hikes.”

“This was probably not the main reason for the upward move in EUR/USD over the course of yesterdayโ€™s trading โ€“ the decisive factor here was US President Trumpโ€™s statement that he had called off another military strike against Iran because a deal was virtually in the bag. However, it is likely to have contributed to positive euro sentiment. After all, the discussion shows that a rate hike in July is at least on the table.”

“One might argue: whether the next two rate hikes expected by the market take place in July and September, or in September and December, hardly makes a big difference and is therefore irrelevant for the euro. But it is not quite that simple. A second rate hike as early as July would suggest a certain urgency behind the tightening and would therefore have a somewhat hawkish flavour.”

“If the market shares this view, it is likely to price in a rapid correction in rates downwards at the long end, which would dilute โ€“ if not completely negate โ€“ the positive effect of the rate hike for the euro. So: the debate about the timing of the next rate hike is by no means irrelevant. The situation is more complex than it appears at first glance

Currency Hedger No Comments

Canadian Dollar softens on strong US PPI data, US-Iran peace deal uncertainty

  • USD/CAD edges higher to around 1.3980 in Fridayโ€™s early Asian session. 
  • The annual US PPI inflation rate was the highest since November 2022. 
  • BoC left the interest rates unchanged at its June meeting on Wednesday. 

The USD/CAD pair gains traction to near 1.3980 during the early European trading hours on Friday, bolstered by hot US inflation data. Traders will closely monitor the developments surrounding the US-Iran peace deal. The preliminary reading of the Michigan Consumer Sentiment Index for June is due later on Friday. 

Data on Thursday showed US Producer Price Index (PPI) inflation rose more than expected in May, leading to the largest annual gain in three and a half years as the Middle East conflict drove up the cost of energy products.

The Fed is clearly missing its inflation target by a lot more than it is missing its employment objective,” said John Ryding, chief economic advisor at Brean Capital. “The PPI report should further embolden those on the FOMC who think a rate hike might be needed later in the year,โ€ Ryding added. 

US President Donald Trump said on Thursday that the US and Iran could sign a peace deal as soon as this weekend that would reopen the Strait of Hormuz to shipping. Iran countered that it had not reached a final decision on an agreement. However, uncertainty remains high amid ongoing tensions in the Middle East. 

US forces intercepted and shot down two Iranian one-way attack drones near the Strait of Hormuz on Thursday after Iran attempted to target commercial vessels transiting the waterway, per Fox News. The Islamic Revolutionary Guard Corps (IRGC) said that the country is stronger than ever and ready to deliver a “decisive, immediate, painful and regret-inducing response” to any aggression.

On the Loonie front, the Bank of Canada (BoC) on Wednesday decided to hold its key interest rate unchanged as expected and said it was โ€Œseeing limited evidence that higher energy prices were fueling broad-based inflation.

Nonetheless, BoC Governor Tiff Macklem reiterated that the bank would not hesitate to raise rates if need be to keep inflation in check. “The Governing Council is continuing to look through the war’s near-term impact on headline inflation but will not let higher energy prices become persistent inflation,โ€ according to the BoC statement. 

Currency Hedger No Comments

British Pound: Bullish bias within higher band against US Dollar โ€“ UOB

United Overseas Bankโ€™s (UOB) Quek Ser Leang and Lee Sue Ann observe that GBP/USDโ€™s surge to 1.3434 has stretched short-term conditions, but further gains toward a retest of 1.3435 remain possible, with 1.3465 unlikely to break. Over 1โ€“3 weeks, they expect range trading in a higher 1.3340โ€“1.3465 band after shifting from a negative to neutral stance, with momentum not yet strong enough for a sustained advance.

Pound holds firm but capped near resistance

“24-HOUR VIEW: While we expected GBP to โ€œedge lowerโ€ yesterday, we indicated that โ€œany decline is likely part of a lower range of 1.3330/1.3395.โ€ We added that GBP โ€œis unlikely to break clearly below 1.3330.โ€ GBP subsequently broke below 1.3330 (low of 1.3325), but it then lifted off and surged to a high of 1.3434. While the rapid rise has room to extend, overbought conditions suggest that any advance is likely limited to a retest of 1.3435. The next resistance at 1.3465 is unlikely to come under threat. Support is at 1.3385; a breach of 1.3365 would indicate that GBP is more likely to range-trade rather than retesting 1.3435.”

“1-3 WEEKS VIEW: We revised our view from negative to neutral yesterday (11 Jun, spot at 1.3365). We indicated that the earlier โ€œdownward momentum has faded, and for the time being, GBP is likely to trade in a range between 1.3300 and 1.3435.โ€ GBP then dipped to 1.3325 and then soared, testing the upper boundary of our range with a high of 1.3434. Upward momentum has increased, but not sufficiently to indicate a sustained advance. For the time being, we continue to expect range-trading, though the range has shifted higher to 1.3340/1.3465.”

Currency Hedger No Comments

Germanyโ€™s final Harmonized Index of Consumer Prices for May remains at 2.7% YoY: What it means for EUR/USD?

Germanyโ€™s final Harmonized Index of Consumer Prices (HICP) data for May has arrived at 2.7% Year-on-Year (YoY), as the preliminary data showed. The inflation data cooled down from 2.9% in April. On a monthly basis, it is confirmed that the German HICP growth declined by 0.1%.

There is a slight recovery move in the EUR/USD data, following the German final HICP data release; however, it appears that the move has come due to a slight correction in the US Dollar (USD). Still, the major currency pair is down 0.15% to near 1.1560.

Euro Price Today

The table below shows the percentage change of Euro (EUR) against listed major currencies today. Euro was the weakest against the US Dollar.

USDEURGBPJPYCADAUDNZDCHF
USD0.10%0.06%0.19%0.06%0.20%0.29%0.13%
EUR-0.10%-0.05%0.09%-0.04%0.11%0.19%0.02%
GBP-0.06%0.05%0.15%0.01%0.12%0.23%0.08%
JPY-0.19%-0.09%-0.15%-0.15%-0.01%0.08%-0.08%
CAD-0.06%0.04%-0.01%0.15%0.14%0.22%0.07%
AUD-0.20%-0.11%-0.12%0.01%-0.14%0.07%-0.08%
NZD-0.29%-0.19%-0.23%-0.08%-0.22%-0.07%-0.14%
CHF-0.13%-0.02%-0.08%0.08%-0.07%0.08%0.14%

The heat map shows percentage changes of major currencies against each other. The base currency is picked from the left column, while the quote currency is picked from the top row. For example, if you pick the Euro from the left column and move along the horizontal line to the US Dollar, the percentage change displayed in the box will represent EUR (base)/USD (quote).

What do Germanyโ€™s final HICP data mean for EUR/USD?

The impact of Germanyโ€™s final HICP data remains little on EUR/USD, unless there is a dramatic deviation. The major trigger for the major currency pair remains preliminary readings.

Meanwhile, the European Central Bankโ€™s (ECB) monetary policy announcement on Thursday, in which it raised the Deposit Facility rate by 25 basis points (bps) to 2.25%, signaled that policymakers remained highly concerned about upside inflation risks due to elevated energy prices in the wake of Middle East conflicts.

ECB President Christine Lagarde said in the press conference, post the monetary policy announcement, “Short-term inflation expectations have risen,โ€ and the central bank will โ€œmonitor size, persistence of energy price increase”.

Technical Analysis:

EUR/USD trades lower at around 1.1560, keeping a bearish bias as spot holds beneath the 20-period Exponential Moving Average (EMA) at 1.1603 and the broader downtrend resistance line near 1.1687. The pair is still riding an underlying ascending support structure from 1.1503, but the latest Relative Strength Index (14) reading around 42 suggests sellers retain the near-term initiative while any rebounds are likely to struggle against overhead supply.

On the topside, initial resistance is located at the 20-period EMA around 1.1603, with the descending trend-line resistance at 1.1687 acting as the next barrier if buyers manage a clearer bounce. On the downside, the first key support emerges at the rising trend-line break level near 1.1503; a daily close below this floor would expose it to the March 13 low at 1.1411.

Currency Hedger No Comments

AUD/USD Price Forecast: Needs decisive break above 50% Fibo retracement at 0.7050 for more upside

  • AUD/USD falls to near 0.7035 as the US Dollar bounces back.
  • Traders doubt over US President Trump stating that the Iran deal has been approved by its top leadership.
  • The RBA is expected to leave its OCR steady at 4.35% on Tuesday.

The AUD/USD pair is down 0.22% to near 0.7035 in the early European trade on Friday. The Aussie pair faces selling pressure as the US Dollar (USD) rebounds, following Iranโ€™s denial upon agreeing to the Memorandum of Understanding (MoU) with the United States (US), as reported by Iranโ€™s Fars News agency, which President Donald Trump claimed to have been agreed by Tehranโ€™s top leadership.

During press time, the US Dollar Index (DXY), which tracks the Greenbackโ€™s value against six major currencies, trades 0.15% higher to near 99.85.

On Thursday, US President Trump said that planned attacks on Iran have been called off, and discussions and final points of the peace deal have been, in both concept and great detail, approved by all parties involved. However, he clarified that the US naval blockade on Iranian sea ports will remain intact until the deal is finalized.

Meanwhile, the Australian Dollar (AUD) trades with caution ahead of the Reserve Bank of Australiaโ€™s (RBA) monetary policy, which will be announced on Tuesday. According to the latest Reuters poll, the RBA will halt its monetary tightening cycle and leave its Official Cash Rate (OCR) unchanged at 4.35%. This year, the RBA has already raised its OCR by 75 basis points (bps).

AUD/USD technical analysis

AUD/USD trades lower at around 0.7035, maintaining a bearish near-term tone as spot holds beneath the 20-day exponential moving average (EMA) at 0.7103 and the 50% Fibonacci retracement at 0.7054.

The pair is hovering just above the 61.8% retracement at 0.7002, while the Relative Strength Index (14) around 39 hints at weak, but not extreme, downside momentum after the recent slide from the mid-0.72 area.

On the downside, initial support emerges at the 61.8% Fibonacci retracement at 0.7002, ahead of the 78.6% level at 0.6929 and the swing low anchor around the 100% retracement at 0.6834. On the topside, a recovery would first need to clear the 50% retracement at 0.7054, followed by a dense resistance zone formed by the 20-day EMA at 0.7103 and the 38.2% retracement at 0.7106, with further bullish scope only opening toward the 23.6% level at 0.7171 and the recent cycle high near 0.7274.

Currency Hedger No Comments

Canadian Dollar advances as Middle East uncertainty weighs on US Dollar

  • USD/CAD falls as the US Dollar pauses ahead of Middle East updates and crucial Fed policy data.
  • A hot US inflation report solidified expectations for a “higher-for-longer” Federal Reserve interest rate environment.
  • The Canadian Dollar may weaken as falling oil prices follow reports of the US completing military strikes in Iran.

USD/CAD loses ground for the third successive day, trading around 1.3940 during the Asian hours on Thursday. The pair depreciates as the US Dollar (USD) holds losses as investors assess ongoing Middle East tensions with anticipation of upcoming US economic data, which could signal the Federal Reserveโ€™s next policy moves.

The Greenback may regain its ground amid rising safe-haven demand due to the ongoing Middle East conflict. Israeli military says that the Home Front Command, the branch of the Israel Defense Forces (IDF) responsible for civil defense, issued an early warning after launches from Lebanon toward northern Israel.

The US Dollar (USD) gained ground after a hot inflation report released on Wednesday, which effectively solidified expectations for a “higher-for-longer” interest rate environment from the Federal Reserve. Driven primarily by war-induced energy price spikes, US inflation accelerated in May to its fastest pace in over three years. %. Traders await the upcoming release of the May Producer Price Index (PPI) and Initial Jobless Claims later today.

The US Consumer Price Index (CPI) rose 4.2% year-over-year and 0.5% monthly, both perfectly matching market forecasts. Meanwhile, core CPI, which strips out volatile food and energy costs, climbed 0.2% on the month and 2.9% annually. Following the data release, financial markets aggressively pivoted, abandoning any remaining expectations for Fed rate cuts this year.

The downside of the USD/CAD pair could be restrained as the commodity-linked Canadian Dollar (CAD) may face challenges amid lower oil prices, given Canadaโ€™s status as the largest crude exporter to the United States (US).

West Texas Intermediate (WTI) oil holds losses near $89.50 per barrel at the time of writing. Crude oil prices eased after the US military announced it had completed its latest strikes on Iran, raising hopes that peace negotiations could resume and tempering oil supply concerns.

Earlier, the US launched fresh attacks on Iran after President Trump accused Tehran of delaying talks on an interim peace agreement, while Iran reportedly responded by targeting US vessels in the Strait of Hormuz.

Currency Hedger No Comments

GBP/USD Price Forecast: Eyes 1.3400 amid modest USD weakness; remains below weekly top

  • GBP/USD gains some positive traction as easing inflationary concerns weigh on the USD.
  • Fed rate hike bets and rising US-Iran tensions should limit USD losses and cap spot prices.
  • The mixed technical setup, too, warrants caution before positioning for further upside.

The GBP/USD pair attracts some dip-buyers during the Asian session on Tuesday and stalls the previous day’s pullback from the 1.3425 region, or the weekly high. Spot prices currently trade around the 1.3385 zone, up just over 0.10% for the day, though the upside potential seems limited.

The US Dollar (USD) edges lower as soft US Core Consumer Price Index (CPI) eased concerns about a runaway inflation spiral and turned out to be a key factor acting as a tailwind for the GBP/USD pair. Traders, however, are still pricing in a 70% chance that the US Federal Reserve (Fed) will hike interest rates by the end of this year. Apart from this, renewed hostilities between the US and Iran help limit deeper USD losses, capping the upside for the currency pair.

From a technical perspective, the GBP/USD pair keeps a bearish near-term bias beneath the 200-period Simple Moving Average (SMA) on the 4-hour chart, which coincides with the 50% Fibonacci retracement level of the recent slide from the 1.3655 region. Moreover, repeated failures to build on the momentum beyond the 23.6% Fibo. level warrants caution before positioning for any meaningful appreciating move in the near-term, despite improving momentum indicators.

The Moving Average Convergence Divergence (MACD) histogram remains slightly positive, while the Relative Strength Index (RSI) hovers near the neutral 50 mark. This hints at modest underlying demand but not yet enough to challenge the prevailing topside barriers at 1.3438 (38.2% level) and the 1.3475-1.3480 confluence โ€“ the 200-period SMA on the 4-hour chart and the 50% Fibo. Above that, the GBP/USD pair could rise to deeper Fibo. hurdles at 1.3520 and 1.3579.

On the downside, structural support is only clearly defined near the recent swing low anchor at 1.3305. A convincing break below this floor would likely reassert bearish momentum and make the GBP/USD pair vulnerable to further weakness. The broader setup, however, reinforces the idea of a market that is consolidating under medium-term resistance.

(The technical analysis of this story was written with the help of an AI tool.)

GBP/USD 4-hour chart

Chart Analysis GBP/USD

US Dollar Price Today

The table below shows the percentage change of US Dollar (USD) against listed major currencies today. US Dollar was the strongest against the Japanese Yen.

USDEURGBPJPYCADAUDNZDCHF
USD-0.13%-0.13%-0.03%-0.05%-0.08%-0.06%-0.21%
EUR0.13%-0.00%0.09%0.07%-0.06%0.09%-0.08%
GBP0.13%0.00%0.11%0.08%-0.04%0.10%-0.08%
JPY0.03%-0.09%-0.11%-0.02%-0.16%-0.02%-0.17%
CAD0.05%-0.07%-0.08%0.02%-0.13%0.02%-0.16%
AUD0.08%0.06%0.04%0.16%0.13%0.15%-0.05%
NZD0.06%-0.09%-0.10%0.02%-0.02%-0.15%-0.17%
CHF0.21%0.08%0.08%0.17%0.16%0.05%0.17%

The heat map shows percentage changes of major currencies against each other. The base currency is picked from the left column, while the quote currency is picked from the top row. For example, if you pick the US Dollar from the left column and move along the horizontal line to the Japanese Yen, the percentage change displayed in the box will represent USD (base)/JPY (quote).

Currency Hedger No Comments

Indian Rupee slumps as oil price surges amid fears of US-Iran ceasefire collapse

  • The Indian Rupee faces intense selling pressure against the US Dollar due to a strong recovery in oil prices.
  • FIIs continue to squeeze their stake in the Indian stock market.
  • Indiaโ€™s CPI in May is seen higher at 4% YoY from 3.48% in April.

The Indian Rupee (INR) tumbles at open against the US Dollar (USD) on Thursday, with the USD/INR pair rising to near 95.65. The pair gains as a sharp recovery in oil prices due to fears surrounding the collapse of the ceasefire between the United States (US) and Iran has weakened the Indian Rupee.

In Indiaโ€™s morning session, the MCX Crude Oil contract expiring on June 18 is up 0.7% to near 8,787. The contract surged 3.6% on Wednesday even after recovering significant losses.

The appeal of currencies from economies, such as India, which rely heavily on oil imports to meet their energy needs, diminishes in a high oil price environment.

US launches strikes against Iranโ€™s unwarranted aggression

On late Wednesday, the US Central Command (CENTCOM) confirmed that it launched additional โ€œself-defense strikesโ€ on multiple targets in Iran as retaliation against Tehranโ€™s “unwarranted and continued aggressionโ€. This came after the US CENTCOM launched a series of attacks on Iranโ€™s air defense, ground control stations, and surveillance radar sites near the Strait of Hormuz on Tuesday in response to Iran shooting down the US Apache helicopter.

Additional military operations from Washington were already anticipated as US President Donald Trump said in an interview with Fox News that he is close to ordering new strikes against Iran for taking too long in finalizing a deal.

Before remarks pointing to ordering fresh strikes against Iran, US President Trump also said in a post on Truth Social that Iran has to pay the price for taking too much time in reaching a deal.

However, the ceasefire between the US and Iran announced in April appears not to have collapsed yet as US President Trump has told aides to deliver a message to Iran via Qatar that the attacks did not mean a โ€œrestart of all-out war,โ€ and were only in response to the helicopter downing, The Wall Street Journal (WSJ) reported.

FIIs keep squeezing stake in Indian stock market

Overseas investors continue to pare their stake in the Indian stock market as higher oil prices keep weighing on India Inc.โ€™s earnings projections. So far in June, Foreign Institutional Investors (FIIs) have remained net sellers on all trading days and have offloaded their stake worth Rs. 62,654.34 crore.

Indiaโ€™s CPI data awaited

On the domestic front, the major trigger for the Indian Rupee will be the Consumer Price Index (CPI) data for May, which will be published on Friday. Investors will closely monitor the data to get fresh cues regarding the Reserve Bank of Indiaโ€™s (RBI) monetary policy outlook.

In the policy meeting last week, the RBI kept the Repo Rate unchanged at 5.25%, as expected, and warned that the central bank would need to act โ€œif inflation gets generalizedโ€.

Indiaโ€™s CPI data is expected to arrive higher at 4% Year-on-Year from 3.48% in April.

Technical Analysis: USD/INR stays in Symmetrical Triangle formation

USD/INR trades higher at around 95.65 at press time. The near-term trend of the pair appears to be sideways in an overall bullish structure amid the Symmetrical Triangle formation. The pair remains close to the 20-day exponential moving average (EMA), which is at 95.4886, indicating a sideways trend.

The Relative Strength Index (RSI) at 53.79 is near neutral but slightly positive, hinting that upside pressure persists, even as the pair consolidates beneath the descending resistance trend structure derived from prior highs.

On the topside, initial resistance is seen at the bearish trend-line break area near 96.03, where a clear daily close above would open the way for a more sustained recovery towards the all-time high at 97.08. On the downside, immediate support sits at the 20-day EMA at 95.49, with the next, more structural, floor at the rising trend-line region around 94.77; a break below this latter level would weaken the current constructive tone and expose deeper retracements.