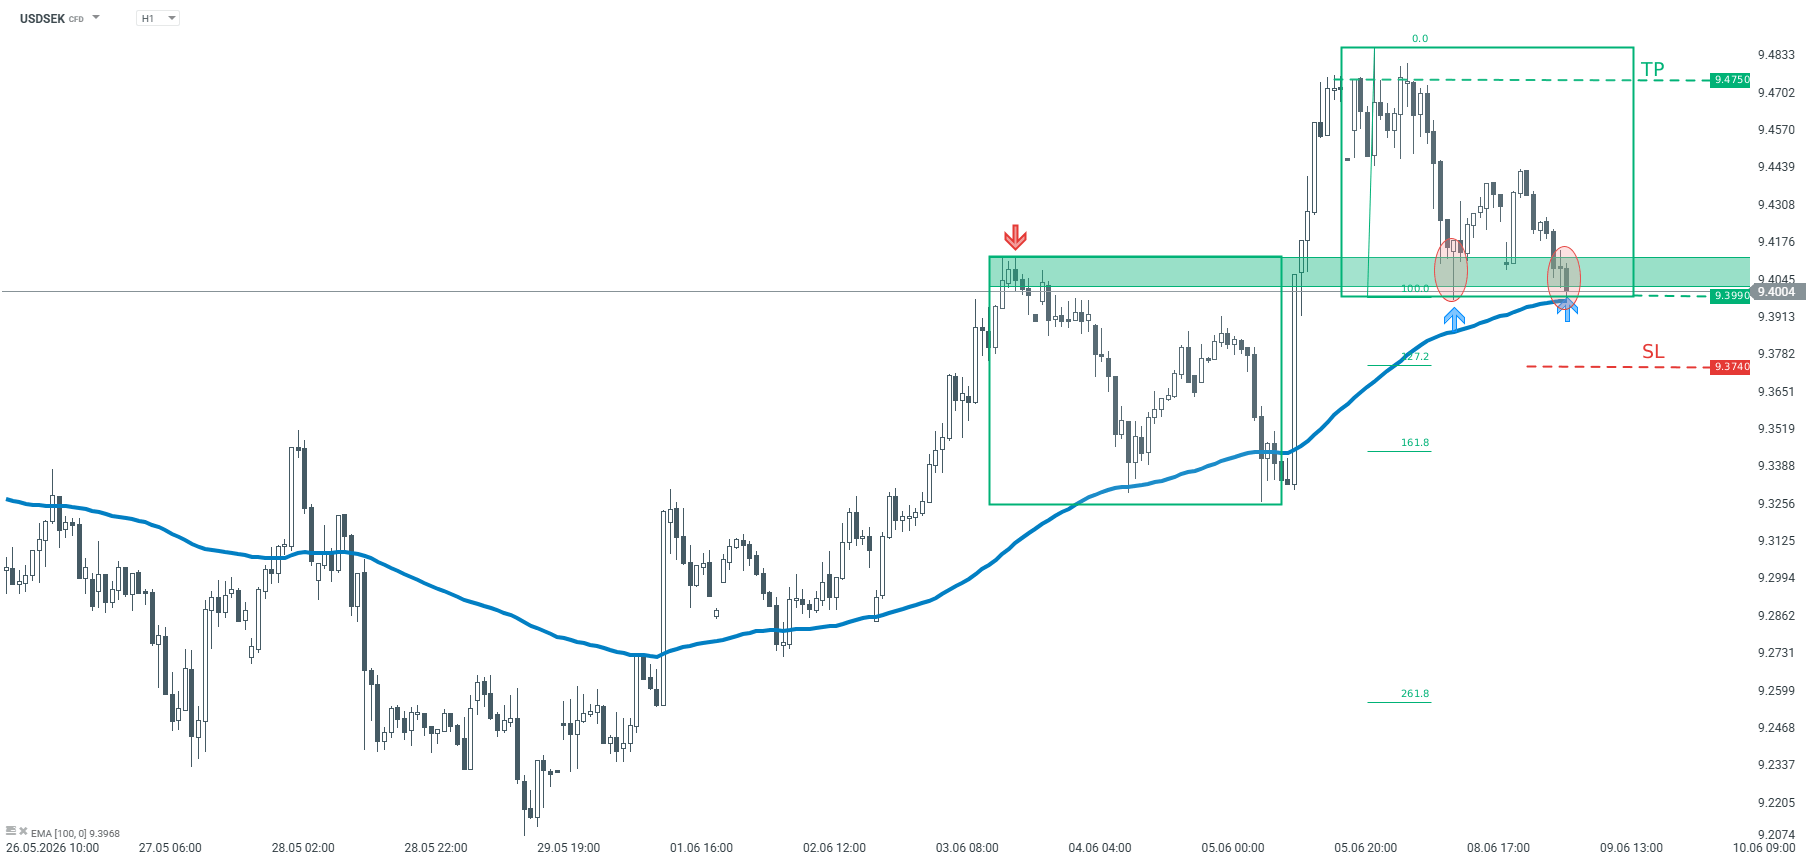
The pair is trading above the 100-period moving average from H1 interval
Recommendation: Trade: Long position on USDSEK market price Target: 9.4750 Stop: 9.3740
Opinion:
USDSEK reached a key technical support yesterday which is marked with a lower limit of 1:1 structure. The level is being tested again today and should buyers manage to hold the price above, the main sentiment remains bullish. The support at 9.3990 is also marked by the 100-period exponential moving average from H interval. According to the Overbalance methodology, as long as the price sits above the 9.3990, one should expect price to continue the upward move. We recommend going long USDSEK at market price with a target of 9.4750. We also recommend placing a stop loss order at 9.3740.
NZD/USD may find initial support at the rectangle’s lower boundary near 0.5790.
The 14-day Relative Strength Index around 43 suggests waning upside momentum rather than outright oversold conditions.
The initial barrier lies at the nine-day EMA of 0.5853.
NZD/USD gains ground for the second successive day, trading around 0.5810 during the Asian hours on Tuesday. Technical analysis of the daily chart suggests the spot price is moving sideways within a rectangle pattern, reflecting a period of market consolidation and indecision.
The NZD/USD pair is maintaining a bearish near-term bias as spot holds beneath both the nine-day and 50-day Exponential Moving Averages (EMAs). The alignment of price below these short- and medium-term EMAs suggests rallies are likely to be sold, while a soft 14-day Relative Strength Index (RSI) reading around 43 hints at waning upside momentum rather than outright oversold conditions.
The NZD/USD pair may find initial support at the lower boundary of the rectangle around 0.5790, followed by the two-week low of 0.5782, recorded on June 8. A break below this confluence support zone would put downward pressure on the pair to navigate the region around a six-month low of 0.5681, which was recorded on April 6.
On the upside, the NZD/USD pair may rise toward the primary barrier at the nine-day EMA of 0.5853, followed by the 50-day EMA at 0.5875. A successful break above these moving averages could support the pair to approach the upper boundary of the rectangle around 0.5990, followed by the three-month high of 0.5995, which was reached on February 29.
(The technical analysis of this story was written with the help of an AI tool.)
New Zealand Dollar Price Today
The table below shows the percentage change of New Zealand Dollar (NZD) against listed major currencies today. New Zealand Dollar was the strongest against the Japanese Yen.
USD
EUR
GBP
JPY
CAD
AUD
NZD
CHF
USD
-0.02%
-0.07%
0.05%
-0.04%
0.00%
-0.18%
-0.04%
EUR
0.02%
-0.02%
0.09%
-0.01%
0.07%
-0.12%
0.01%
GBP
0.07%
0.02%
0.13%
0.06%
0.06%
-0.11%
0.04%
JPY
-0.05%
-0.09%
-0.13%
-0.08%
-0.03%
-0.21%
-0.08%
CAD
0.04%
0.01%
-0.06%
0.08%
0.04%
-0.12%
0.00%
AUD
-0.00%
-0.07%
-0.06%
0.03%
-0.04%
-0.16%
-0.04%
NZD
0.18%
0.12%
0.11%
0.21%
0.12%
0.16%
0.12%
CHF
0.04%
-0.01%
-0.04%
0.08%
-0.00%
0.04%
-0.12%
The heat map shows percentage changes of major currencies against each other. The base currency is picked from the left column, while the quote currency is picked from the top row. For example, if you pick the New Zealand Dollar from the left column and move along the horizontal line to the US Dollar, the percentage change displayed in the box will represent NZD (base)/USD (quote).
EUR/JPY gathers strength near 184.85 in Tuesday’s early European session.
The cross keeps the bullish vibe, but further consolidation cannot be ruled out in near term with neutral RSI momentum.
The initial support level is seen at 184.50; the immediate resistance level to watch is 185.12.
The EUR/JPY cross holds positive ground around 184.85 during the early European session on Tuesday. A hawkish stance from the European Central Bank (ECB) underpins the Euro (EUR) against the Japanese Yen (JPY). The ECB will hold its June monetary policy meeting on Thursday. Markets have fully priced in a 25-basis-point (bps) rate hike after Eurozone inflation surged to 3.2%.
Markets are on high alert for foreign exchange intervention from Japanese authorities. This, in turn, might support the JPY and act as a headwind for the cross. Japanese authorities have issued strong verbal warnings, stating that the government is fully prepared to take decisive and appropriate action to protect the domestic currency.
Technical Analysis:
In the daily chart, EUR/JPY holds a constructive bullish bias as spot remains above the 100-day simple moving average (SMA) and the Bollinger band midline. Price also sits comfortably above the lower Bollinger band, suggesting the broader uptrend structure is still intact, while the Relative Strength Index (RSI) at 45.9 leans slightly soft but remains in neutral territory, hinting at consolidative rather than impulsive downside momentum.
On the downside, the initial support zone is formed by the 100-day SMA at 184.50, followed by the lower Bollinger band near 184.20, which should limit deeper pullbacks if the bullish structure is to persist. The first upside barrier emerges at the the Bollinger band midline at 185.12, en route to the upper boundary of the Bollinger Band at 185.12. Any follow-through buying above this level could pave the way to the 186.00 psychological level.
The Indian Rupee bounces back against the US Dollar as Israel-Iran ceasefire pushes oil prices lower.
US President Trump expresses confidence that a total victory over Iran could be announced in two weeks.
Investors shift focus to the US-India CPI data for May.
The Indian Rupee (INR) rebounds against the US Dollar (USD) at open on Tuesday after a sharp decline the previous day. The USD/INR pair drops to near 95.50 as oil prices tumble, following reports of a ceasefire between Israel and Iran after the exchange of attacks over the weekend.
As of writing, the MCX Crude Oil contract expiring on June 18 is down 1% to near 8,600. Currencies from economies, such as India, which rely heavily on oil imports to meet their energy needs, tend to underperform in a high oil price environment.
Iran-Israel ceasefire drags oil prices
Oil prices started retreating after a strong start on Monday, following confirmation from Iran that it will stop attacking on Israeli territory. However, Iran’s armed forces warned of harsher attacks if Israel resumes attacks on Lebanon.
Iran agreed to a truce with Israel after United States (US) President Donald Trump urged both to stop attacking each other immediately.
On late Monday, US President Trump expressed confidence that Washington can announce a total victory over Iran in the next two weeks and “oil prices will come tumbling down”.
FIIs keep paring stake in Indian stock market
Overseas investors continue to lighten their stakes in the Indian stock market amid growing concerns over India Inc.’ earnings projections in the wake of higher energy prices. So far in June, Foreign Institutional Investors (FIIs) have remained net sellers on all trading days, and have offloaded their stake worth Rs. 36,370.14 crore. In May, FIIs also remained net sellers and sold their investments worth Rs. 55,963.33 crore.
Investors await US-India CPI data
This week, major triggers for USD/INR will be the Consumer Price Index (CPI) data for May from both the US and India, which will be released on Wednesday and Friday, respectively. The US headline CPI is expected to arrive higher at 4.2% Year-on-Year (YoY) from 3.8% in April. In the same period, the US core CPI – which excludes volatile food and energy items – is seen higher at 2.9% from the previous reading of 2.8%.
Signs of US inflationary pressures accelerating further would prompt expectations of interest rate hikes by the Federal Reserve (Fed) this year.
Meanwhile, India’s CPI data for May is also expected to come in higher at 4% YoY from 3.48% in April.
Last week, the Reserve Bank of India (RBI) warned of upside inflation risks in the monetary policy announcement and stated that it would act if it becomes more persistent. “If inflation becomes generalized, persistent and starts influencing inflation expectations, policy action may become necessary,” the RBI Governor Sanjay Malhotra said.
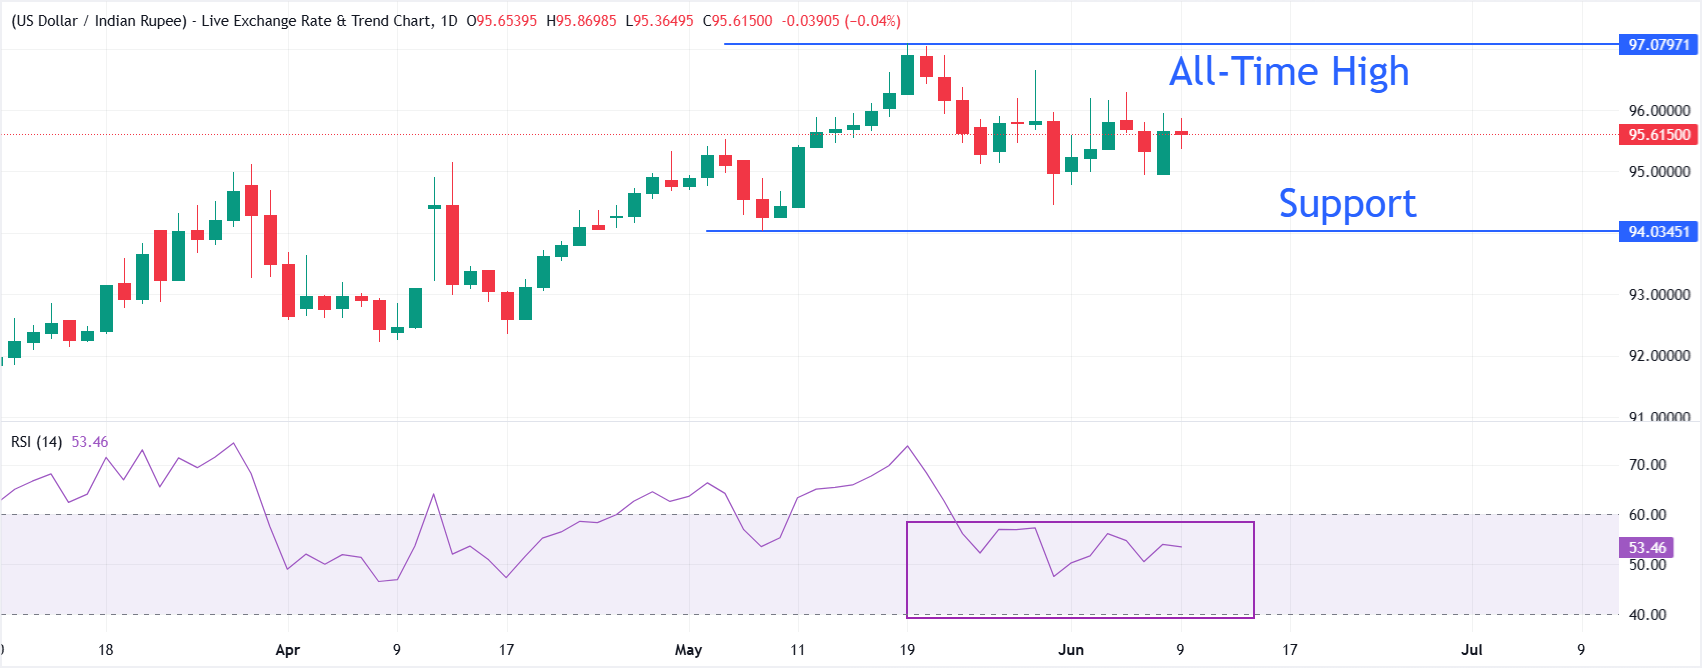
Technical Analysis: USD/INR sees downside below 95.00
USD/INR trades slightly lower at around 95.50. The pair is essentially flat, trading sideways for almost two weeks. The Relative Strength Index (RSI) at 53.46 hovers just above the midline, hinting at balanced momentum with only a slight bullish tilt but no clear directional conviction.
On the downside, the pair could slide towards the May 07 low at 94.03 if it fails to hold the key support level of 95.00. Looking up, the pair could aim to revisit the all-time high above 97.00 if it manages to recover above the June 4 high at 96.30.
USD/JPY attracts some buyers on Tuesday, though the uptick lacks bullish conviction.
Intervention fears and BoJ rate hike bets support the JPY, capping gains for the major.
The Israel-Iran truce weighs on the USD and further acts as a headwind for spot prices.
The USD/JPY pair struggles to build on a modest Asian session uptick on Tuesday and remains below its highest level since April 30, set the previous day. Spot prices, however, hold above the 160.00 psychological mark and seem unaffected by a broadly weaker US Dollar (USD).
Iran and Israel said that they had halted attacks on each other after an appeal from US President Donald Trump. This drags the USD Index (DXY), which tracks the safe-haven Greenback against a basket of currencies, away from a two-month high, touched on Monday, and acts as a headwind for the USD/JPY pair. Furthermore, speculations that authorities will step in again to prop up the Japanese Yen (JPY) contribute to capping spot prices.
In fact, Japan’s Finance Minister Satsuki Katayama reiterated earlier today that the stance is unchanged and authorities are prepared for decisive measures. The JPY bulls, however, seem hesitant amid worries that Japan’s economy will remain under strain due to the Middle East conflict and the continued energy supply disruptions through the Strait of Hormuz. This offsets Bank of Japan (BoJ) rate hike bets and further supports the USD/JPY pair.
Meanwhile, firming expectations that the US Federal Reserve (Fed) will raise borrowing costs by the end of this year, along with the uncertainty over the US-Iran peace deal, should limit USD losses. Investors might also opt to wait for the US inflation figures – Consumer Price Index (CPI) and Producer Price Index (PPI) on Wednesday and Thursday, respectively. This warrants some caution before confirming that the USD/JPY pair has formed a near-term top.
Japanese Yen Price Last 30 days
The table below shows the percentage change of Japanese Yen (JPY) against listed major currencies last 30 days. Japanese Yen was the strongest against the Swiss Franc.
USD
EUR
GBP
JPY
CAD
AUD
NZD
CHF
USD
1.59%
1.53%
2.08%
2.04%
2.24%
1.90%
2.13%
EUR
-1.59%
-0.09%
0.52%
0.48%
0.57%
0.28%
0.53%
GBP
-1.53%
0.09%
0.62%
0.58%
0.75%
0.39%
0.62%
JPY
-2.08%
-0.52%
-0.62%
-0.05%
0.00%
-0.23%
0.07%
CAD
-2.04%
-0.48%
-0.58%
0.05%
0.02%
-0.18%
0.09%
AUD
-2.24%
-0.57%
-0.75%
-0.00%
-0.02%
-0.23%
-0.03%
NZD
-1.90%
-0.28%
-0.39%
0.23%
0.18%
0.23%
0.14%
CHF
-2.13%
-0.53%
-0.62%
-0.07%
-0.09%
0.03%
-0.14%
The heat map shows percentage changes of major currencies against each other. The base currency is picked from the left column, while the quote currency is picked from the top row. For example, if you pick the Japanese Yen from the left column and move along the horizontal line to the US Dollar, the percentage change displayed in the box will represent JPY (base)/USD (quote).
EUR/USD gains ground to around 1.1545 in Tuesday’s early European session.
The ECB is widely expected to raise its key interest rates at its June policy meeting on Thursday.
Trump said he might have a proposal for the Iran agreement within days.
The EUR/USD pair gathers strength near 1.1545 during the early European trading hours on Tuesday, bolstered by the hawkish stance of the European Central Bank (ECB). Traders brace for the US Consumer Price Index (CPI) data on Wednesday. On Thursday, all eyes will be on the ECB interest rate decision.
The ECB is set to raise its key interest rate for the first time in almost three years at the upcoming June policy meeting on Thursday, becoming the first of its peers to tighten policy in response to a jump in energy prices caused by the conflict in the Middle East.
“At its 11 June meeting, the ECB is very likely to raise its key interest rates by 25 basis points, in line with its recent hawkish communication,” said Martin Wolburg, senior economist at Generali Investments.
ECB President Christine Lagarde will hold the press conference to deliver the monetary policy statement and take questions from journalists. Any hawkish comments from ECB policymakers could provide some support to the Euro (EUR) against the Greenback in the near term.
US President Donald Trump said on Tuesday that he might have a proposal for the Iran agreement within days, per Reuters. However, the uncertainty surrounding the Middle East remains high. Earlier Monday, Israeli Prime Minister Benjamin Netanyahu said that the war against Iran and its Lebanon-based proxy Hezbollah “has not yet ended,” though he insisted both are weaker than ever. Signs of rising tensions in the Middle East could boost the US Dollar (USD) as a safe-haven currency and act as a headwind for the major pair.
The offshore yuan held its gains around 6.78 per dollar on Tuesday, as stronger-than-expected trade data highlighted the resilience of China’s export sector despite signs of an economic slowdown. Exports surged 19.4% year-on-year to a record USD 376.8 billion in May, driven by inventory building aimed at mitigating rising shipping and energy costs linked to the Gulf conflict, alongside robust demand for semiconductors and AI-related products. While the Middle East conflict has yet to significantly affect exports, weak domestic demand continues to leave the economy vulnerable to a deterioration in global conditions, reinforcing expectations for further policy easing. Meanwhile, imports jumped 27.4% to USD 271.4 billion, beating forecasts of a 25% increase as firms stepped up purchases of foreign chips and equipment. Consequently, China’s trade surplus widened to USD 105.4 billion, its highest level since January.
On Thursday (June 11), the ECB will announce its interest rate decision. Markets have almost fully priced in a rate hike.
Nearly two additional rate hikes are priced in for the remaining months of the year (the second one at approx. 73%).
On Wednesday (June 10), May CPI inflation data for the United States will be released.
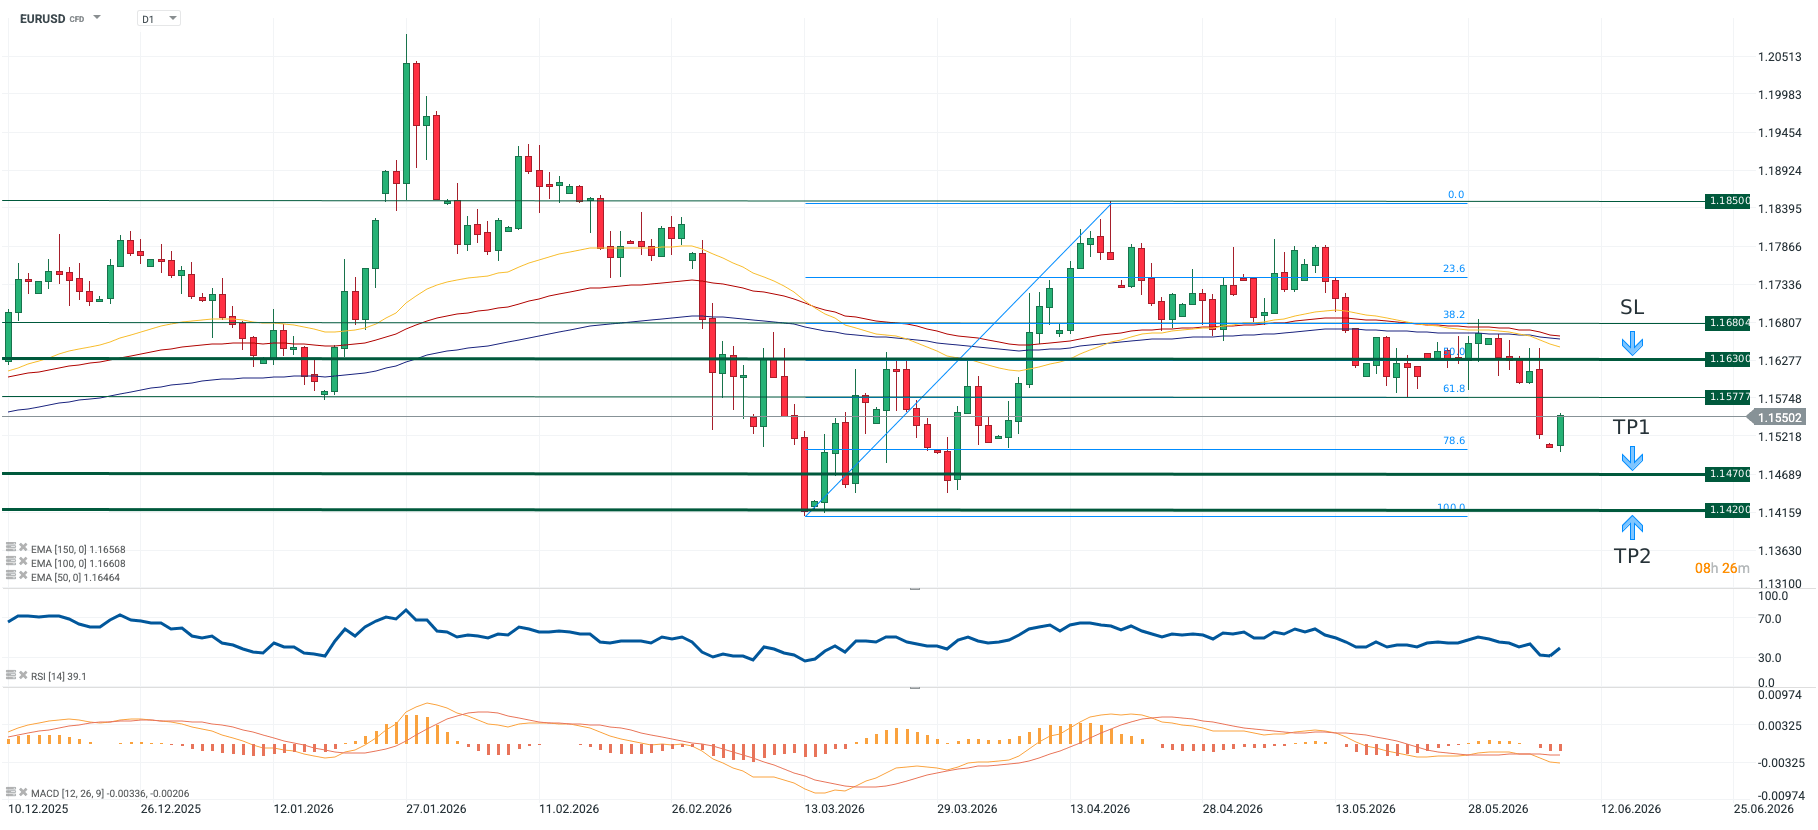
The EURUSD pair is oscillating around 1.15500, between two key support levels determined by the 61.8% and 78.6% Fibonacci retracements.
The price is trading significantly below its three major moving averages: EMA 50 (1.16568), EMA 100 (1.16608), and EMA 150 (1.16464).
The RSI (14) indicator stands at 39.1.
Recommendation
Position: Short (SELL) on EURUSD at market price (1.15502).
Take Profit (TP): 1.14700 (TP1), 1.14200 (TP2)
Stop Loss (SL): 1.16300
Figure 1: EURUSD (10.12.2025 – 25.06.2026)
Source: xStation5, 08.06.2026 (15:34)
Opinion
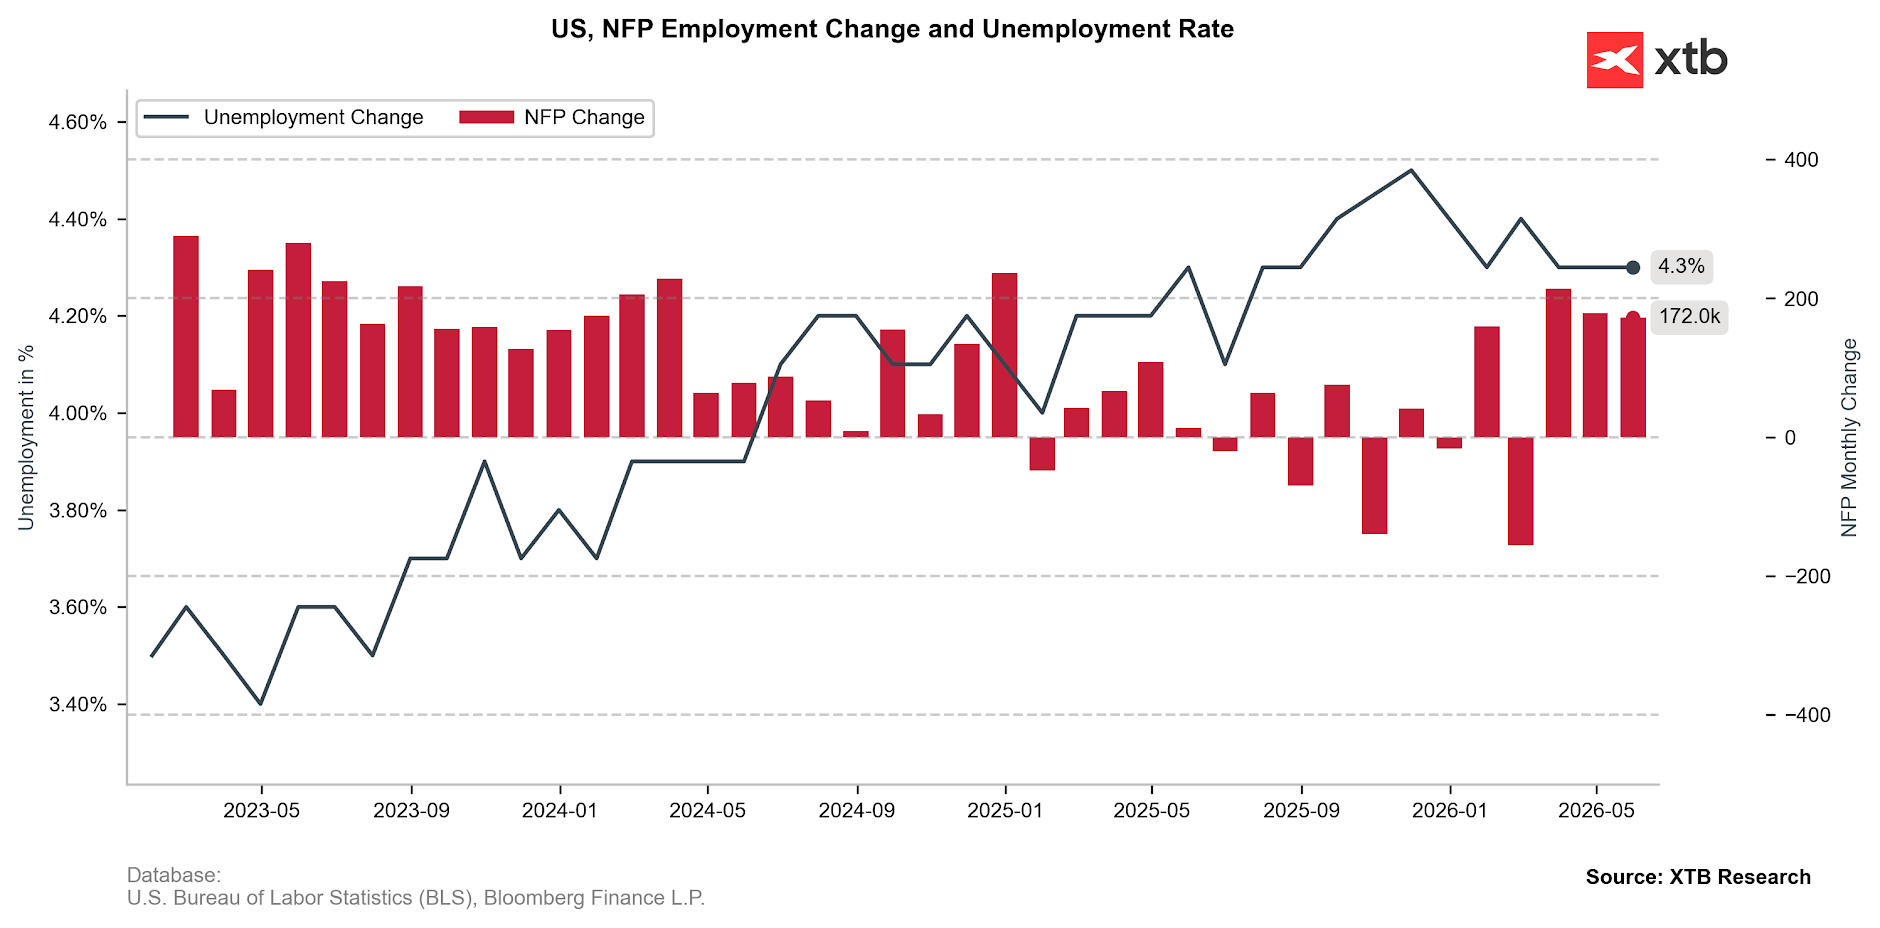
The EURUSD pair has weakened significantly from its mid-April peak, when it approached the 1.18500 level. The key drivers behind this downward move are the prolonged negotiations between the US and Iran, alongside a substantial increase in market expectations for US interest rate hikes. Markets have now fully priced in a rate increase before the end of the year, following Friday’s release of very strong NFP (Non-Farm Payrolls) data from the US labor market. Figure 2: Change in Non-Farm Payrolls (NFP) and Unemployment Rate in the US (2023 – 2026)
Source: XTB Research, 08.06.2026
Geopolitics and monetary policy should remain the primary focus for investors this week as well. Any headlines suggesting that a breakthrough in reopening the Strait of Hormuz is slipping away could weigh on the EURUSD pair, a dynamic already observed during this morning’s trading session. Paradoxically, the Euro’s decline could also be fueled by Thursday’s anticipated interest rate hike from the ECB. Since this move is already nearly 100% priced in by the markets, investor attention will shift away from the decision itself and onto the accompanying rhetoric. Frankly speaking, if the ECB were to hold rates for any reason, it would trigger a massive sell-off in the Euro. However, the single currency could also be weakened by President Christine Lagarde herself, who will take the podium on Thursday afternoon to address and potentially challenge market assumptions regarding the central bank’s upcoming steps.
Lagarde has rarely accustomed us to being overly transparent or hawkish in her communications. Consequently, any signs of her emphasizing economic stagnation risks could be interpreted by markets as dovish – especially if inflation concerns are given a slightly lower priority than they were a month ago. Speaking of inflation, Wednesday’s US CPI print for May is a crucial milestone. Further growth in price pressures is expected. The core gauge, which excludes highly volatile food and energy prices, will be critical, as it will reveal the extent to which the energy shock has filtered into other sectors of the economy. From a technical analysis perspective: The pair has broken below the 61.8% Fibonacci retracement level (1.15777) as well as the EMA 50, 100, and 150 moving averages, justifying further declines. The MACD histogram is systematically deepening its lows in negative territory, and the RSI (14) still has ample room to slide before hitting oversold territory.
Methodology
The recommendation was prepared based on a fundamental analysis of the respective economies (including monetary policy in both the Eurozone and the US), as well as a technical analysis of the EURUSD chart. The direction of the recommendation was determined by assessing the monetary policy divergence between the Fed and the ECB, confirmed by the medium-term downward trend on the chart. Take Profit and Stop Loss levels were determined using Fibonacci retracements and key horizontal support/resistance levels (TP1 between Fibo 78.6% and Fibo 100.0%, TP2 directly at the Fibo 100.0% level, and the SL at the Fibo 50.0% level).
To provide the best experiences, we use technologies like cookies to store and/or access device information. Consenting to these technologies will allow us to process data such as browsing behavior or unique IDs on this site. Not consenting or withdrawing consent, may adversely affect certain features and functions.
Functional
Always active
The technical storage or access is strictly necessary for the legitimate purpose of enabling the use of a specific service explicitly requested by the subscriber or user, or for the sole purpose of carrying out the transmission of a communication over an electronic communications network.
Preferences
The technical storage or access is necessary for the legitimate purpose of storing preferences that are not requested by the subscriber or user.
Statistics
The technical storage or access that is used exclusively for statistical purposes.The technical storage or access that is used exclusively for anonymous statistical purposes. Without a subpoena, voluntary compliance on the part of your Internet Service Provider, or additional records from a third party, information stored or retrieved for this purpose alone cannot usually be used to identify you.
Marketing
The technical storage or access is required to create user profiles to send advertising, or to track the user on a website or across several websites for similar marketing purposes.