GBP/USD remains flat at 1.3200, halfway through the last two weeks’ trading range.
Investors’ appetite for risk remains subdued amid a fresh escalation of the US-Iran hostilities this weekend.
Technical indicators are showing initial signs of bottoming at the 1.3050 area.
The British Pound (GBP) is practically flat against the US Dollar (USD) on Monday, with Pound bulls subdued amid rising geopolitical tensions and the UK’s political impasse, while the safe-haven USD treads water, awaiting an array of US employment indicators. The GBP/USD pair remains steady at 1.3200 halfway through the last two weeks’ trading range.
Investors are wary of risk at the week’s opening, despite the latest agreement to end a series of attacks in the Strait of Hormuz this weekend, which had shaken a precarious ceasefire. US and Iranian negotiators have also agreed to restart peace talks this week, in the latest attempt to end a four-month-long conflict that threatened to collapse the global economy.
In the UK, political uncertainty is likely to keep the Pound’s upside attempts limited until the next Prime Minister starts to define his political agenda. In the US, on the other hand, a string of employment indicators, including Thursday’s key Nonfarm Payrolls report, are expected to shed further light on the Federal Reserve’s monetary policy path.
Technical Indicator: Pound shows initial signs of bottoming
GBP/USD trades at 1.3210, with the bearish bias still in place after a nearly 3% decline in the last two months. Recent price action, however, shows signs of a potential bottoming in the mid-range of the 1.3100s, with momentum indicators in 4-hour charts turning bullish.
The 4-hour Relative Strength Index (14) around 50.7 hints at neutral momentum, and the Moving Average Convergence Divergence (MACD), hovering slightly above zero with a modestly positive line, shows an incipient upside pressure ahead of key resistance levels.
Bulls are likely to be tested at the top of the last two weeks’ horizontal channel, near 1.3270 (June 22 high). Further up the 1.3320 area (June 8, 11 lows, and June 18 high) is likely to pose some resistance ahead of the mid-June highs at the 1.3440-1.3450 area.
On the downside, session lows at 1.3195 are holding bears on Monday, ahead of last week’s horizontal floor at 1.3140, which guards the path toward the November 2025 lows near the 1.3000 psychological level.
Pound Sterling Price Today
The table below shows the percentage change of British Pound (GBP) against listed major currencies today. British Pound was the strongest against the Japanese Yen.
USD
EUR
GBP
JPY
CAD
AUD
NZD
CHF
USD
-0.15%
-0.15%
0.05%
-0.09%
-0.09%
-0.25%
-0.11%
EUR
0.15%
-0.01%
0.20%
0.05%
0.09%
-0.09%
0.04%
GBP
0.15%
0.01%
0.21%
0.07%
0.08%
-0.11%
0.05%
JPY
-0.05%
-0.20%
-0.21%
-0.13%
-0.14%
-0.32%
-0.16%
CAD
0.09%
-0.05%
-0.07%
0.13%
-0.00%
-0.18%
-0.05%
AUD
0.09%
-0.09%
-0.08%
0.14%
0.00%
-0.17%
-0.02%
NZD
0.25%
0.09%
0.11%
0.32%
0.18%
0.17%
0.16%
CHF
0.11%
-0.04%
-0.05%
0.16%
0.05%
0.02%
-0.16%
The heat map shows percentage changes of major currencies against each other. The base currency is picked from the left column, while the quote currency is picked from the top row. For example, if you pick the British Pound from the left column and move along the horizontal line to the US Dollar, the percentage change displayed in the box will represent GBP (base)/USD (quote).
USD/CAD may rebound toward the initial barrier at the 14-month high of 1.4248.
The 14-day Relative Strength Index of 75.3 signals overbought conditions, hinting that the recent advance is vulnerable to a near-term corrective pullback.
The pair may find primary support at the nine-day EMA of 1.4155.
USD/CAD loses ground for the third successive day, trading around 1.4180 during the early European hours on Monday. The pair continues its losing streak after pulling back from 14-month highs. The technical analysis of the daily chart indicates the pair is remaining within the ascending channel pattern, signaling an ongoing bullish bias.
The USD/CAD pair is retaining a bullish near-term bias as it holds above both the nine-day and 50-day Exponential Moving Averages (EMAs). The alignment of price above these short- and medium-term EMAs suggests ongoing upside pressure, although the 14-day Relative Strength Index (RSI) at 75.3 signals overbought conditions, hinting that the latest advance could be vulnerable to consolidation or a corrective pullback.
The USD/CAD pair may rebound toward the 14-month high of 1.4248, reached on June 24, aligned with the upper boundary of the ascending channel. A sustained break above this confluence resistance zone would open the door for further gains toward 1.4400.
The primary support lies at the nine-day EMA of 1.4155. A break below the short-term price average would weaken the price momentum and put downward pressure on the pair to test the lower boundary of the ascending channel around 1.4020. Further declines would explore the region around the 50-day EMA at 1.3924.
USD/CAD: Daily Chart
(The technical analysis of this story was written with the help of an AI tool.)
Canadian Dollar Price Today
The table below shows the percentage change of Canadian Dollar (CAD) against listed major currencies today. Canadian Dollar was the strongest against the Japanese Yen.
USD
EUR
GBP
JPY
CAD
AUD
NZD
CHF
USD
-0.21%
-0.17%
0.03%
-0.09%
-0.09%
-0.27%
-0.13%
EUR
0.21%
0.04%
0.26%
0.11%
0.14%
-0.06%
0.08%
GBP
0.17%
-0.04%
0.21%
0.08%
0.08%
-0.12%
0.04%
JPY
-0.03%
-0.26%
-0.21%
-0.12%
-0.14%
-0.34%
-0.17%
CAD
0.09%
-0.11%
-0.08%
0.12%
-0.01%
-0.21%
-0.07%
AUD
0.09%
-0.14%
-0.08%
0.14%
0.00%
-0.19%
-0.04%
NZD
0.27%
0.06%
0.12%
0.34%
0.21%
0.19%
0.16%
CHF
0.13%
-0.08%
-0.04%
0.17%
0.07%
0.04%
-0.16%
The heat map shows percentage changes of major currencies against each other. The base currency is picked from the left column, while the quote currency is picked from the top row. For example, if you pick the Canadian Dollar from the left column and move along the horizontal line to the US Dollar, the percentage change displayed in the box will represent CAD (base)/USD (quote).
The Indian Rupee trades calmly near 94.35 against the US Dollar ahead of US-Iran talks and NFP data.
Iran stresses the recognition of its authority near the Strait of Hormuz.
The Fed is expected to deliver at least one interest rate hike this year.
The Indian Rupee (INR) trades flat against the US Dollar (USD) after a long weekend on Monday. The USD/INR pair wobbles around 94.35 as investors await the outcome of talks between the United States (US) and Iran, scheduled on Tuesday in Oman, regarding peace near the Strait of Hormuz, a critical chokepoint to almost one-fifth of global energy supply.
US-Iran agree on a ceasefire after trading attacks over weekend
The exchange of attacks between the US and Iran near the Strait of Hormuz over the weekend renewed fears of a global energy supply disruption again. Comments from Iran’s Foreign Minister Abbas Araghchi signaled that Tehran’s attacks were meant to demonstrate its intentions to have authority over the Hormuz.
Iran’s Foreign Minister Araghchi said that responsibility for the Strait of Hormuz lies solely with Tehran and warned that any attempt to bypass its preferred route in the waterway will cause “tension and escalation”. However, both nations later agreed on a ceasefire and scheduled talks regarding the same in Oman for Tuesday.
Market participants worry that signs of renewed conflicts between the two nations could lift oil prices again, which have returned close to their pre-war levels, a scenario that diminishes the appeal of currencies from economies, such as India, which rely heavily on oil imports to meet their energy needs.
US Dollar consolidates at start of US NFP week
The US Dollar Index, which gauges the Greenback’s value against six major currencies, trades calmly near 101.30. Investors seem to have sidelined, awaiting a slew of US data, especially the Nonfarm Payrolls (NFP) data for June, which will be released on Thursday.
Investors will pay close attention to the US NFP data for fresh cues regarding the Federal Reserve’s (Fed) monetary policy outlook. The impact of the official employment data will be significant as comments from new Fed Chairman Kevin Warsh in his monetary policy conference this month signaled that forward-looking statements from the central bank would be restricted in the current policy conjuncture.
According to the CME FedWatch tool, the odds of the Fed delivering at least one interest rate hike this year are almost 90%.
This week, investors will also focus on the US ISM Manufacturing PMI and the ADP Employment Change data for June, and the JOLTS Job Openings data for May.
Technical Analysis: USD/INR remains lower below 20-day EMA
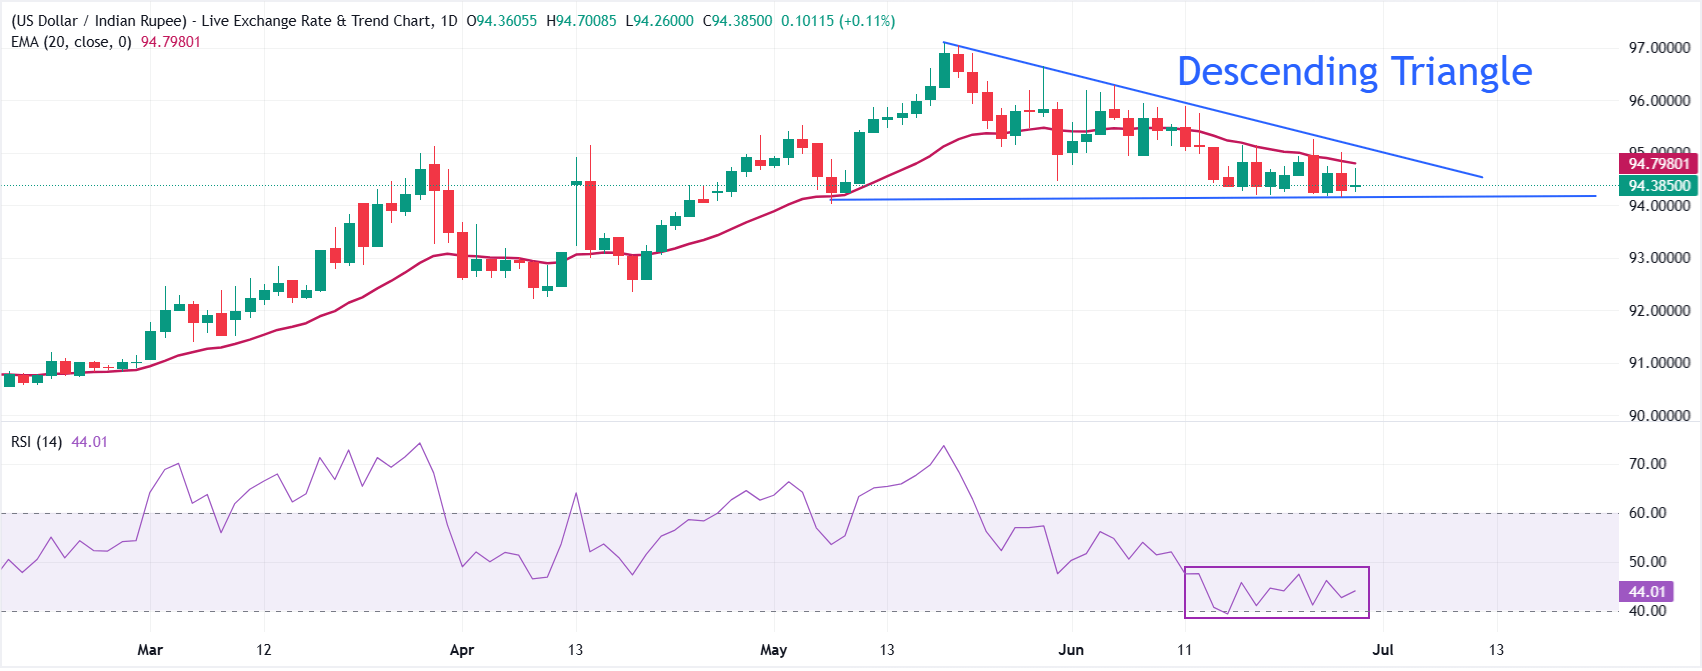
USD/INR trades flat at around 94.38, keeping a bearish near-term tone as spot holds below the 20-period exponential moving average (EMA) at 94.7980 and under the broader downward resistance trend line of the Descending Triangle formation starting near 97.1042.
The pair has been sliding off recent highs and now trades closer to its rising support line from 94.1051, while the Relative Strength Index (14) around 44 suggests waning bullish momentum and leaves the door open for further downside pressure.
On the topside, initial resistance is defined by the 20-period EMA at 94.7980, with a subsequent barrier coming from the longer-term descending trend line near 97.1042. On the downside, the immediate focus is on the horizontal support line drawn from 94.1051, with the current price area around 94.3850 acting as a pivotal zone where a sustained break lower would reinforce the bearish bias and expose deeper losses in the coming sessions.
EUR/JPY gains traction around 184.20 in Monday’s European session.
The negative outlook for the cross prevails under the key 100-day SMA, with bearish RSI momentum.
The initial support level is seen at 183.55; the first upside barrier to watch is 184.55.
The EUR/JPY cross trades in positive territory near 184.20 during the early European session on Monday. However, the potential upside for the cross might be limited as traders are nervous about a fragile US-Iran ceasefire.
The US and Iran traded fresh barbs over the weekend before they agreed to halt attacks and meet in Qatar on Tuesday. Uncertainty surrounding US-Iran talks could weigh on the riskier assets, such as the Euro (EUR) against the Japanese Yen (JPY).
Furthermore, mounting fears of Japanese market intervention could underpin the JPY. Japan’s Chief Cabinet Secretary Minoru Kihara said last week that officials will take appropriate action against the foreign exchange moves if needed.
The European Central Bank’s (ECB) annual forum this week will be closely watched as traders continue to monitor evolving central bank policies amid lower oil prices and stock market volatility. ECB President Christine Lagarde will open the forum on Monday. Any hawkish remarks from policymakers could help limit the EUR’s losses in the near term.
Technical Analysis:
In the daily chart, EUR/JPY holds a bearish near-term bias as the pair holds beneath the 100-day moving average and the Bollinger middle band. Price action remains capped by this clustered dynamic resistance, while the Relative Strength Index (14) at 42.65 stays below the neutral 50 line, hinting at fading bullish momentum rather than outright oversold conditions.
On the downside, initial support emerges at the lower Bollinger band around 183.55, which marks the first notable demand zone that could slow the current pullback. A clear break below this band would likely expose deeper corrective territory, while on the topside, a daily close back above the 100-day moving average at 184.55 would be needed to ease immediate pressure and open the way toward the Bollinger middle band near 184.95 and, later, the upper band at 186.35.
If you look at the copper market chart over the past 10 years, it might seem like a perfectly balanced system. Market “bears” love to point to these figures. Global consumption has grown to about 28 million tons per year, but the industry has coped. Production has increased, and supply has met demand. No copper apocalypse has happened yet.
At first glance, everything is under control — but this is a very dangerous illusion. Those who assess copper’s prospects relying only on the charts of the past decade are making a fundamental mistake. They see that the system has remained in balance, but they fail to understand how this balance has been maintained.
Personally, I have come to the conclusion that the copper market has survived due to powerful “compensators” in recent years. This refers to a phenomenal technological leap in mining, the depletion of the richest legacy deposits, and the aggressive pushed-to-the-limit collection of secondary raw materials. The problem is that all of these compensators are not infinite.
The era of easy solutions is over. To understand why the next 10 years of the copper market will not look like the previous decade, we need to put aside financial reports and recall the basic laws of physics.
www.barchart.com
A Physical Dead End: Why Copper Cannot Be Replaced
When we talk about oil, we know there are alternative sources of energy. Solar. Wind power. But when it comes to power electrical engineering, copper has become an unrivaled monopolist — and the reasons for this are embedded in the universe’s architecture itself.
Why is there so much aluminum, silicon, and iron on Earth but so little copper? The answer lies in the stars. All chemical elements lighter than iron are synthesized in the cores of stars during their normal lifespans, so they are abundant in the Earth’s crust. But copper is heavier than iron.
Elements of this type are born in the universe only during events like supernova explosions or neutron star mergers. Pure physics tells us that copper is inherently present in nature in orders of magnitude less than lighter metals. It is a non-renewable resource, and total geological reserves are fundamentally limited.
Ohm’s Law and the Engineer’s Trap
Copper has a uniquely low electrical resistivity. Only silver performs better, but it is too rare and insanely expensive for industrial use.
But why not replace copper with cheap aluminum, which is plentiful? This is where the main technological trap lies. Aluminum is great for overhead power lines where wire thickness is not critical, but aluminum’s resistance is much higher than copper’s resistance. If you try to wind an electric motor coil from aluminum wire instead of copper, you will have to make the motor much heavier to get the same power.
For the modern world — where the compactness and efficiency of electric vehicles (EVs), drones, and industrial robots are crucial — this is an engineering death sentence. You cannot put a refrigerator-sized motor in a modern EV. In closed systems where electricity is converted into kinetic energy, there is simply no substitute for copper.
Copper Devourers: The Real Reason for Exponential Demand
When the average person hears about copper demand, they probably imagine wires in the walls of new houses or cables for data centers. Yes, those use cases are important. But a cable in a wall is static demand — it is laid once and serves for decades. The real monster beginning to devour global copper reserves right now is the electric motor.
The world is in a stage of transitioning to electric propulsion, and this process is only gaining momentum. The heart of any electric motor is a tightly wound copper stator and rotor coil. The more motors, the faster copper reserves are depleted. Take EVs. The average electric car requires three to four times more pure copper than a traditional internal combustion engine (ICE) vehicle, and the lion’s share of this metal goes not into the wiring but directly into the massive power unit.
Add to this total automation. In modern factories, every new industrial robot, conveyor, servo drive, powerful pump, or climate-control system means dozens and hundreds of new electric motors.
Copper demand from electric drive manufacturers will grow not linearly, but exponentially. Humanity will produce hundreds of millions of new electric motors in the coming decade, and each of them will require a metal born in supernovas. A metal that engineers physically cannot replace with cheap aluminum.
Tactical Shock: AI Infrastructure and Liquid Cooling
While electric motors are a fundamental demand driver for the next decade, a massive tactical shock is also unfolding in the market right now: infrastructure for artificial intelligence (AI).
In 2024, at the peak of the first wave of the AI hype, investors were buying shares of chipmakers. For the copper market, this didn’t matter much. Microprocessors and printed circuit boards themselves consume a negligibly small amount of metal, compared to a scale of millions of tons. But now the virtual hype has turned into a giant physical construction site.
Modern server racks for AI consume a massive 100 to 120 kilowatts of energy, and ordinary cables simply cannot handle such a load. The industry is urgently shifting to massive copper busbars. These are thick, solid strips of pure copper for power distribution within racks.
Moreover, with such heat dissipation, traditional fans can no longer cope. Data centers are being forced to switch to direct liquid cooling systems, which means kilometers of copper tubing, copper cold plates on processors, and giant heat exchangers. In these systems, copper is necessary due to its phenomenal thermal conductivity.
Yes, in absolute terms, data centers do not consume millions of tons like the auto industry. But in the commodity market, the price balance is determined by marginal demand. In an environment where the copper market is already stretched, the sudden emergence of an industry that urgently needs additional tens of thousands —and even hundreds of thousands — of tons of copper becomes that very drop. The drop that overflows the cup.
Production Crisis: The Age of ‘Compensators’ Is Over
So, copper demand is guaranteed to go up due to mass electrification and millions of new electric motors. But why won’t the mining industry be able to respond to this challenge the same way that it has over the last 10 years?
The answer lies in the exhaustion of the three main “compensators” that have so far masked the looming deficit.
Over the past two decades, the mining industry has made a colossal leap in labor productivity. The introduction of giant 400-ton autonomous haul trucks, automated drilling rigs, and control systems has allowed companies to sharply reduce production costs.
This technological boom made it profitable to extract copper from extremely low-grade ore. If 50 years ago, a copper grade of 1% to 2% was considered the norm, today industry giants are forced to process ore with a grade of only 0.4% to 0.5%.
But this technical progress is not infinite. The effect of automation will weaken because raising efficiency, having a high base, will become more and more difficult. Modern dump trucks are already highly efficient. But as the quality of the remaining ore in the ground continues to decline, mining the same ton of copper will now require processing more and more waste rock. That means higher costs for energy, water, and logistics — costs that can no longer be offset by smart electronics.
The Secondary Processing Wall and the Scrap Illusion
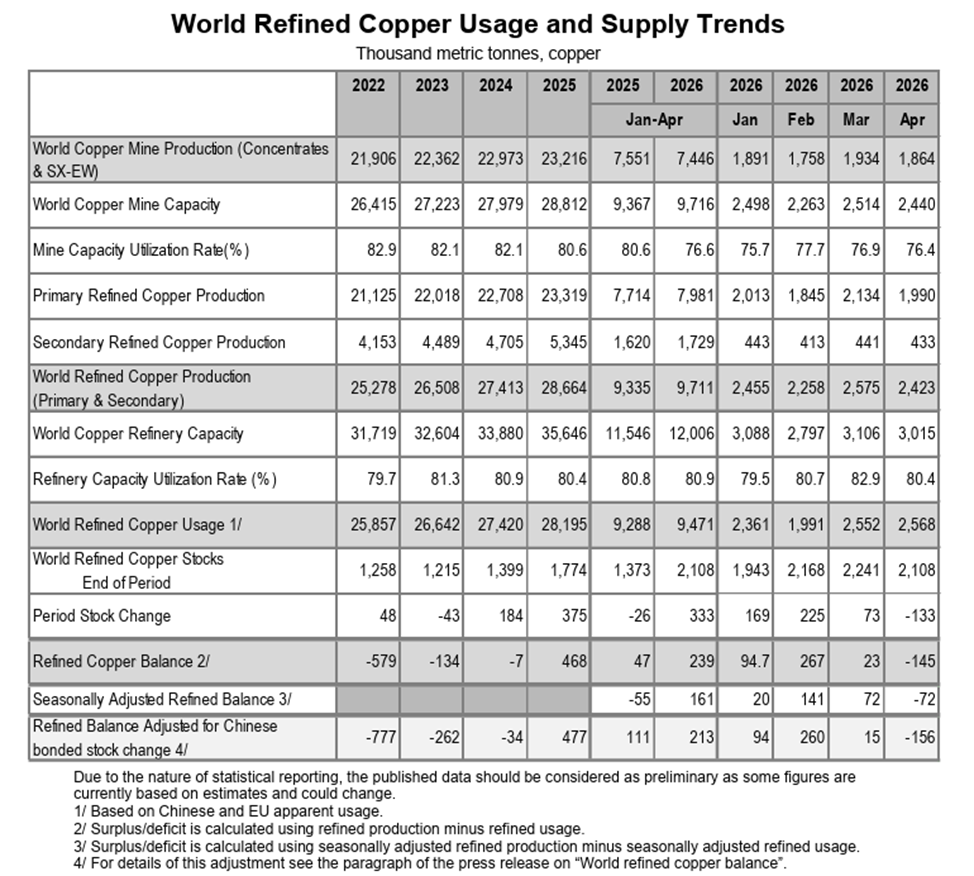
“Bears” often argue their position by claiming that the deficit will be covered by processing secondary raw materials. Indeed, in recent years, as copper prices moderately rose, the world began to collect and recycle scrap much more meticulously. Dry statistics, at first glance, give them reason for optimism. From 2024 to 2025, global production of secondary refined copper made an anomalous jump from 4.705 million tons to 5.345 million tons.
But a fundamental mistake lies here. This is a banal misunderstanding of the difference between primary and secondary raw materials.
Primary extraction of ore from the ground is a real, systemic influx of new metal into the economy, while secondary scrap is merely an exhaustible reservoir from past years. Rising prices forced the market to aggressively “vacuum up” scrap, but this process has a strict economic limit. Secondary raw material collection has its own cost curve. You can quickly and cheaply pump easily accessible reserves out of the market, but as soon as this superficial reservoir empties, the cost of finding, dismantling, and transporting each subsequent ton of old copper skyrockets.
If you want to see what this trap looks like in real time, just look at statistics from the International Copper Study Group for early 2026. Fundamental global mine production for January to April 2026 dropped to 7.446 million tons compared to 7.551 million tons for the same period in 2025. This means that physically less metal was extracted from the ground.
Chart courtesy of International Copper Study Group.
So, where did the temporary surplus at the beginning of the year come from? Smelters simply “threw into the furnace” the accumulated scrap reserves. Secondary production over the same period grew from 1.62 million tons to 1.729 million tons.
But this surge in secondary processing cannot be extrapolated into the future. You cannot systematically load capacity with scrap because it depletes quickly. Already in April, the overall refined copper balance plunged into a deficit of -145,000 tons.
A Geological and Time Dead End
New large and easily accessible copper deposits on the planet simply aren’t being discovered. All the “easy” copper has already been mined.
To launch a new mega-mine from scratch in the current environment, it takes 10 to 15 years — from initial geological exploration and obtaining environmental permits to shipping the first commercial ton. For many years, the capital expenditures of mining companies were constrained due to low commodity prices.
Because of this underinvestment in the past, the physical supply of copper today is locked in time. The industry will simply not have time to ramp up capacity by the time demand makes its next leap.
Copper Is the Main Metal of the Future
Without copper, the entire “green” and technological revolution will simply halt on paper. Copper is not just an industrial raw material. It is the physical foundation, the blood, and the muscles of the future.
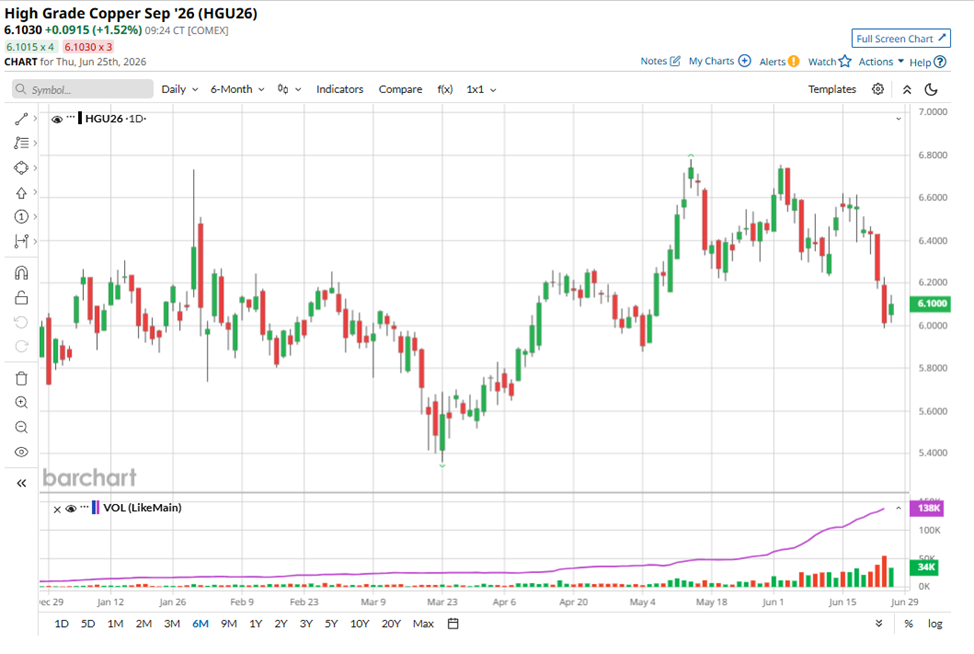
What we have seen on the charts recently — breaking local highs and the start of an uptrend — is not temporary speculative hype. It is the very beginning of a tectonic shift. The broader market is only just beginning to realize the scale of the impending problem.
In the next 10 years, the copper market will inevitably enter a phase of structural deficit. Since supply is constrained by physical, geological, and technological boundaries, and secondary reserves are already being fully utilized, the only way to balance the market in the future is “demand destruction.” And the only mechanism for demand destruction in a market economy is a price increase.
Copper prices will have to reach fundamentally new historical levels — levels so high that some consumers will simply refuse to use copper where it is still physically possible. This very action will be able to balance supply and demand.
For the long-term investor, this forms one of the most reliable and asymmetric opportunities in the market. Investing in copper, and in the shares of fundamentally strong mining companies with real reserves in the ground, is not a bet on market
arvell (MRVL). The chip producers, the ones that are reporting double to triple-digit growth quarter over quarter. The ones that dominate headlines with big green charts and arrows every time.
But it takes far more than silicon to run artificial intelligence (AI).
Every AI model, every chatbot response, and every image generation request ultimately runs inside a data center. And those data centers consume staggering amounts of electricity.
In fact, as AI workloads continue to expand, power increasingly becomes the limiting factor in day-to-day operations. You can have the newest and most advanced GPU clusters around, all cooled by the most sophisticated thermal tech in the industry, connected by the best networking platforms in the world.
But none of that matters if you don’t have enough electricity to turn on any of the servers.
That’s why some investors are looking beyond semiconductors and toward a less obvious beneficiary of the AI boom: the companies that generate and deliver the power that keeps these data centers online, and the ones that are building the parts that make it all happen.
Why AI is driving a $2.2 trillion power market
The power generation industry is valued at around $1.3 trillion today, according to industry estimates, and is expected to grow to $2.2 trillion by 2034.
Historically, the biggest driver of the power generation industry was the increasing urbanization of developing countries. But the sharp rise in data center demand, with its enormous requirements for computing power, is what’s further driving that expected growth.
As a result, companies across the power value chain stand to benefit from what could become a decade-long investment cycle, not only from AI but also from secular tailwinds.
Where are the sector bottlenecks?
Before anything else, we need to cover where the opportunities are in the power sector, at least in the context of AI demand. And to do that, we need to break down the value chain and see where the bottlenecks lie.
Power producers and the 20-year PPAs feeding AI data centers
First, we have the raw materials and energy producers. Think fuels: natural gas (NGQ26), solar, wind, and uranium, as well as the companies that convert them into energy. This is the business at the very base of the value chain, where everything starts.
Historically, many power producers sold electricity into wholesale markets, where prices fluctuate based on supply and demand. But the rise of AI is changing that dynamic.
Hyperscalers such as Microsoft (MSFT), Amazon (AMZN), Google (GOOGL), and Meta (META) increasingly need guaranteed, 24/7 access to massive amounts of power. By that, I mean they can’t just connect to a light socket and call it a day. They need to go straight to the power producers to get what they need.
Power producers respond, usually in the form of power purchase agreements (PPAs), in which the data center operator commits to buying electricity from a producer for extended periods, often lasting 20 or more years. These agreements provide energy companies with stable, predictable cash flows while giving data center operators confidence that sufficient power will be available as they expand capacity.
So, when you see a power company bagging one of these PPAs from a hyperscaler, you know you’re seeing trust and validation in one deal. Now, if you see multiple deals, well, that just solidifies the bull case.
The biggest example of this kind of relationship is between Microsoft and Constellation Energy.
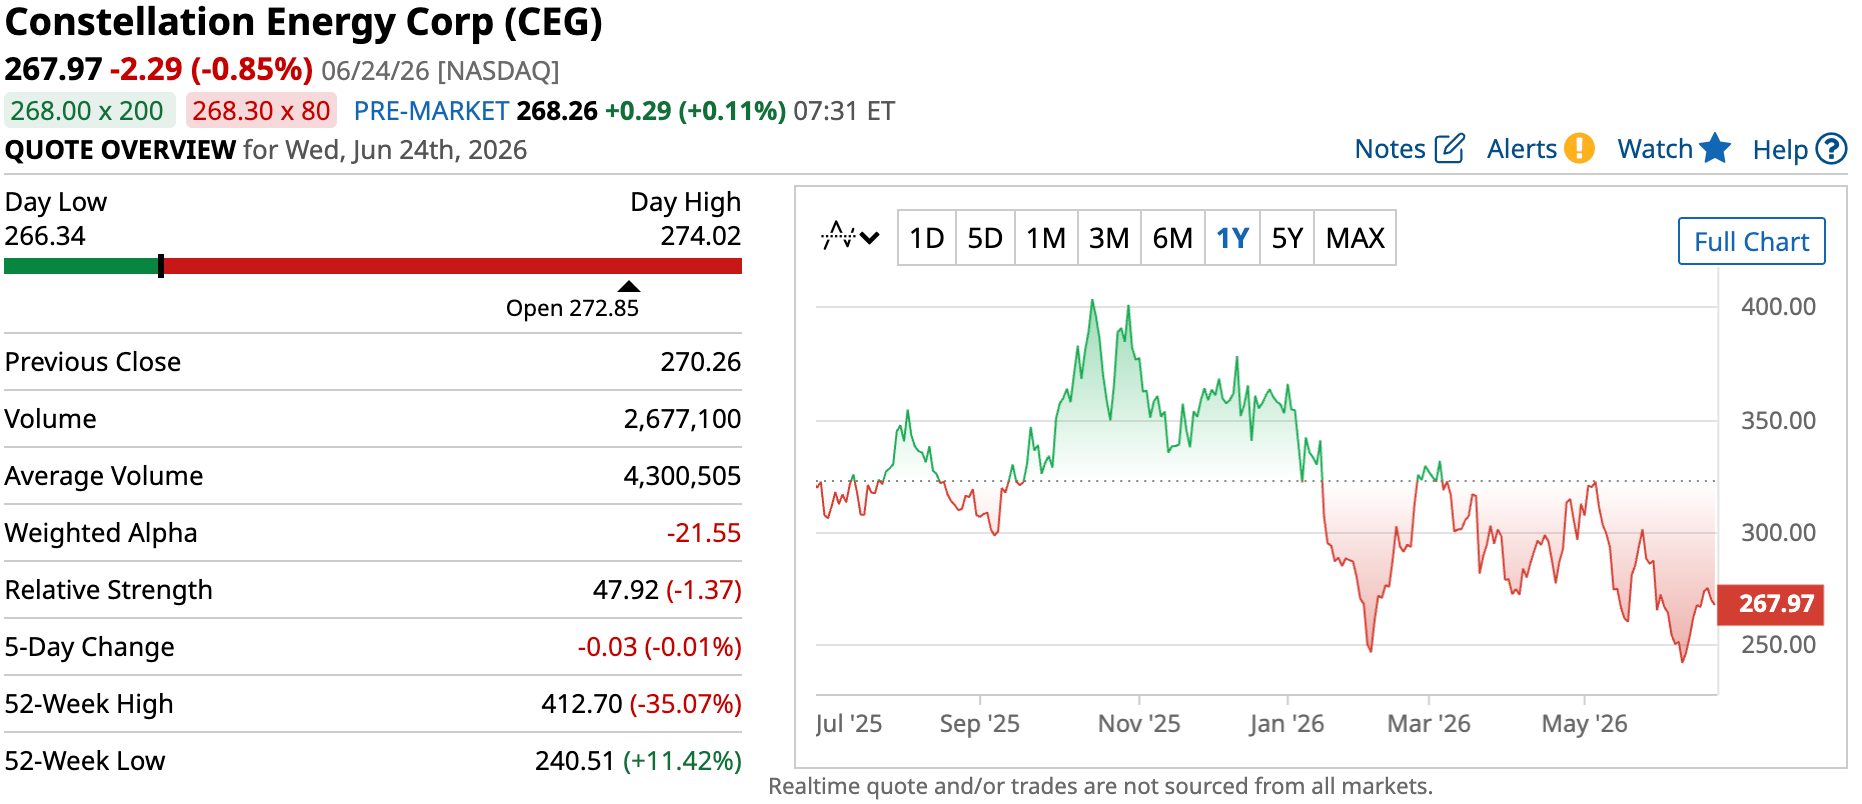
Constellation Energy (CEG): The go-to stock for AI nuclear power
CEG has bagged mega Mag 7 deals.
Just a couple of years ago, Microsoft inked a deal with CEG to create the Crane Clean Energy Center. This is a project that was widely reported to restart Unit 1 of the (former) Three Mile Island nuclear plant. The deal is for 20 years, with the PPA being so big that Constellation is investing ~$1.6 billion to bring the reactor (back) online for Microsoft.
Once Unit 1 is online, it could make as much as 7 million megawatt-hours of power per year, assuming everything runs as planned.
If that’s not all, last year, Meta inked a deal with Constellation to launch the Clinton Clean Energy Center. Like with Microsoft, the deal is for a 20-year PPA, and CEG will add an additional 30 megawatts of output by way of nuclear uprates. This particular PPA covers 1.21 gigawatts of clean nuclear power, which could translate to ~9 million megawatt-hours of annual production.
The Microsoft and Meta deals are standout examples of how CEG can grow for decades. Granted, the exact financial details of the PPAs haven’t been made public, but you can be almost sure they are going to be lucrative. In fact, some analysts estimate Microsoft could be paying between $110-115 per megawatt hour. If that were the case, it would imply as much as $800+ million in annual revenue – on the Microsoft deal alone.
Of course, CEG is not alone in bagging power deals with hyperscalers.
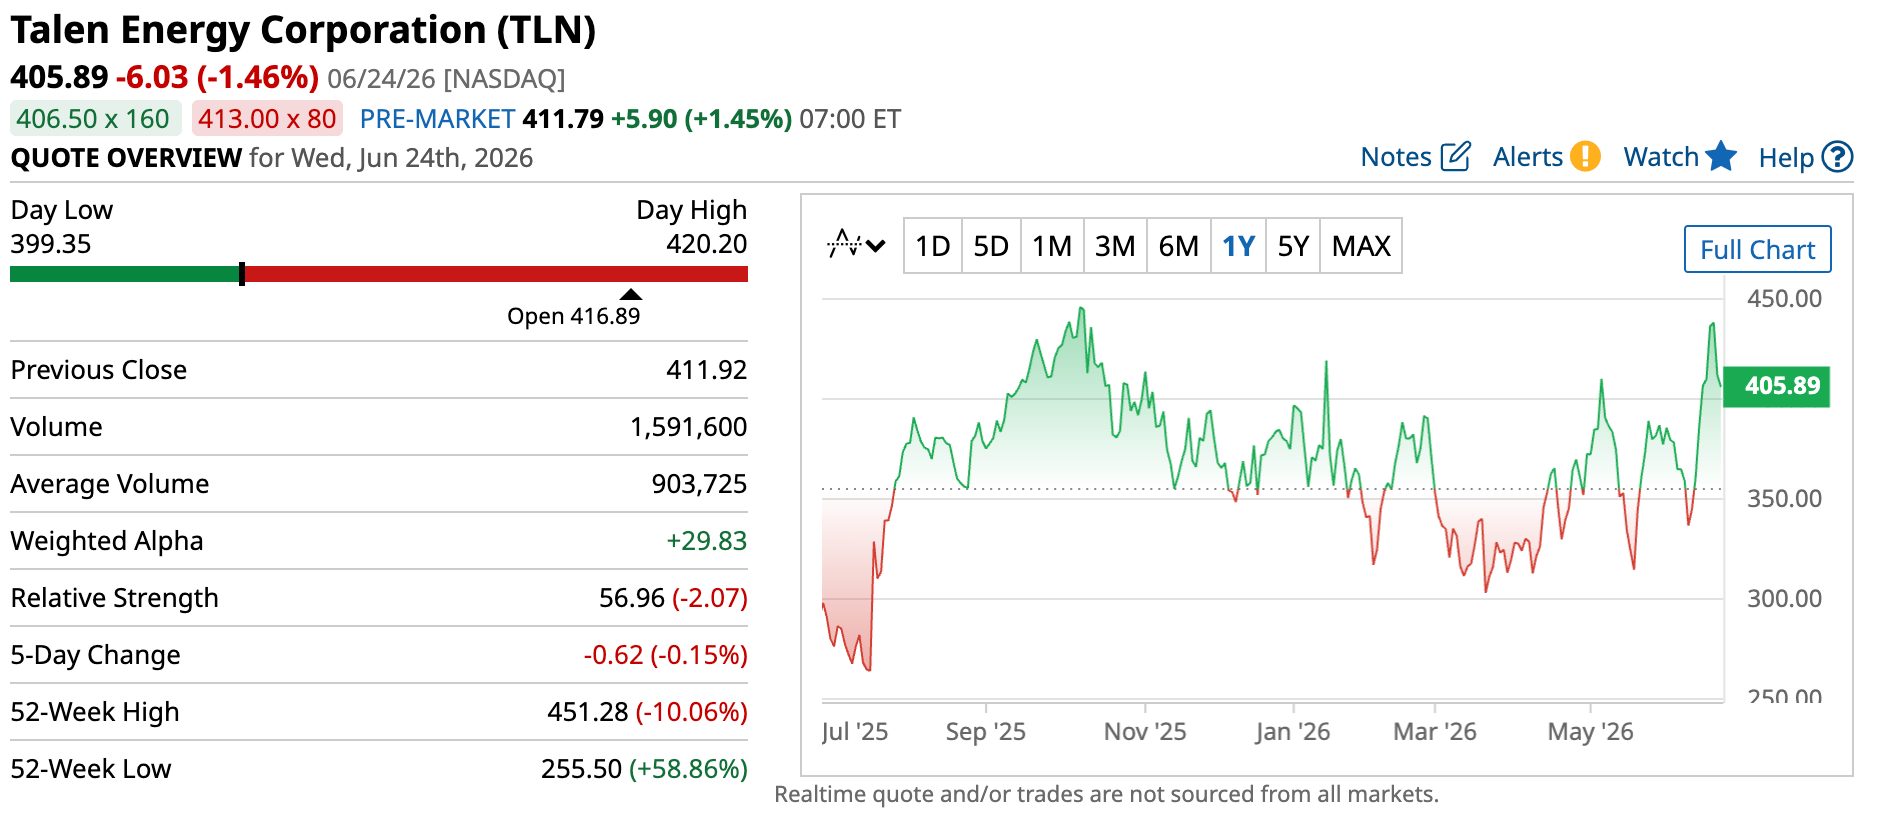
Talen Energy (TLN): The Amazon nuclear deal next door
Talen linked up with Amazon on a power pact.
Talen Energy, a relatively new player in the space, has partnered with Amazon to produce up to 1.9 gigawatts of nuclear capacity from its Susquehanna plant. But Talen’s plant is directly adjacent to Amazon’s data center.
That means the deal can significantly reduce the need to move electricity across the broader transmission and distribution network. Instead of sending power across hundreds of miles of grid infrastructure, electricity can be delivered almost directly from the source to the data center.
The arrangement not only minimizes transmission losses but also helps hyperscalers secure reliable access to power in a market where grid capacity is increasingly becoming the bottleneck. No congestion pricing, no interconnection delays, and no third-party dependencies to worry about. That’s practically a match made in heaven for data centers.
But, true adjacency – as in building plants right beside data centers, instead of somewhere else that’s relatively nearby – faces growing geographical and regulatory constraints. Even now, just finding “good enough” places to build the next data center is becoming a challenge. Tack on a nuclear plant right beside it? The challenges multiply.
That’s why Talen Energy’s approach, while wildly attractive, may not be the gold standard. And that’s why we need to look into other parts of the value chain.
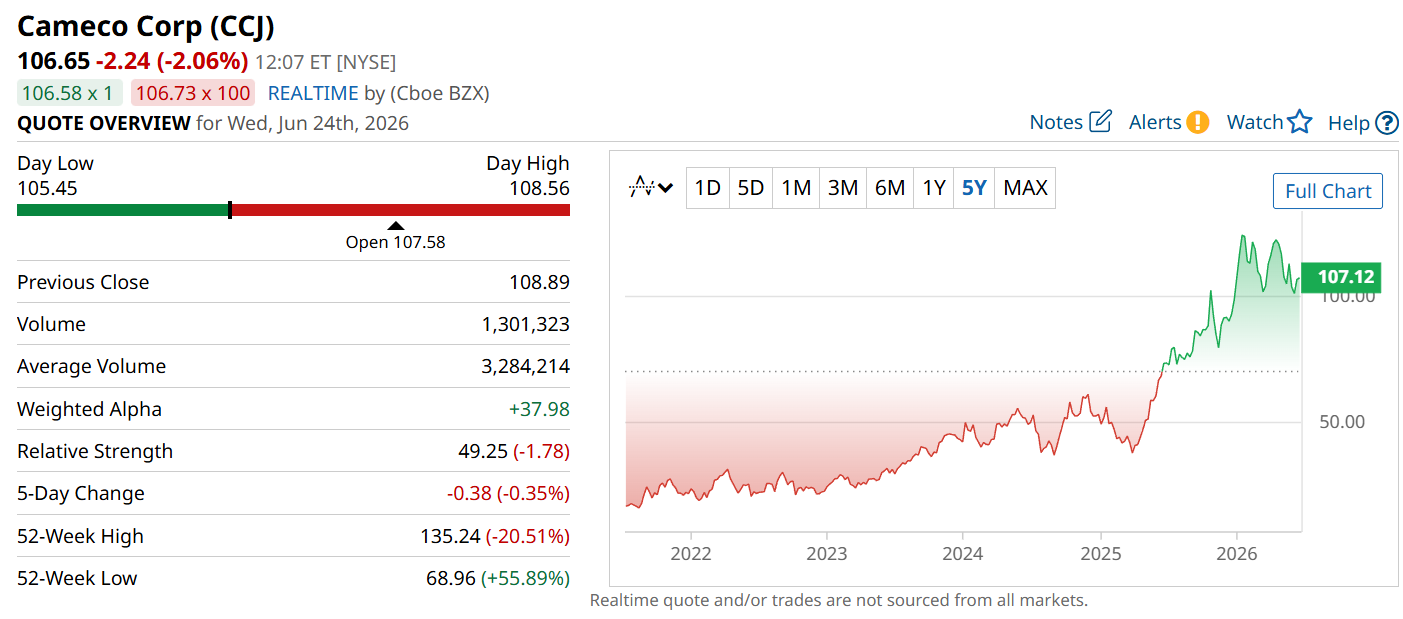
Cameco Corp (CCJ): The uranium picks-and-shovels play for AI
Now, as for the raw material providers, the relationship is one step removed from hyperscaler deals, but that doesn’t mean they don’t benefit from them. In fact, let me call your attention to another interesting player in the nuclear power space.
CCJ sits further down the value chain.
Cameco Corp operates a little further down the value chain. It doesn’t generate electricity, but it does produce uranium oxide concentrate, otherwise known as yellowcake. This is the preferred fuel by many nuclear reactor operators due to its high energy density, reliability, and ability to provide consistent baseload power.
Cameco has major mining operations in Canada and Kazakhstan, and also participates in nuclear fuel services and reactor technology. And while the company’s involvement in AI power growth isn’t as direct as CEG’s, as hyperscalers increasingly lean into nuclear, Cameco should grow. As demand for nuclear energy continues to rise, utilities like Constellation benefit from selling more electricity, while uranium suppliers like Cameco benefit from increased fuel demand. It’s a symbiotic relationship.
Of course, the relationship isn’t perfect. Cameco’s performance is still heavily influenced by uranium prices, supply dynamics, and long-term contracting activity. But as hyperscalers continue signing nuclear deals and utilities respond by extending the lives of existing reactors or building new capacity, the long-term outlook for uranium demand becomes increasingly attractive.
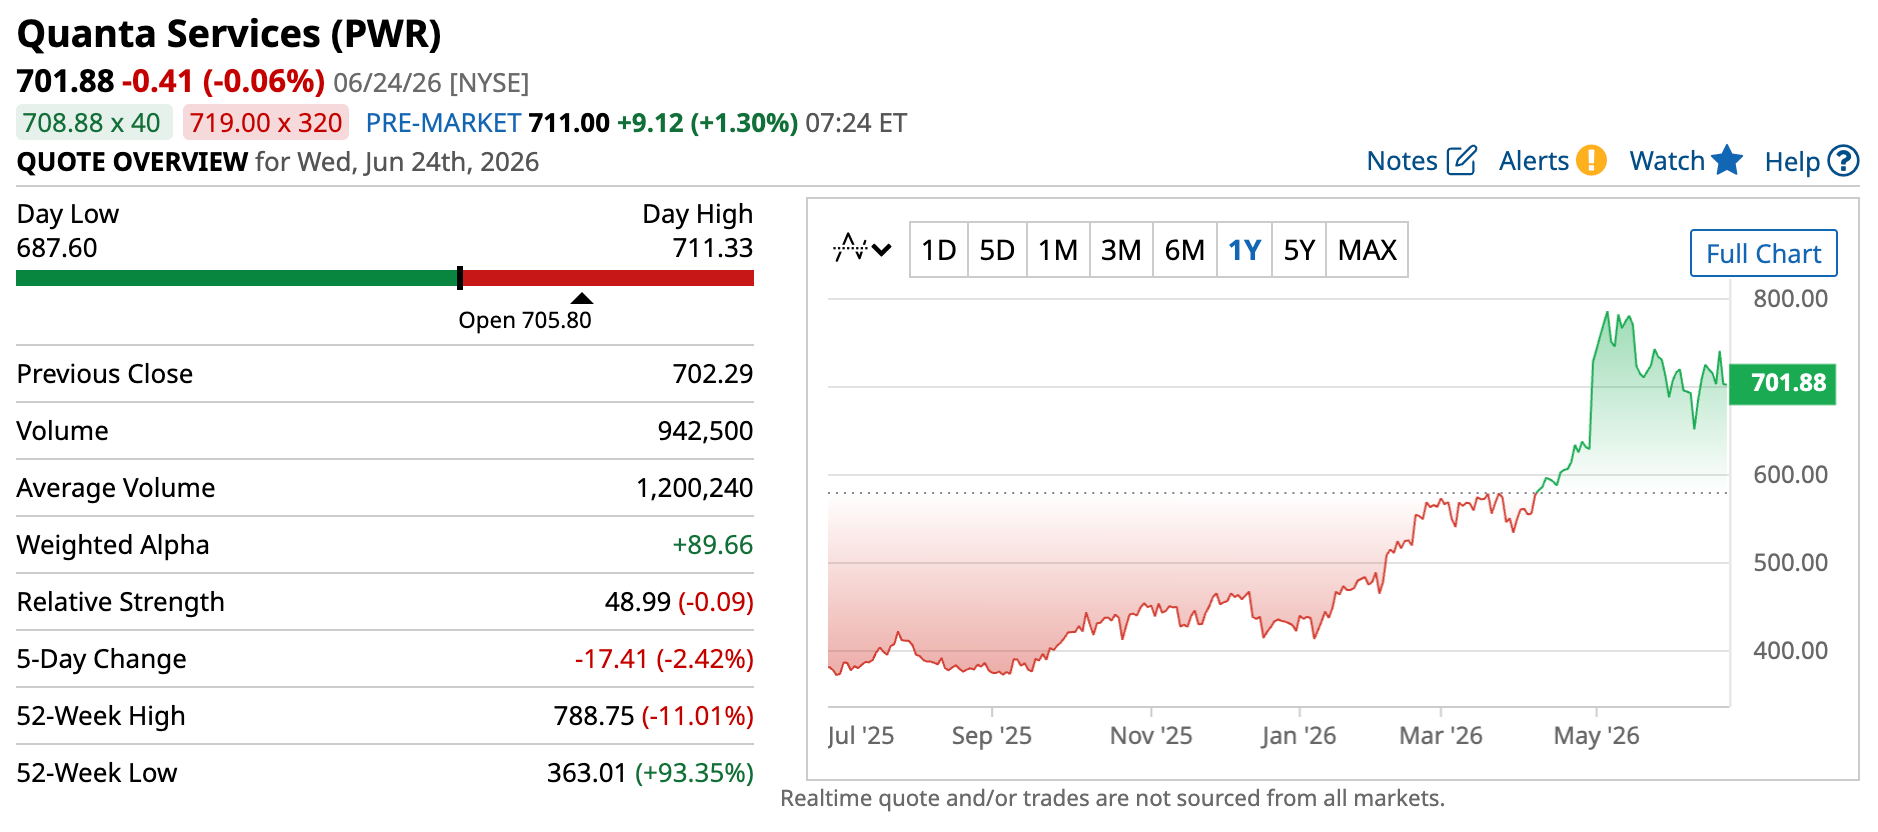
Quanta Services (PWR): The grid bottleneck behind AI power
Another bottleneck that’s becoming increasingly important for AI power demand is distribution. Transmission lines, substations, and grid infrastructure are all critical to supplying power-hungry data centers. And as one might expect, companies sitting in the crossroads are likely to benefit from the growing demand.
Certain companies that operate with true adjacency, like Talen Energy, remove this requirement entirely. But that’s somewhat unique in the space, so many power providers and hyperscalers still need to deal with distributors.
One of the clearest examples of this is Quanta Services.
Quanta provides the “blood vessels” of the industry.
Quanta operates in the physical layer that makes large-scale AI deployment possible in the first place. That includes transmission buildouts, high-voltage substations, and the electrical infrastructure required to connect new data center campuses to increasingly constrained regional grids. It is one of the largest engineering and construction services contractors in North America’s power transmission sector.
Think of it this way: energy producers operate the heart, while companies like Quanta make and maintain the blood vessels.
Every new data center, manufacturing facility, or large industrial project still needs to be physically connected to the grid, and they usually opt for the biggest and most capable players. That leaves Quanta well-positioned to capture that demand.
In many cases, the constraint isn’t the generation capacity itself, but the ability to interconnect new load to an already congested transmission system. And that’s where the opportunity is: to take part in data center demand.
Quanta’s management has already highlighted that AI-driven power demand is now a major growth driver for the company. But because of its broader distribution business, demand across other large-load industries also serves as a catalyst.
Now, to be clear, power distribution won’t enter into PPAs. But there is a clear line between increased PPAs from the producers and increased demand for distribution. In fact, if you’ll notice, all four companies I’ve covered so far practically have the same graph over the last five years. Sure, there are small differences in magnitude, but the broader trend is unmistakable: these companies are beneficiaries of the same secular tailwind, practically all at the same time. And it makes sense when you think about it. More AI workloads require more data centers.
More data centers require more electricity, which leads to more power generation, more fuel consumption, and massive investments in transmission and grid infrastructure.
Bottom line: As long as hyperscalers continue their aggressive spending on AI infrastructure, every link in the power production chain stands to benefit.
Electrical equipment stocks: Eaton, Schneider, and GE Vernova
Now, if you thought we were on the ground level, we’re not – at least, not yet. One level deeper are those companies that support both power generation and grid infrastructure. These are the players that actively build, connect, and scale the physical backbone that enables both.
In the broader structure of the AI power stack, this layer sits between high-level grid construction and end-use electricity consumption. It serves as the industrial foundation that determines whether capacity can actually be deployed at speed. In practice, this is where the constraint becomes physical rather than theoretical. Because even if generation capacity is available and even if demand is fully contracted through long-term agreements, none of it translates into usable supply unless the underlying infrastructure can be built fast enough.
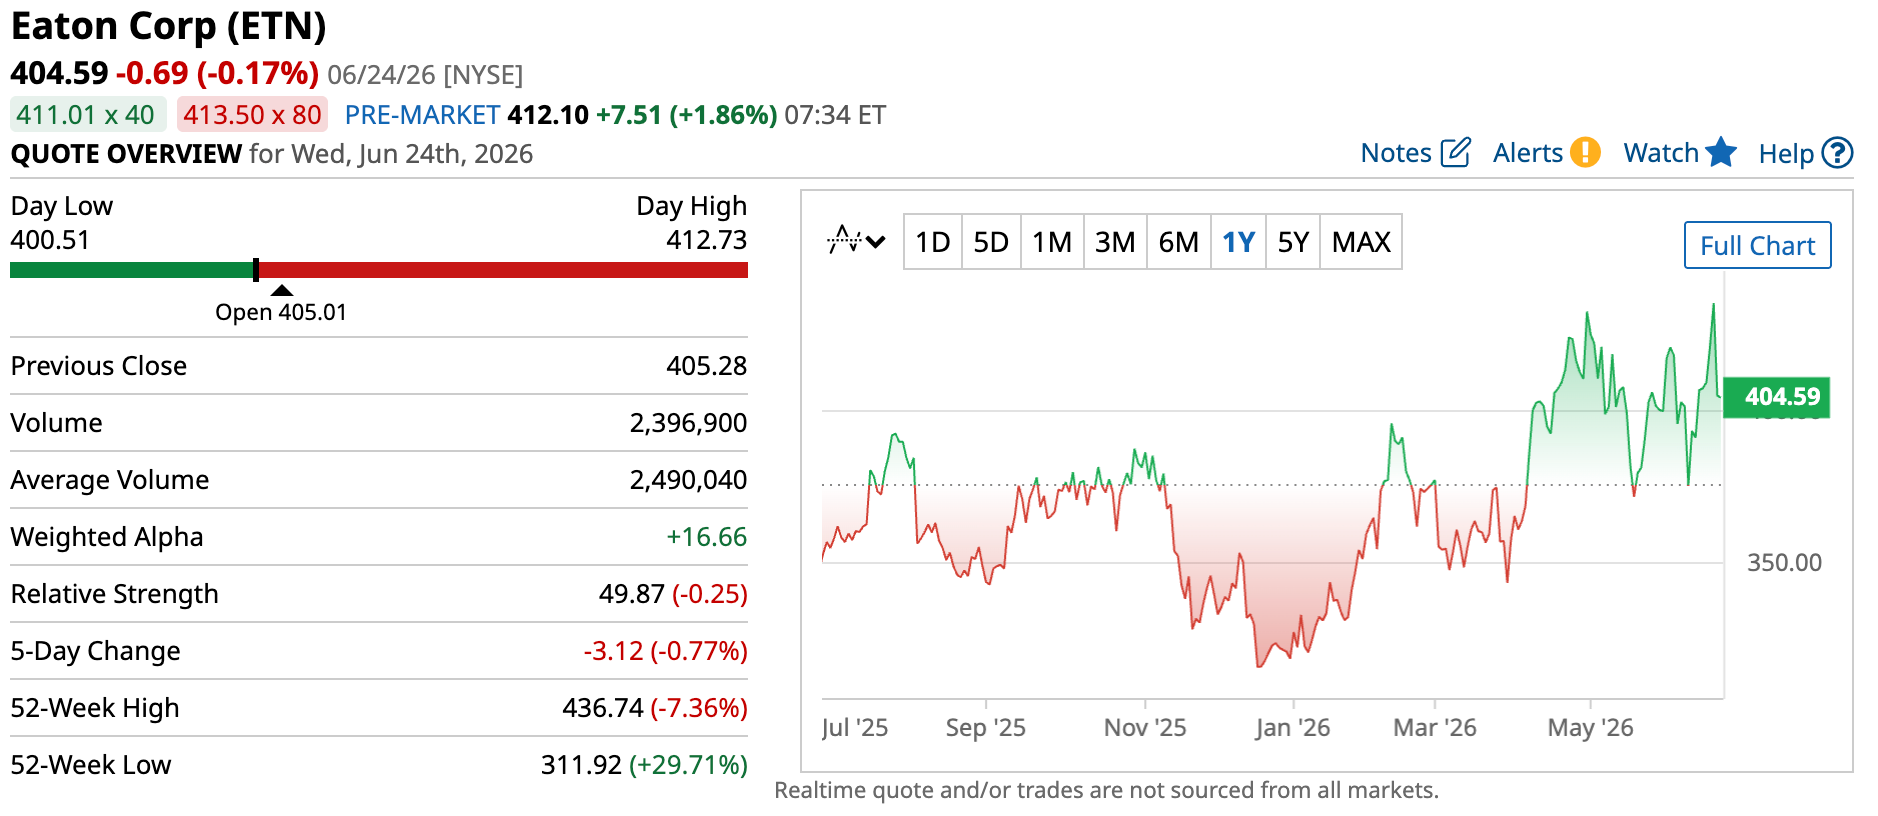
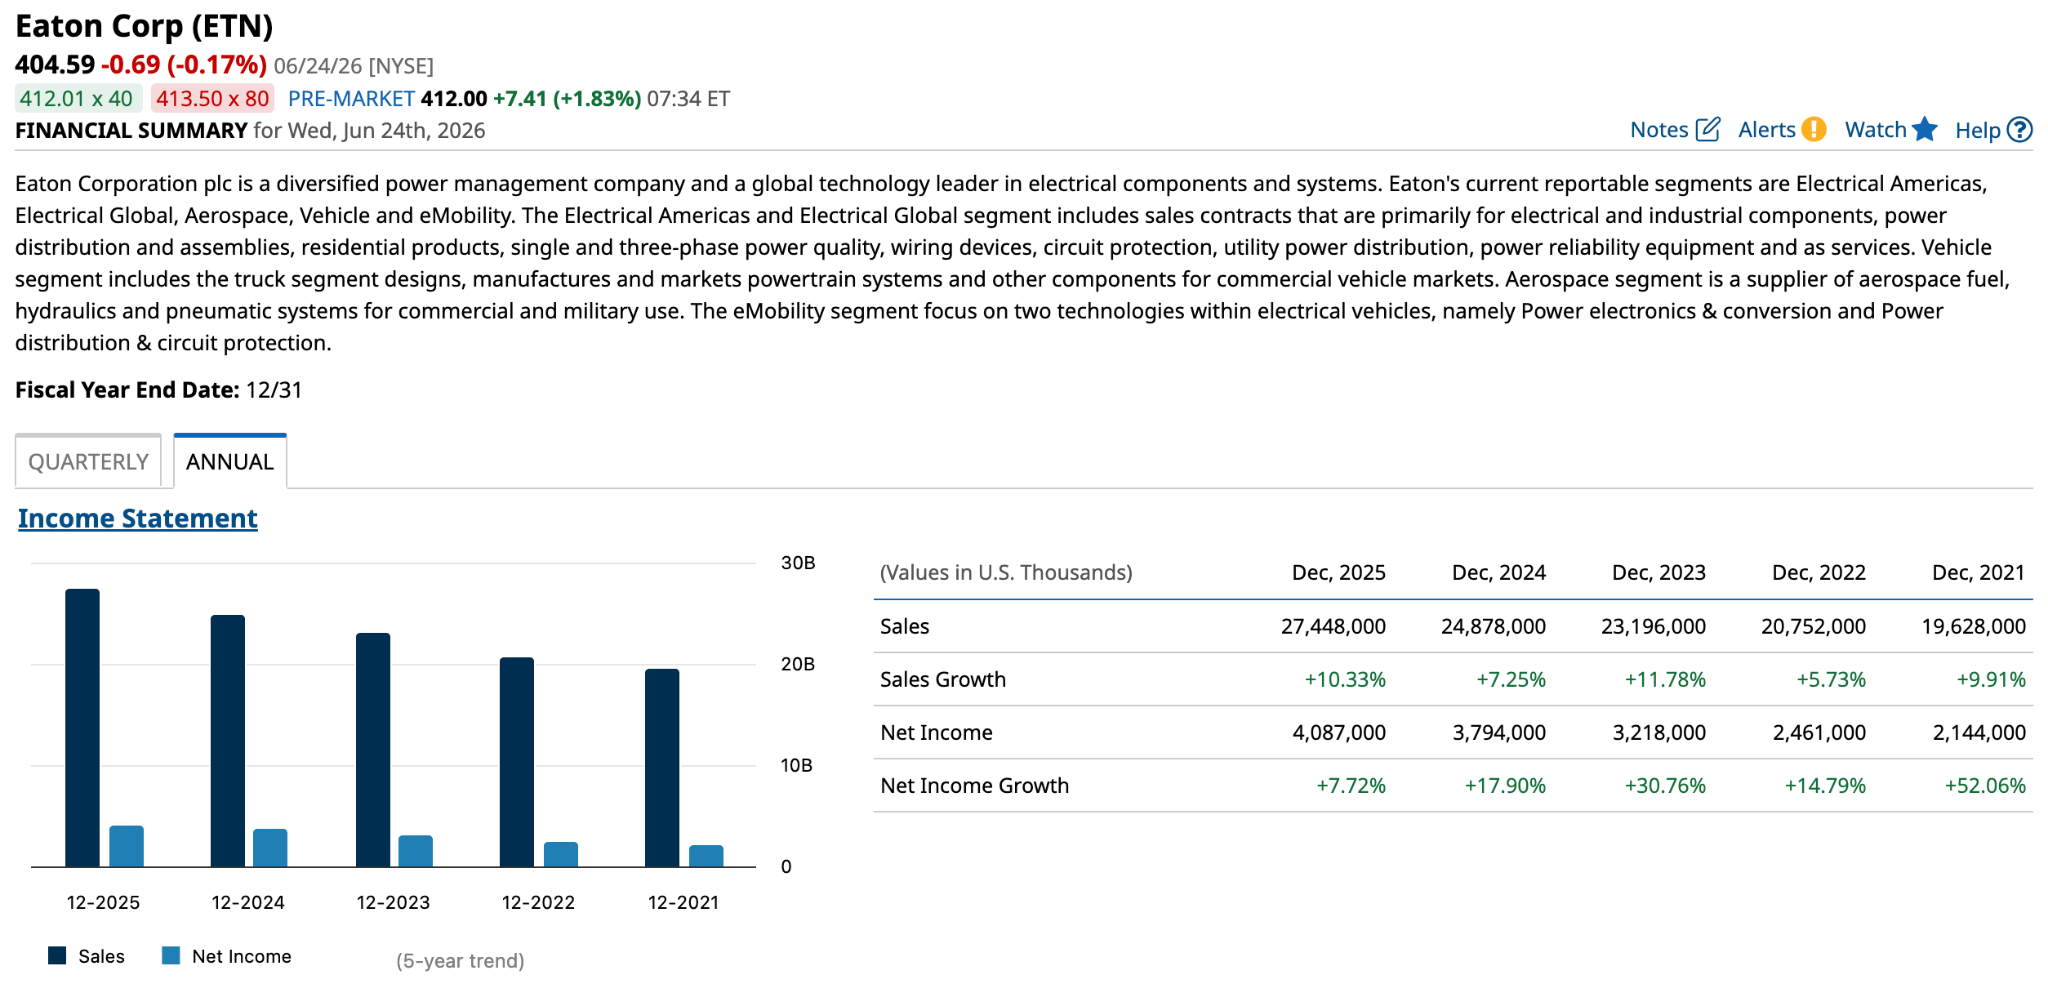
Now we can look to the companies that supply those parts of power production and infrastructure. One good example is Eaton Corp (ETN).
ETN is a clutch equipment pick.
The company manufactures electrical hardware such as switchgear, breakers, transformers, uninterruptible power supply systems, and more. These pieces of equipment are critical components to running not just data centers but also your typical modern industrial enterprise as well.
What makes Eaton particularly relevant today is that these components are not optional upgrades. Electrical systems need these parts. So, we can say increased demand directly translates into increased sales, as a quick snapshot of Eaton’s annual financials will attest.
In effect, Eaton sits in the electrical component layer of the stack, supplying the core hardware that allows both industrial facilities and hyperscale data centers to safely distribute and regulate power at scale.
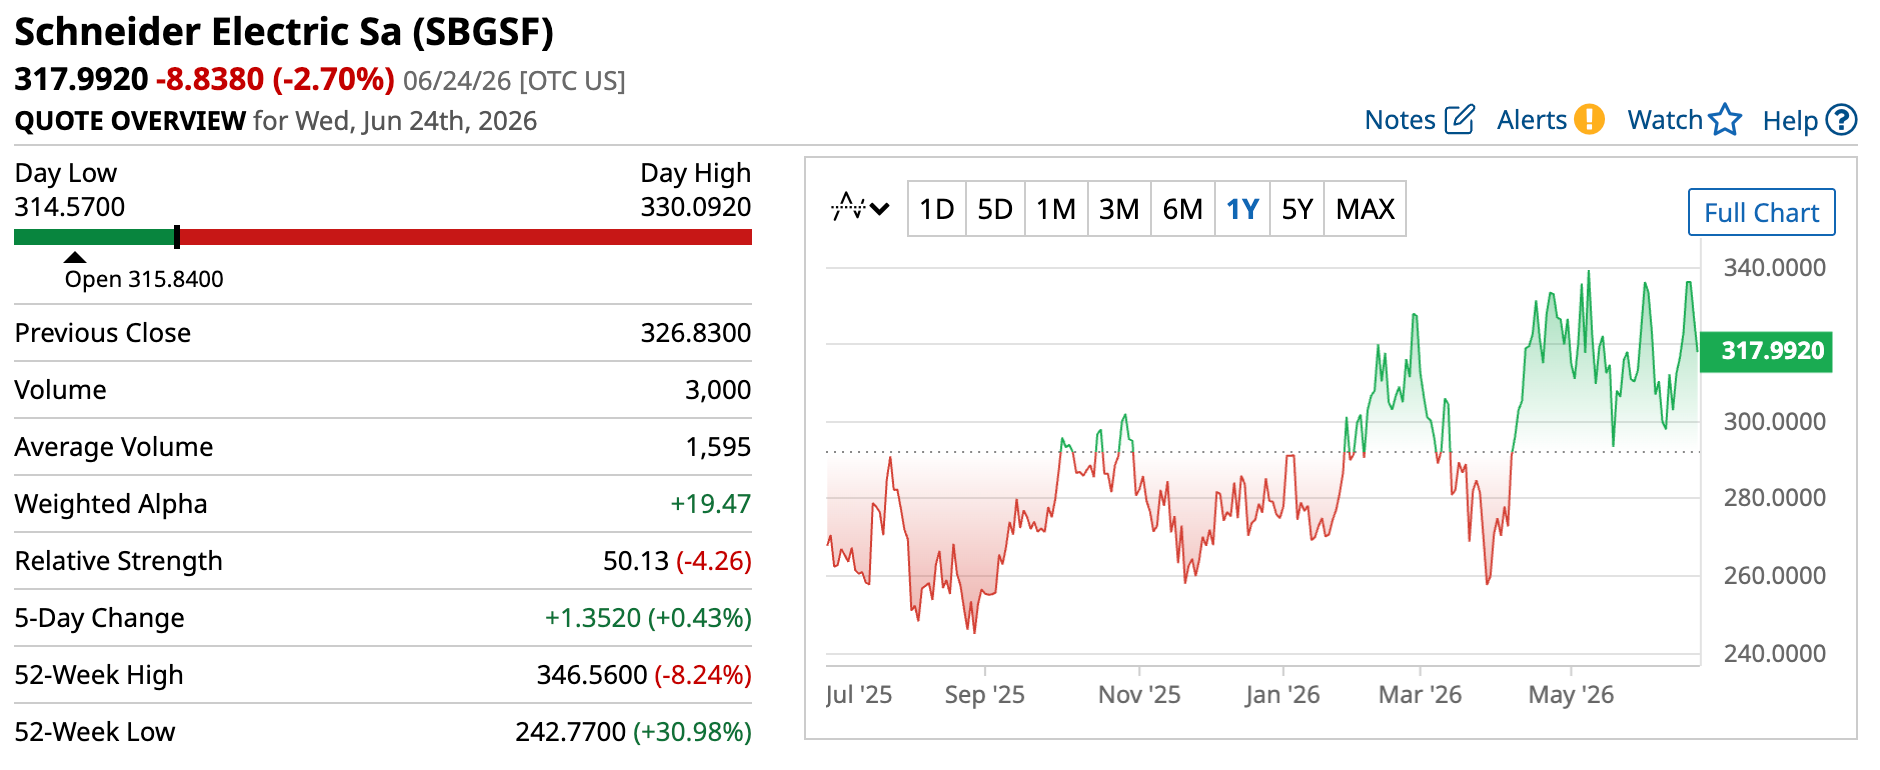
Another, albeit different, example here is Schneider Electric (SBGSF).
Schneider trades OTC.
Unlike component manufacturers, Schneider designs and deploys integrated energy management systems that get deployed in data centers, industrial facilities, and utility networks. The entire value chain.
In practical terms, more and more, Schneider is responsible for how entire facilities manage power flow end to end. Power efficiency matters more in data centers that consume enough electricity to power small cities, where every kilowatt counts and even small, persistent energy losses can translate into massive financial costs.
This positions Schneider closer to the systems and control layer of the grid, where software, monitoring, and integrated electrical architecture determine how efficiently large-scale infrastructure operates once built.
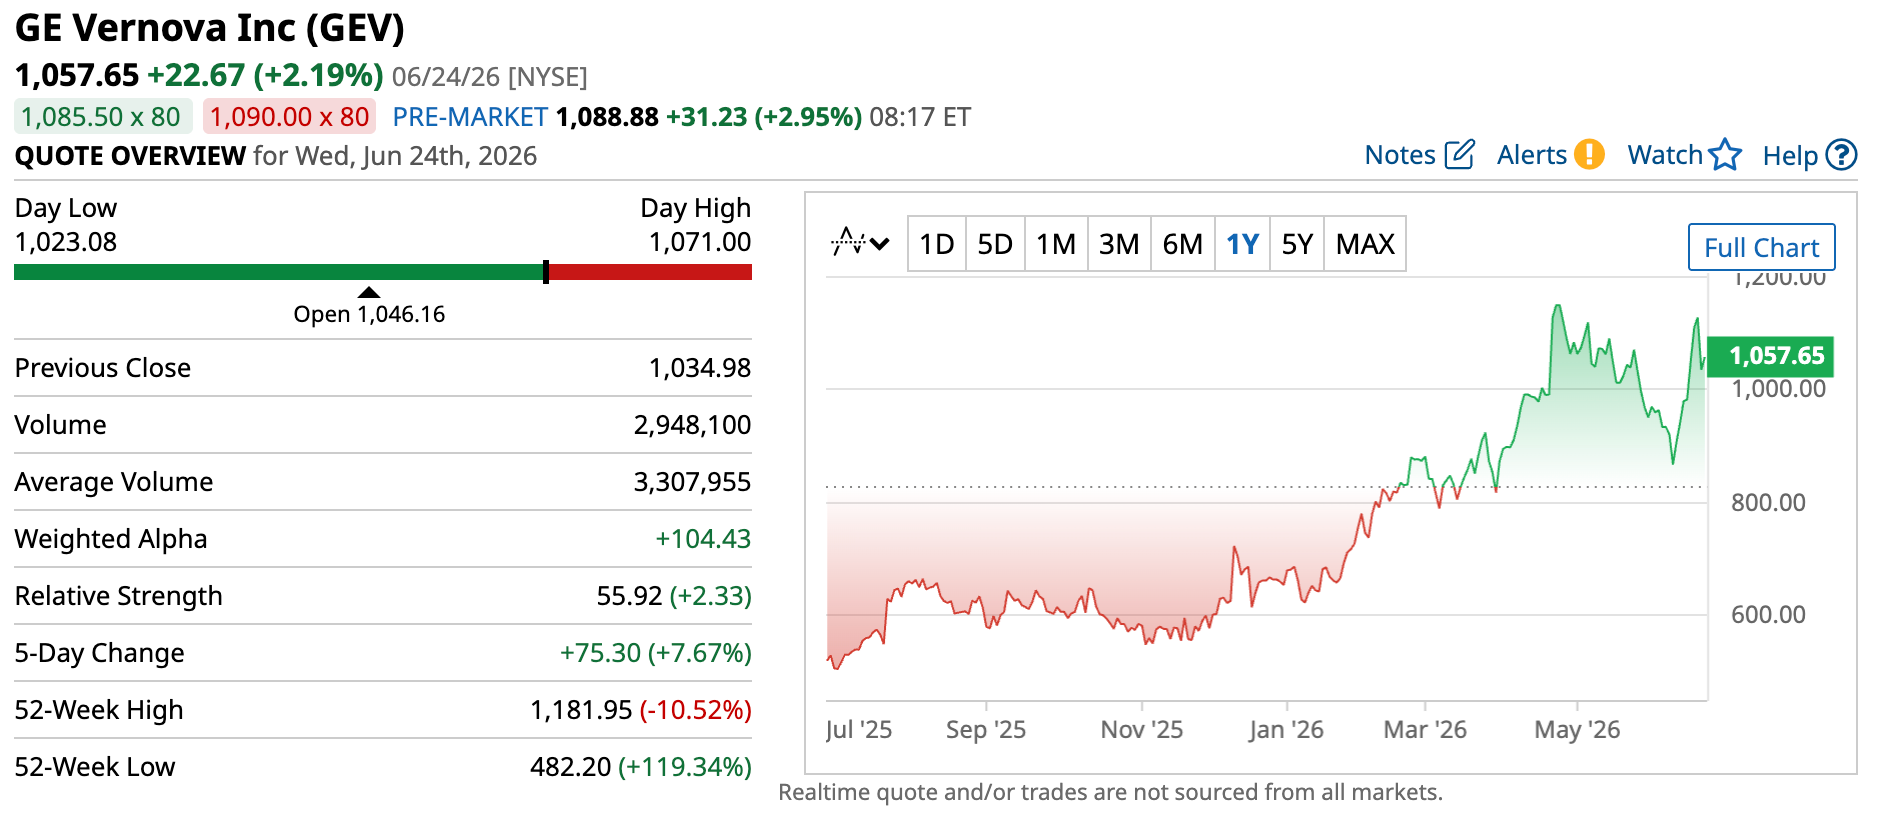
Finally, there’s GE Vernova (GEV), representing a different but equally critical layer: power-generation equipment itself.
GEV is the blue-chip spinoff champ.
GE Vernova makes gas turbines, renewable energy systems, and grid-scale electrification infrastructure. While companies like Constellation and Talen generate electricity, GE Vernova often supplies the equipment that makes it possible.
Increasing AI demand results in more power demand, and if the producers don’t have the existing facilities to cover that demand – well, then, they’re going to need to expand. That means GE Vernova directly benefits from increased AI power requirements. Here are a few examples.
Last year, GE Vernova partnered with Crusoe, a vertically integrated AI infrastructure provider, to deliver 29 new gas turbines to its data centers. This combined deployment is expected to support up to 1 gigawatt of electricity production. They also partnered with Amazon Web Services, Inc. to offer a broad range of energy solutions covering electrification systems, renewables, and power generation services all to support global data center expansion.
And I wouldn’t want to suggest that the client base is limited to hyperscalers. GE Vernova is one of the most dominant and important energy infrastructure players in the world, so naturally, the deals go beyond AI. Companies like Duke Energy (DUK) and Chevron (CVX) all have existing deals with GE Vernova. The company is also a key player in national energy expansion initiatives, such as the one in Saudi Arabia, which is estimated to reach up to $14.2 billion over its lifetime.
The risks of investing in AI power stocks
Overall, the AI data center build-out is extremely beneficial to all links of the energy value chain. But there are risks that investors need to grapple with. Some of them aren’t even theoretical; they’re here, and they’re looming. The only thing we don’t know is when exactly they will make landfall.
The first risk is the cycle
The first and arguably the most critical risk is cyclicality. Right now, the world’s largest companies are shelling out billions to each support their own AI initiatives. Microsoft, Amazon, Alphabet, and Meta have already committed to increasing their capex explicitly to expand their data centers and other AI infrastructure. They want better LLMs, features, functionality, and narratives for their shareholder presentations.
The race, as they say, is on. But how long will the run last? Because let’s face it: even though it seems like hyperscalers have bottomless wells of money, they will eventually hit bedrock with increasing and sustained AI expenditure. One of these days, they will have to slow down spending. And once they do, power will be one of the cut-off points.
That means less demand for equipment, power generation, infrastructure, system solutions, and all the rest.
By the way, this isn’t me reading tea leaves for the AI power industry. There’s a historical precedent here. Capital-intensive industries have always been cyclical. Cycles may expand for years or even decades, but a downturn is always inevitable. We saw it with telecom, oil and gas, the first nuclear buildout cycle, and other emerging sectors during their times.
Too hot, too cold, never just right
Investors also need to keep an eye on signs of under- and overbuilding. The power sector is notoriously sensitive to such risks, due to the long lead times for buildouts across, well, every link in the value chain.
Turbines, transformers, and nuclear power plants don’t magically appear whenever a hyperscaler wants them to. They could take years to manufacture – even longer if the infrastructure to build them isn’t in place yet – which leads to a nice little two-sided risk for both the manufacturer and the client.
Too much demand and too little infrastructure? Those are underbuilds. The logical fix for that is to expand.
But what if demand fizzles out?
That same expanded infrastructure that was so critical to meet demand a few years before is now sitting idle, collecting dust.
In short, overbuilds.
Two sides of the same coin.
The last risk is concentration
And finally, one of the biggest risks of AI power is in the name itself.
Artificial intelligence.
One sector. One market. One group of customers pay all the bills.
That’s the reality today behind the AI boom. I know it might sound like I’m scratching my nails against a chalkboard by repeating the same few names, but be that it as it may, Microsoft, Amazon, Google, and Meta are among the biggest and most aggressive spenders right now. Every decision they make trickles down the AI value chain, including power.
So, if even one of those tech giants decides to slow down, delay projects, or build their own power solutions, the effects could ripple across the sector. Suddenly, utilities find themselves needing less incremental generation capacity. Fewer data centers would need to be connected to the grid. Equipment orders could slow. Infrastructure projects could be deferred.
The bottom line for AI power stocks
What this ultimately comes down to is a shift in where the constraints sit in the AI ecosystem. The early phase was defined by compute scarcity, and that’s when semiconductors took center stage. Then memory became the hot commodity, and RAM manufacturers got their moment in the sun.
But as the buildouts scale, the constraints keep moving downstream, into the physical infrastructure that supports all that compute. Power generation. Transmission. The equipment that makes it all run.
So the next shift in the industry’s center of gravity? It’s heading straight to power. And that’s what makes this so compelling: the companies at these bottlenecks aren’t betting on which chatbot wins or whose model tops the leaderboard. They get paid no matter which name comes out on top, because every one of them needs electricity to compete.
But here’s the part that should excite long-term investors most. Even when the AI spending cycle eventually cools – and it will – the world doesn’t suddenly need less power. Electrification, reshoring, grid modernization, and rising global demand were already pushing this sector higher long before the first hyperscaler signed a PPA. AI didn’t create the power supercycle. It simply poured gasoline on the fire (so to speak).
That’s the rare setup: a theme with a massive near-term catalyst and a durable, decades-long tailwind underneath it. The bottleneck is real, the demand is here, and the companies that deliver the electricity, systems, and infrastructure to run the AI era are positioned to benefit for years to come.
Just remember that market positions and moats can shift, so stay on top of your picks. But if the center of gravity really is moving to power, the opportunity in front of investors right now is hard to ignore.
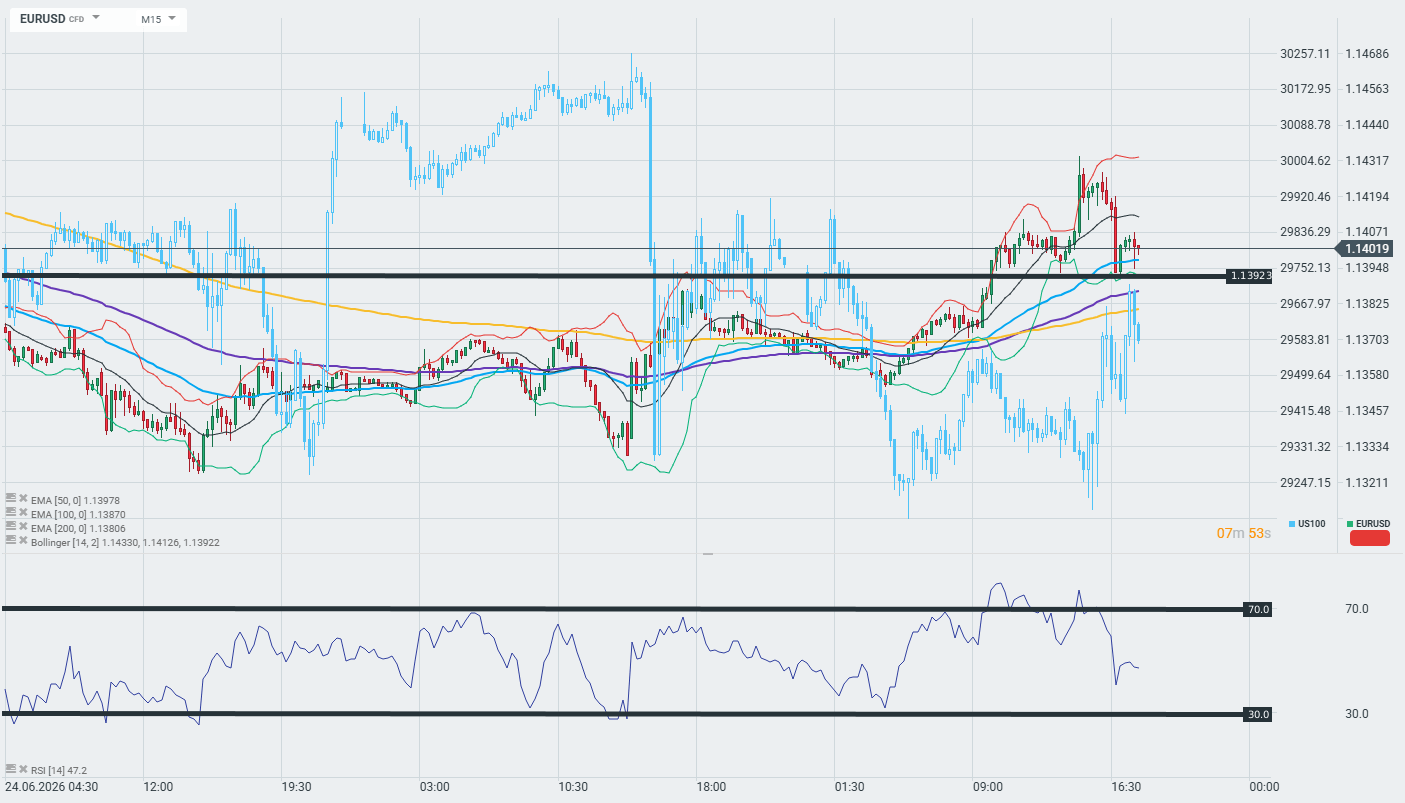
s now losing buying momentum. In the second half of the session, the momentum has clearly shifted to the sellers. The US100, on the other hand, reflects relative strength—the index has gradually lost its downward momentum and is stabilizing in the second half of the day, ignoring some of the negative market signals.
The main topic of the day in the tech world is the potential delay of OpenAI’s IPO — reports in the NYT about the debut being pushed back to next year (in part due to SpaceX’s poor performance following its IPO) have hit the entire semiconductor sector hard. Micron, AMD, and Intel are down about 2% each, while Oracle is down more than 1%. The ripple effect was particularly evident in Asia: SoftBank, a key investor in OpenAI, plummeted by more than 12% , the Nikkei 225 lost 4.15% , and South Korea’s Kospi plunged by 5.81% .
JPMorgan warns outright that the IPO delay “could slow the pace of spending on AI infrastructure.” On the other hand, however, postponing the launch date will keep market expectations alive, which, paradoxically, could have a positive effect on market returns given the narrative being built and the promises of increasingly advanced AI development.
The main risk factor on the geopolitical front, however, is the U.S.-Iran situation. Trump reported on Truth Social that Iran had launched at least four kamikaze drones at ships in the Strait of Hormuz. One struck the deck of a large container ship—the vessel sustained damage but continued its voyage. The other three drones were shot down. Trump called the incident a “stupid violation of the ceasefire agreement.” The Strait of Hormuz is a key route for about 20% of global oil supplies—any escalation in this region immediately catches the attention of commodity markets.
At the same time, Fed’s Kashkari spoke out on inflation—according to him, the labor market is not currently a source of inflation. Price pressures are being driven by the supply side, and one of the factors he mentioned is… the expansion of AI infrastructure. Kashkari of the Fed said that the development of artificial intelligence likely means the Fed will have to raise interest rates.
To provide the best experiences, we use technologies like cookies to store and/or access device information. Consenting to these technologies will allow us to process data such as browsing behavior or unique IDs on this site. Not consenting or withdrawing consent, may adversely affect certain features and functions.
Functional
Always active
The technical storage or access is strictly necessary for the legitimate purpose of enabling the use of a specific service explicitly requested by the subscriber or user, or for the sole purpose of carrying out the transmission of a communication over an electronic communications network.
Preferences
The technical storage or access is necessary for the legitimate purpose of storing preferences that are not requested by the subscriber or user.
Statistics
The technical storage or access that is used exclusively for statistical purposes.The technical storage or access that is used exclusively for anonymous statistical purposes. Without a subpoena, voluntary compliance on the part of your Internet Service Provider, or additional records from a third party, information stored or retrieved for this purpose alone cannot usually be used to identify you.
Marketing
The technical storage or access is required to create user profiles to send advertising, or to track the user on a website or across several websites for similar marketing purposes.