- The Indian Rupee bounces back against the US Dollar as Israel-Iran ceasefire pushes oil prices lower.
- US President Trump expresses confidence that a total victory over Iran could be announced in two weeks.
- Investors shift focus to the US-India CPI data for May.
The Indian Rupee (INR) rebounds against the US Dollar (USD) at open on Tuesday after a sharp decline the previous day. The USD/INR pair drops to near 95.50 as oil prices tumble, following reports of a ceasefire between Israel and Iran after the exchange of attacks over the weekend.
As of writing, the MCX Crude Oil contract expiring on June 18 is down 1% to near 8,600. Currencies from economies, such as India, which rely heavily on oil imports to meet their energy needs, tend to underperform in a high oil price environment.
Iran-Israel ceasefire drags oil prices
Oil prices started retreating after a strong start on Monday, following confirmation from Iran that it will stop attacking on Israeli territory. However, Iran’s armed forces warned of harsher attacks if Israel resumes attacks on Lebanon.
Iran agreed to a truce with Israel after United States (US) President Donald Trump urged both to stop attacking each other immediately.
On late Monday, US President Trump expressed confidence that Washington can announce a total victory over Iran in the next two weeks and “oil prices will come tumbling down”.
FIIs keep paring stake in Indian stock market
Overseas investors continue to lighten their stakes in the Indian stock market amid growing concerns over India Inc.’ earnings projections in the wake of higher energy prices. So far in June, Foreign Institutional Investors (FIIs) have remained net sellers on all trading days, and have offloaded their stake worth Rs. 36,370.14 crore. In May, FIIs also remained net sellers and sold their investments worth Rs. 55,963.33 crore.
Investors await US-India CPI data
This week, major triggers for USD/INR will be the Consumer Price Index (CPI) data for May from both the US and India, which will be released on Wednesday and Friday, respectively. The US headline CPI is expected to arrive higher at 4.2% Year-on-Year (YoY) from 3.8% in April. In the same period, the US core CPI – which excludes volatile food and energy items – is seen higher at 2.9% from the previous reading of 2.8%.
Signs of US inflationary pressures accelerating further would prompt expectations of interest rate hikes by the Federal Reserve (Fed) this year.
Meanwhile, India’s CPI data for May is also expected to come in higher at 4% YoY from 3.48% in April.
Last week, the Reserve Bank of India (RBI) warned of upside inflation risks in the monetary policy announcement and stated that it would act if it becomes more persistent. “If inflation becomes generalized, persistent and starts influencing inflation expectations, policy action may become necessary,” the RBI Governor Sanjay Malhotra said.
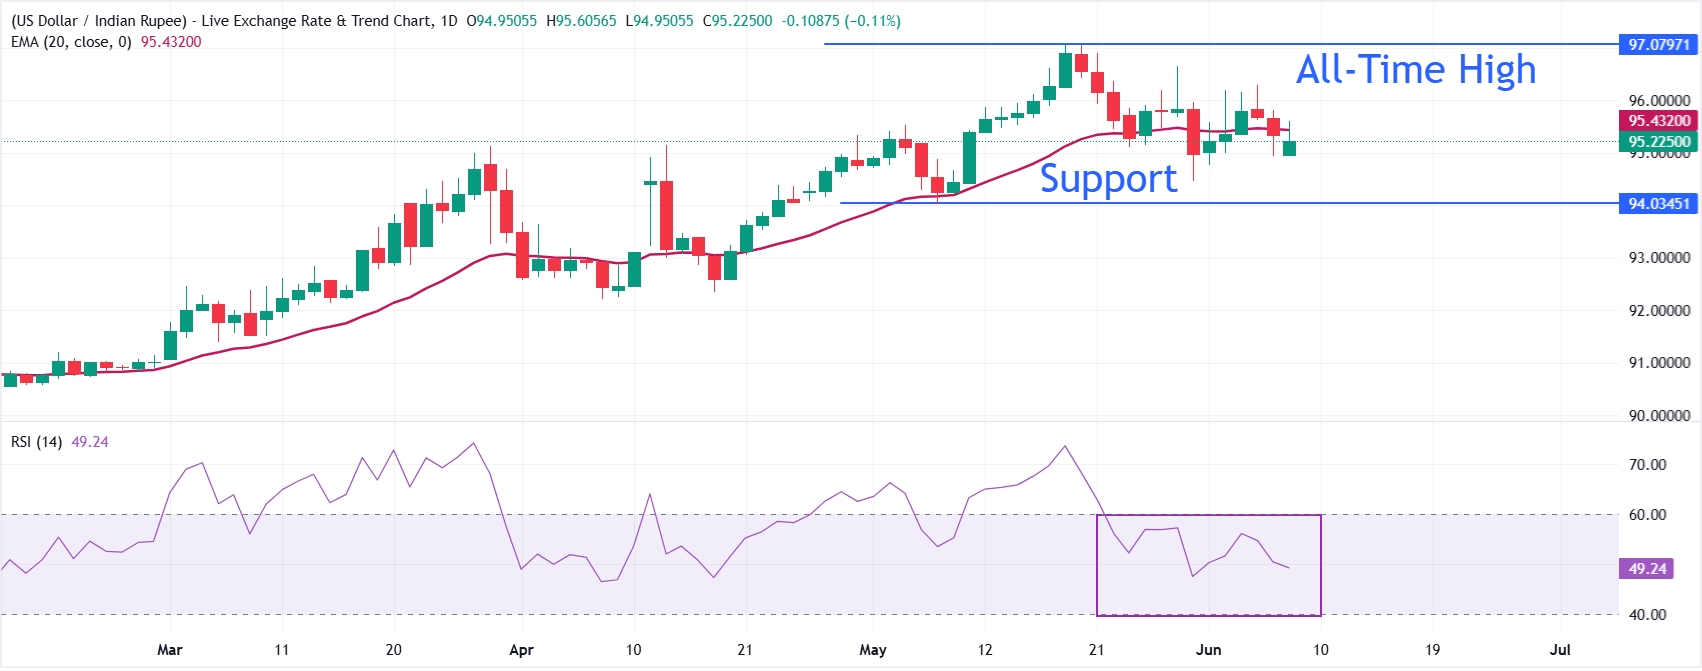
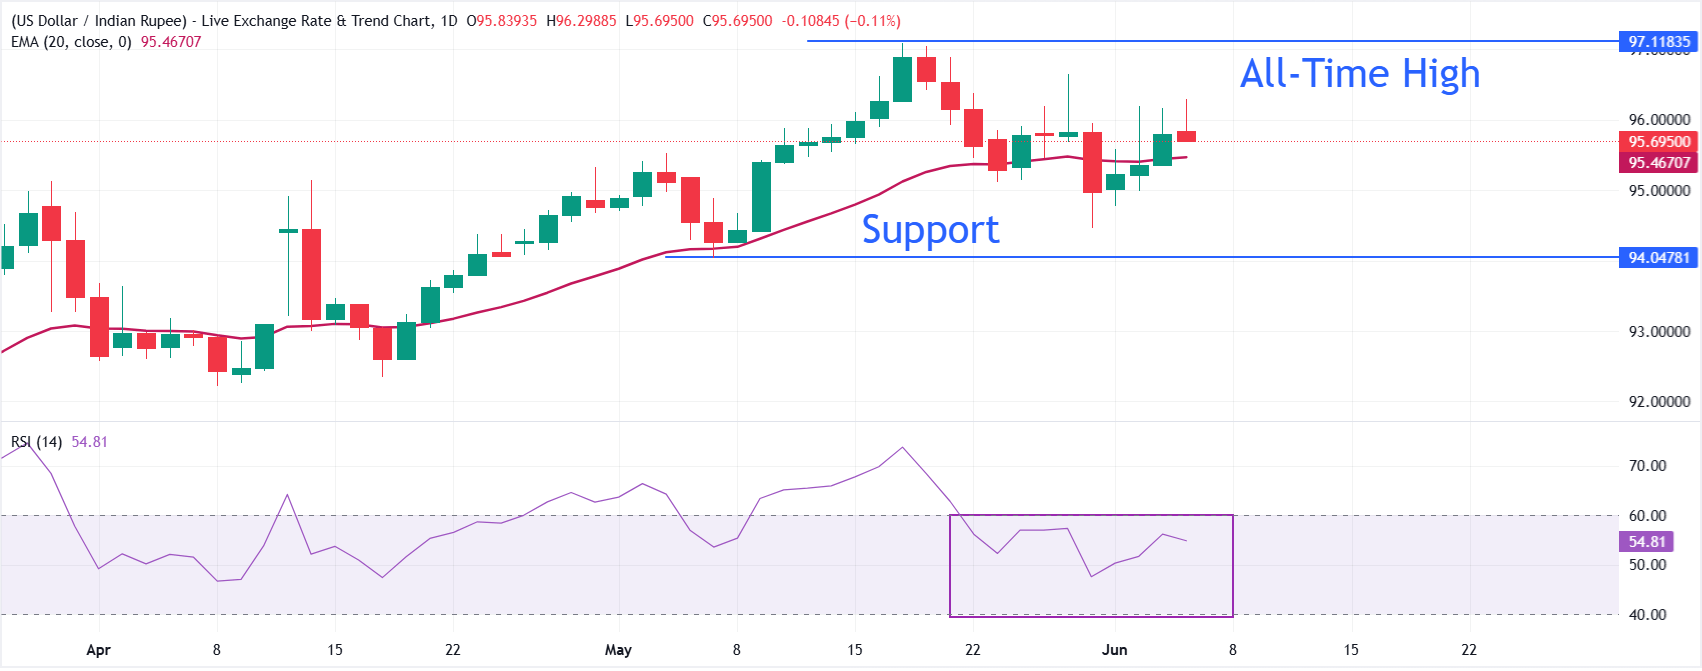
Technical Analysis: USD/INR sees downside below 95.00
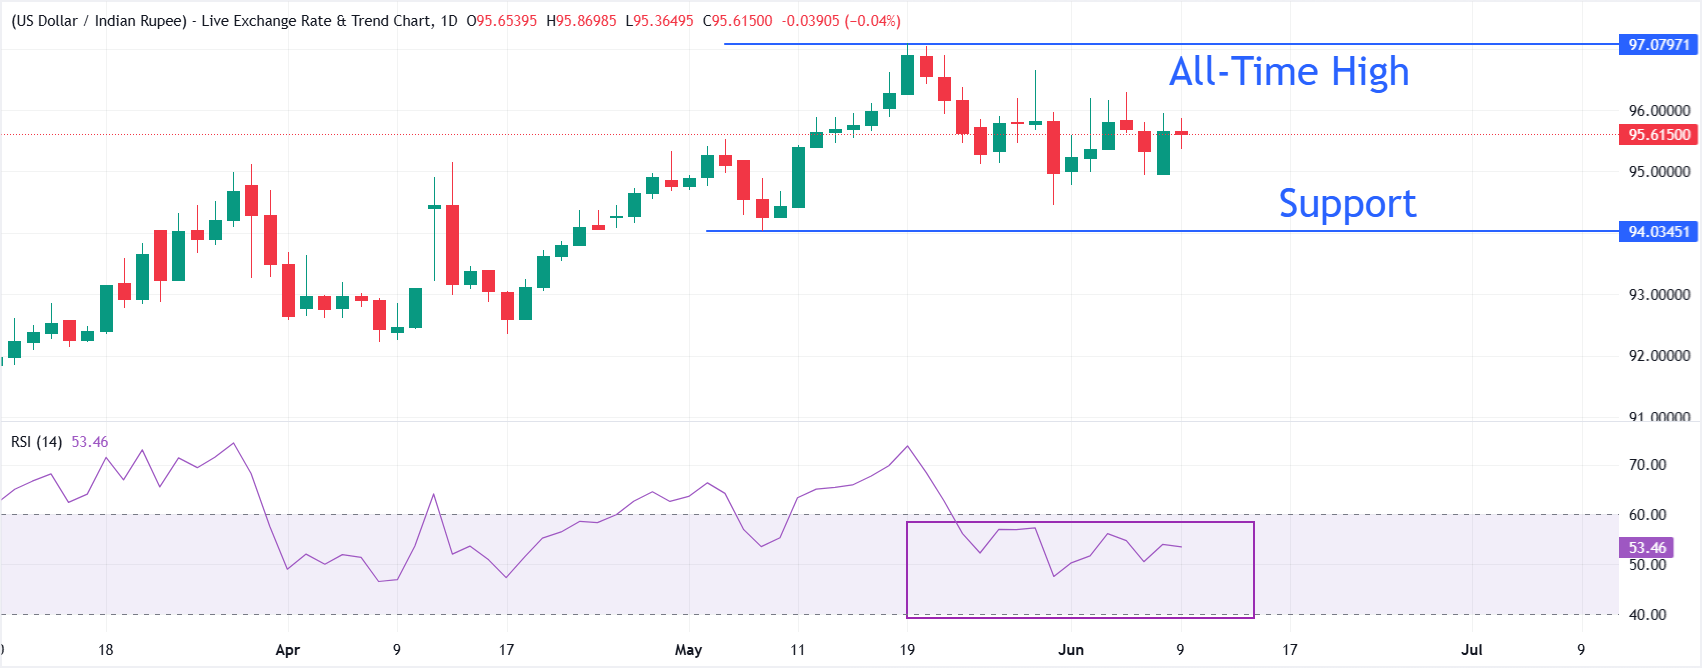
USD/INR trades slightly lower at around 95.50. The pair is essentially flat, trading sideways for almost two weeks. The Relative Strength Index (RSI) at 53.46 hovers just above the midline, hinting at balanced momentum with only a slight bullish tilt but no clear directional conviction.
On the downside, the pair could slide towards the May 07 low at 94.03 if it fails to hold the key support level of 95.00. Looking up, the pair could aim to revisit the all-time high above 97.00 if it manages to recover above the June 4 high at 96.30.