GBP/USD gains ground to near 1.3360 in Friday’s early European session.
The major pair remains capped below the key 100-day MA.
The first upside barrier emerges at 1.3410; the initial support level is seen at 1.3300.
The GBP/USD pair trades in positive territory around 1.3360 during the early European session on Friday. The British Pound (GBP) gathers strength against the US Dollar (USD) on a weaker-than-expected US Nonfarm Payrolls (NFP) report.
Signs of a cooling US labor market have prompted financial markets to dial back expectations for a near-term interest rate hike from the US Federal Reserve (Fed), weighing on the Greenback and creating a tailwind for the major pair. Financial markets are now pricing in nearly a 52% chance of a US rate hike by September, down from 66% before the jobs data, according to the CME FedWatch tool.
Traders will closely watch the developments surrounding UK politics since Keir Starmer stepped down last week. Natixis analysts said while Andy Burnham’s commitment to fiscal discipline offers near-term support, markets will closely monitor future budgets for any signs that fiscal rules are being relaxed to finance higher public spending.
Technical Analysis:
In the daily chart, GBP/USD sits above the Bollinger middle band, keeping a modestly supported tone, while it remains capped by the 100-day simple moving average (SMA). The Relative Strength Index (RSI) at about 54 suggests mildly positive but not overextended momentum.
On the topside, initial resistance is located at the 100-day SMA near 1.3410, and a daily close above this barrier would open the door toward the upper Bollinger band around 1.3468. On the downside, immediate support aligns with the Bollinger middle band at 1.3300, ahead of the lower band near 1.3132, where a deeper pullback could attract dip-buying interest within the broader range.
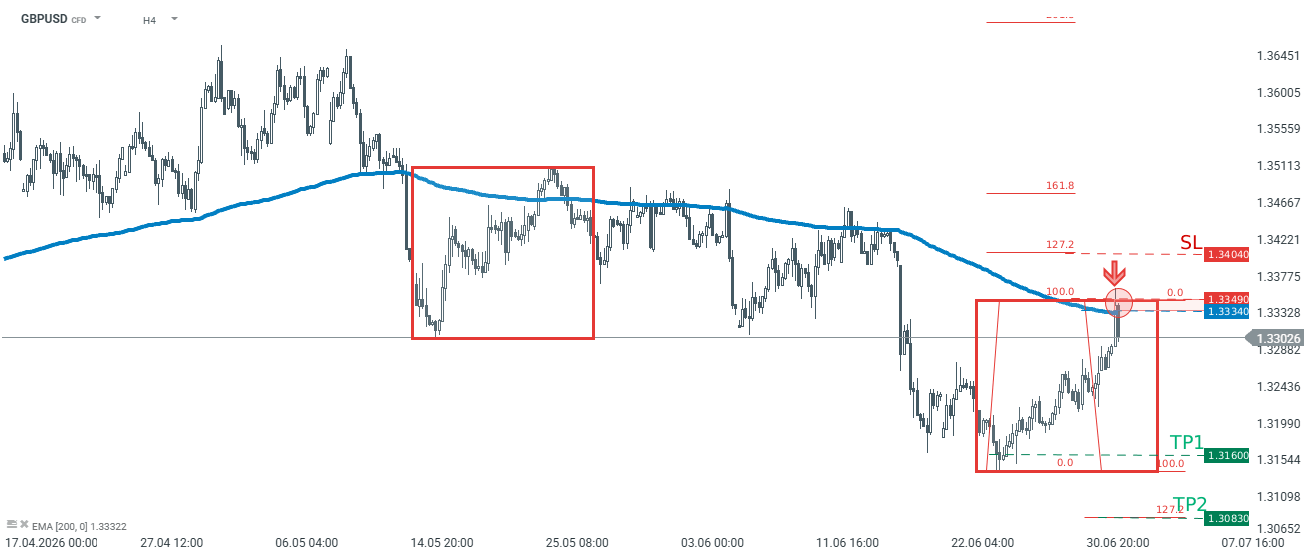
Facts: The price bounced off the upper limit of 1:1 structure GBPUSD sits below the 200-period moving average from H4 interval Recommendation: Trade: Short position on GBPUSD at market price Target: 1.3160, 1.3083 Stop: 1.3404
Opinion: Looking at GBPUSD chart at the H4 interval, one can see that the price bounced off the key resistance today. The area near 1.3340 is marked with the upper limit of 1:1 structure, and 200-period moving average from the H4 interval. According to the Overbalance strategy, as long as the price sits below the aforementioned area, the main trend remains downward. We recommend going short GBPUSD at market price with two targets: 1.3160 and 1.3083. We also recommend placing a stop loss order at 1.3404. Source: xStation5
Will there be a World Cup boost? The June payrolls report is released today at 1330 BST, a day early this month due to the Independence day holiday on Friday. The market is expecting an approximately 113k increase in payrolls, which is a step down from the 172k print for May, the unemployment rate is expected to remain stable at 4.3%, and average hourly earnings could pick up a notch to 3.5% from 3.4% YoY. The strong reading for May makes the June report a test: can the upside momentum be maintained, or was the May figure an anomaly? Federal government jobs jumped last month, but this is expected to be one-off. If we get a reading that is close to consensus, then it would suggest modest growth in US jobs numbers are continuing. This would point to a resilient labour market that is not falling off a cliff.
Resilient labour market
Average monthly jobs growth this year has been above 80k, and we do not expect a number lower than this. The Atlanta Fed’s GDPNow model is predicting robust GDP growth for Q2 of 2.5%, which should easily support US job growth of 100k plus. We expect the bulk of jobs to have been created in the education and healthcare sector, with decent gains for construction and leisure and hospitality. The question is, could there be a World Cup boost? Stadium attendance at games so far in the US has hit a record high, of more than 3.5mn, which could boost hotels and the leisure sector.
Will payrolls boost Fed rate hike chances?
This payrolls report comes a day after the new Federal Reserve Chair, Kevin Warsh, spoke at the ECB’s central bankers conference in Portugal. Kevin Warsh said a few things that are worth noting. Firstly, that inflation expectations are moderating, secondly, that AI’s impact on the jobs market is not yet visible and thirdly, that his task forces could change what economic data the Fed focuses on. The latter point is worth noting. Although we think that payrolls will remain important for central bank decision making, change is coming at the Fed. As we lead up to this payrolls report, the market continues to price in a 28% chance of a rate hike at the Fed’s next meeting on 29th July.
Interest rate futures markets have repriced rates higher after a surprisingly hawkish FOMC meeting, and if we get a significant upside surprise for payrolls today, of 180k plus, then we could see the chance of a July rate hike surge past 50%. So far, the lead indicators have been mixed. Although the ISM manufacturing employment index was stronger, it remained below 50. Added to this, the ADP private sector payrolls report was slightly weaker than expected and was 113k for last month. The 4-week moving average for initial jobless claims ticked higher last week, but at 224k, it is still low.
The impact of a downside surprise
A downside surprise of 70k or lower could see the US Treasury curve steepen, as 2-year Treasury yields fall, and long-end bond yields rise. We think a weaker number could also lead to a recalibration of US interest rate expectations, and we think the Fed would be unlikely to hike rates in July if the labour market is showing signs of softening, especially if the unemployment rate also rises.
What’s next for the dollar
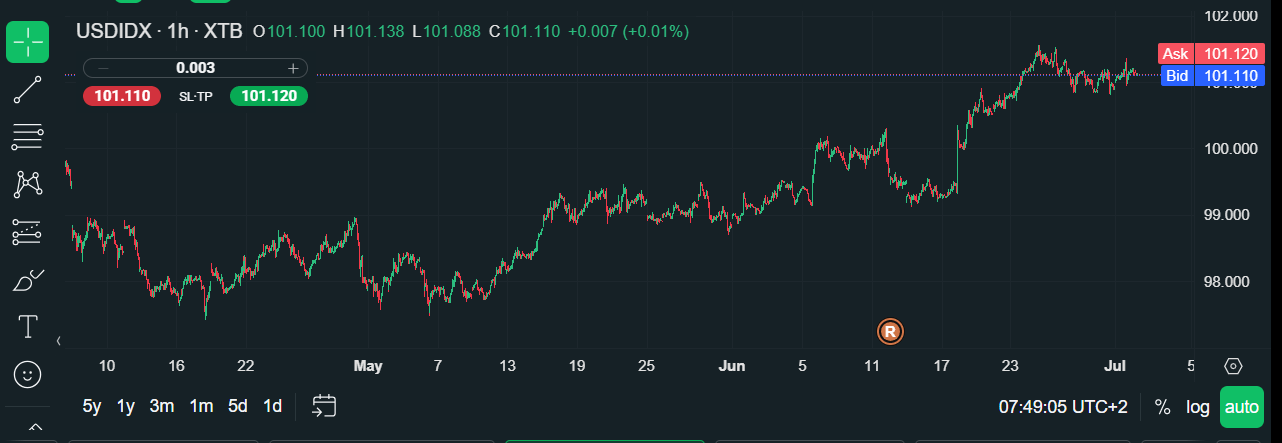
This data will also be the next major driver of the dollar, at least until we get the June CPI report. The US dollar index is at a 14-month high, and the US dollar is the best performing currency in the past year. In the past month, the USD index has risen by 2.5%. The break above 100.50 2 weeks ago was an extremely bullish development, and is supportive of further gains. However, the forex market can be contrarian around payrolls reports, so we could see some buying the rumour, before selling the fact later on Thursday. The technicals continue to point in a bullish direction, so the path of least resistance is for further gains for the Greenback. If payrolls are weak, and the dollar does experience a sell off, as long as the dollar index does not fall below 100.50, then the uptrend remains intact.
USDJPY is trading slightly lower this morning at 162.70 (-0.15%) after hitting new multi-year highs around 163, as the market awaits the key U.S. payrolls report.
Context of Today’s NFP Data
Today’s June payrolls report is the main catalyst of the day—the consensus expects a marked slowdown to about 110,000 jobs following a surprisingly strong May reading of 172,000, with the unemployment rate holding steady at 4.3% and wage growth accelerating to 3.5% y/y. The market is trying to assess whether May’s surge represented a genuine labor market recovery or merely a one-off effect (including the World Cup in the U.S.). Employment growth this year has averaged above 80,000, which supports the scenario of a resilient labor market. CBA warns that another positive surprise could push USD/JPY toward 165 and test the Japanese authorities’ determination to defend the yen, while a weak reading (below 70,000–90,000) would ease pressure on the Fed to remain hawkish and could trigger a downward correction in the pair.
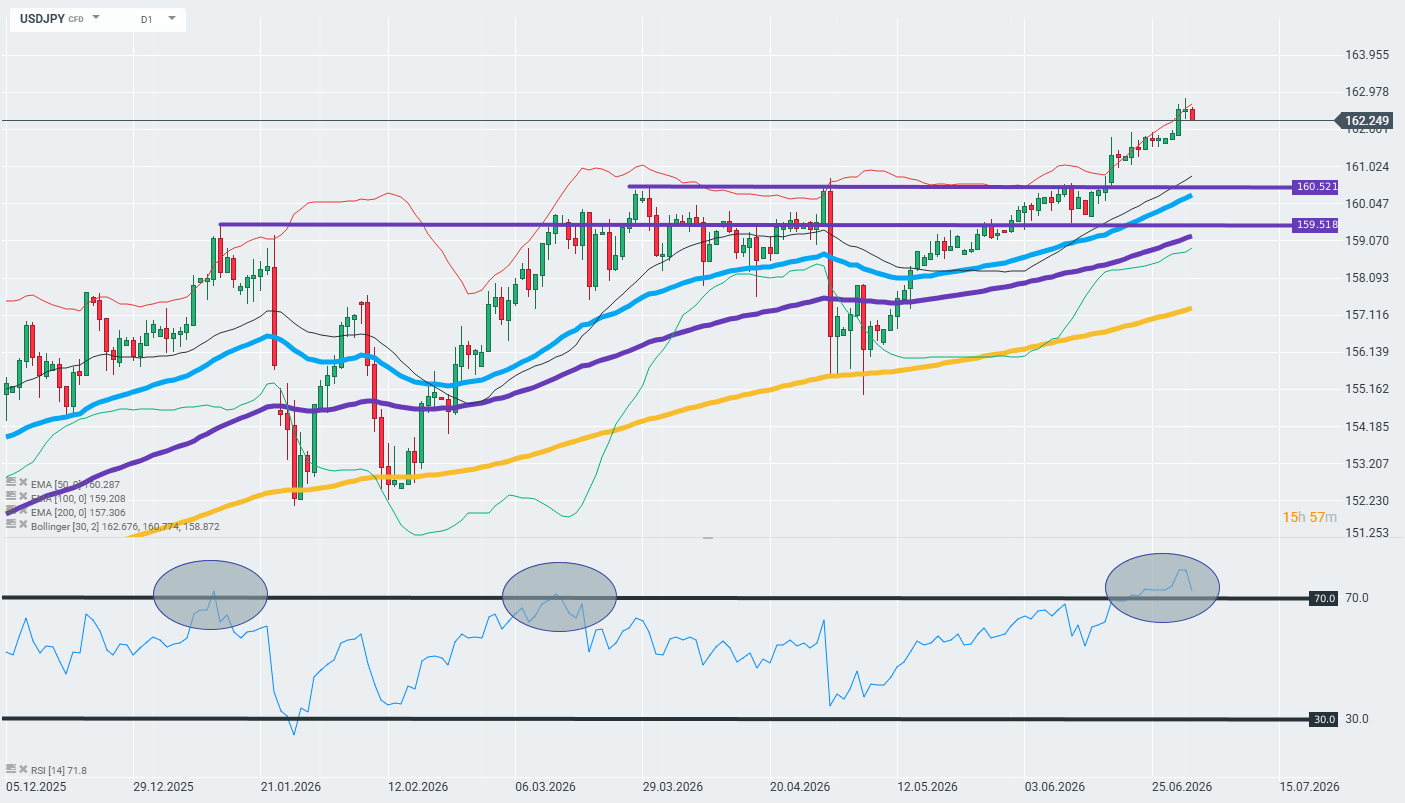
Technical Analysis
The price broke through key resistance levels at 159.52 and 160.52 JPY with momentum, moving clearly above the 50-day EMA (160.29), the 100-day EMA (159.21), and the 200-day EMA (157.31), confirming a strong uptrend. However, the RSI at 71.8–76.2 signals overbought conditions on the daily chart, which historically has preceded short-term consolidations or corrections, especially near multi-year highs. The trend remains clearly bullish for the dollar (bearish for the yen), and the 162–163 range also represents an area of heightened risk of currency intervention by Japanese authorities. Source: xStation
A Brief Look at Data from Japan
The Bank of Japan raised its policy rate to 1.0% in June—the highest level in 31 years—but the market does not expect another hike until the October–December 2026 window, even though about 90% of economists anticipate one more hike by December. This slow pace of policy normalization by the BoJ, coupled with the hawkish stance of the Fed, is the main structural reason why the interest rate differential between the U.S. and Japan remains wide and is sustaining the yen’s long-term downward trend—verbal interventions by Japanese officials have so far failed to permanently reverse this trend.
EUR/USD attracts some buyers and moves away from the weekly low.
The upside seems limited as traders keenly await the US NFP report.
The bearish setup backs the case for the emergence of fresh sellers.
The EUR/USD pair ticks higher during the Asian session on Thursday, though it lacks bullish conviction as traders keenly await the release of the crucial US Nonfarm Payrolls (NFP) report. Spot prices currently trade around the 1.1385 area and remain close to the weekly low, touched on Wednesday.
From a technical perspective, the EUR/USD pair retains a negative near-term bias beneath the 200-period Exponential Moving Average (EMA) on the 4-hour chart. Adding to this, the recent recovery from the lowest level since May 2025 has been along an upward-sloping channel, which constitutes the formation of a bearish flag pattern.
Moreover, the Relative Strength Index (14) near 42.5 and a slightly negative Moving Average Convergence Divergence (MACD) reading hint at fading bullish momentum. Momentum indicators together reinforce the near-term bearish outlook and suggest that the path of least resistance for the EUR/USD pair remains to the downside.
The EUR/USD pair holds just above the lower boundary of the rising parallel channel at 1.1366. This, however, points to only a tentative structural support, and a convincing break below would open the way for a slide. Spot prices might then aim towards retesting the year-to-date trough, around the 1.1335-1.1330 region, touched in June.
On the topside, initial resistance aligns with the upper edge of the upward parallel channel at 1.1451, ahead of stronger supply at the 200-period EMA clustered around 1.1522. The EUR/USD pair would need to reclaim the said barriers to ease the broader bearish tone and shift the technical picture toward a more constructive outlook.
(The technical analysis of this story was written with the help of an AI tool.)
EUR/JPY posts modest losses near 184.95 in Thursday’s early European session.
The cross keeps a bullish near-term tone, but further consolidation cannot be ruled out amid neutral RSI momentum.
The first upside barrier is seen at 185.00; the initial support level to watch is 184.90.
The EUR/JPY cross trades on a negative note around 184.95 during the early European session on Thursday. Eurozone inflation fell more than expected in June, easing pressure on the European Central Bank (ECB) to raise rates at its next meeting on July 23. This, in turn, could weigh on the Euro (EUR) against the Japanese Yen (JPY).
Data released by Eurostat on Wednesday showed that Eurozone inflation, as measured by the Harmonized Index of Consumer Prices (HICP), dropped to 2.8% YoY in June from 3.2% in May. This figure came in below the consensus of 3.0%.
Morgan Stanley economists said softer Eurozone June inflation could also “lower the bar a touch for the ECB to be on hold in September,” adding that energy pressures likely had a “limited” direct impact on eurozone prices.
Following Wednesday’s print, traders continued to anticipate the ECB to deliver another quarter-point rate rise by the end of this year, according to Morningstar.
Technical Analysis:
In the daily chart, EUR/JPY holds above the Bollinger Bands middle line and the 100-day moving average, keeping a mildly bullish near-term tone as price gravitates near recent highs. The Relative Strength Index (14) hovers around 50, suggesting balanced momentum and favoring a continuation of range-bound gains rather than an impulsive breakout.
On the topside, immediate resistance is located at the 185.00 psychological level, en route to the June 30 high of 185.86. The next hurdle emerges at the Bollinger Bands upper band near 186.15, where bullish attempts could meet profit-taking.
On the downside, initial support is seen at the Bollinger middle band at 184.90, followed by the 100-day moving average at 184.65; a deeper pullback would expose the lower Bollinger band support around 183.65.
USD/JPY rises to near 167.73 as US Treasury Yields soar, following upbeat US JOLTS Job Openings data.
Investors shift their focus to the US ADP Employment Change and the ISM Manufacturing PMI data for June.
Japan’s officials have signaled that they are ready to intervene to support the Yen.
The USD/JPY pair trades 0.1% higher to near 162.73 during the European trading session on Wednesday. The pair reflects strength as surging United States (US) Treasury Yields have strengthened the US Dollar (USD).
In the European trade, 10-year US Treasury Yields are up 0.18% to 4.47%, extending Tuesday’s little over 2% gains. The US Dollar Index (DXY), which tracks the Greenback’s value against six major currencies, is up 0.16% to near 101.33.
US Dollar Price Today
The table below shows the percentage change of US Dollar (USD) against listed major currencies today. US Dollar was the strongest against the Australian Dollar.
USD
EUR
GBP
JPY
CAD
AUD
NZD
CHF
USD
0.12%
0.14%
0.08%
0.10%
0.36%
0.02%
0.05%
EUR
-0.12%
0.02%
-0.04%
-0.01%
0.26%
-0.11%
-0.05%
GBP
-0.14%
-0.02%
-0.06%
-0.03%
0.22%
-0.13%
-0.05%
JPY
-0.08%
0.04%
0.06%
0.00%
0.29%
-0.09%
-0.01%
CAD
-0.10%
0.01%
0.03%
-0.01%
0.27%
-0.11%
-0.02%
AUD
-0.36%
-0.26%
-0.22%
-0.29%
-0.27%
-0.37%
-0.29%
NZD
-0.02%
0.11%
0.13%
0.09%
0.11%
0.37%
0.09%
CHF
-0.05%
0.05%
0.05%
0.01%
0.02%
0.29%
-0.09%
The heat map shows percentage changes of major currencies against each other. The base currency is picked from the left column, while the quote currency is picked from the top row. For example, if you pick the US Dollar from the left column and move along the horizontal line to the Japanese Yen, the percentage change displayed in the box will represent USD (base)/JPY (quote).
US bond yields are soaring due to signs of improving US job market conditions. On Tuesday, the US JOLTS Job Openings data for May arrived at 7.594 million fresh jobs, higher than 7.3 million estimates and the previous reading of 7.585 million.
Meanwhile, investors await the US ADP Employment Change and the ISM Manufacturing PMI data for June, which will be released during the North American session.
On the Tokyo front, investors expect the Japanese administration to intervene anytime soon to support the falling Japanese Yen (JPY). On Tuesday, Japan’s Chief Cabinet Secretary Minoru Kihara said that the administration is always ready to take necessary action on Forex; however, he didn’t deliver any comments regarding specific FX levels.
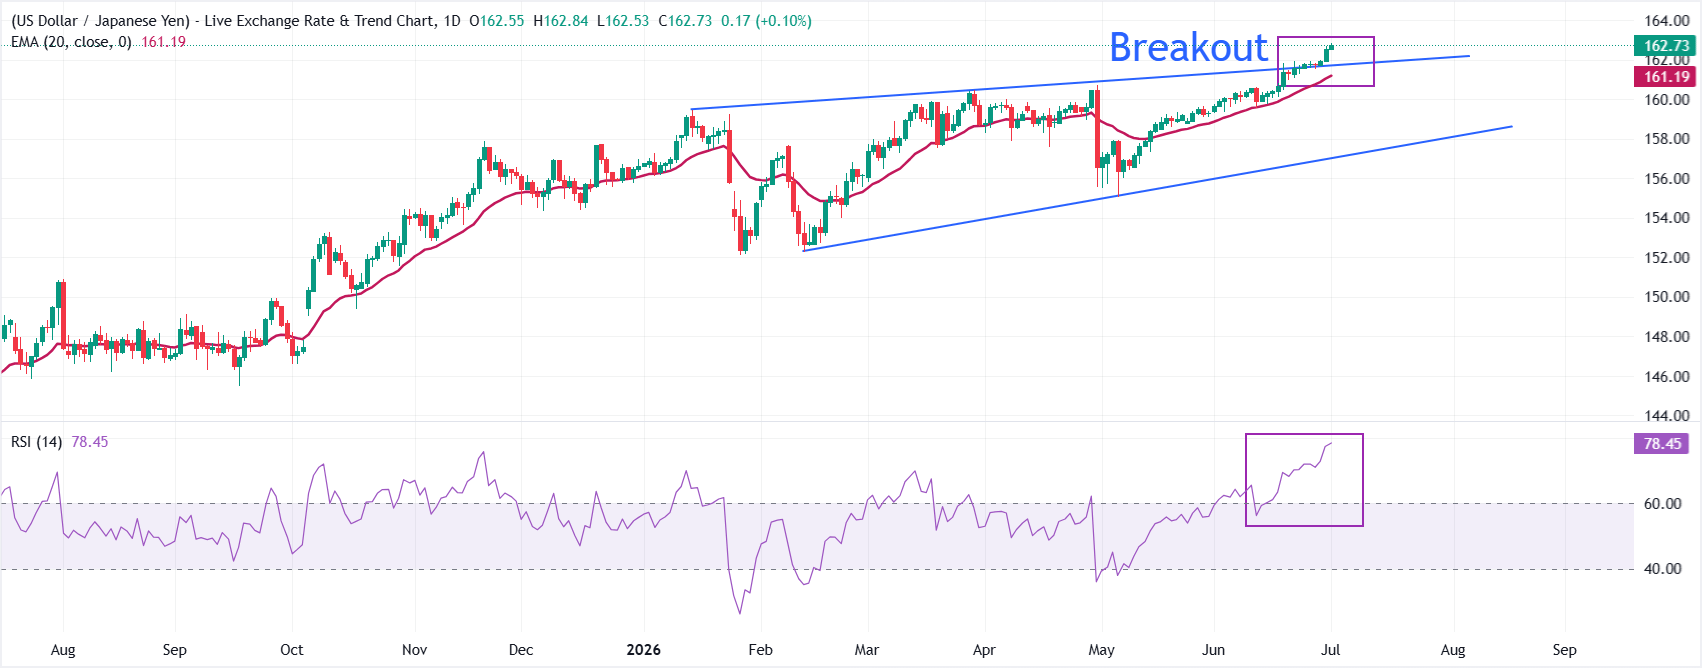
USD/JPY technical analysis
USD/JPY trades higher at around 162.73, extending its bullish bias as spot holds well above the 20-day exponential moving average (EMA) at 161.19. The overall trend of the pair is bullish, following the breakout of the Rising Channel formation.
The Relative Strength Index (RSI) at 78.45 sits deep in overbought territory, suggesting upside momentum remains strong but also warns that the pair could be vulnerable to bouts of corrective pullback even within the broader uptrend.
On the downside, immediate support is seen at the Rising Channel breakout region near 161.75, followed by the 20-day EMA near 161.19. Looking up, the pair could extend the rally towards 163.00 and 164.00.
EUR/USD weakens to around 1.1410 in Wednesday’s early European session.
The negative outlook of the major pair remains intact below the 100-day SMA, with bearish RSI momentum.
The immediate resistance level is seen at 1.1485; the first downside target to watch is 1.1320.
The EUR/USD pair trades on a negative note near 1.1410 during the early European trading hours on Wednesday. Cooling inflation in Germany has lowered expectations for the European Central Bank (ECB) rate hikes, weighing on the Euro (EUR) against the US Dollar (USD).
Germany’s Consumer Price Index (CPI) inflation fell to 2.3% in June, down from 2.6% in May, according to Destatis on Tuesday. This figure came in softer than the market expectations of 2.5%. ECB President Christine Lagarde last week said that there was no need for “forceful” action, citing falling energy prices and the lack of “second-round” effects like higher wage demands that could further stoke inflation.
Traders brace for the preliminary reading of the Harmonized Index of Consumer Prices (HICP) from the Eurozone. In case of hotter-than-expected outcomes, this could lift the shared currency in the near term.
On the US docket, the ADP Employment and ISM Manufacturing Purchasing Managers Index (PMI) reports will be published later on Wednesday. All eyes will be on the Nonfarm Payrolls (NFP) data on Thursday, which is expected to show 111,000 job additions in June.
Technical Analysis:
In the daily chart, EUR/USD maintains a bearish near-term tone as it holds below the 20-day Bollinger simple moving average (SMA) and the 100-day moving average (MA). The pair is drifting near the lower half of the recent Bollinger envelope, while the 14-period Relative Strength Index (RSI) around 36 suggests weak, still-negative momentum rather than an immediate oversold condition.
On the topside, initial resistance is seen at the 20-day Bollinger SMA near 1.1485, followed by the 100-day MA around 1.1632 and the upper Bollinger band close to 1.1650, which together outline a dense supply zone capping recovery attempts. On the downside, the June 29 low of 1.1381 acts as the next notable support. Any follow-through selling below this level could expose further weakness toward lower Bollinger band at approximately 1.1320, followed by the 1.1300 psychological level.
To provide the best experiences, we use technologies like cookies to store and/or access device information. Consenting to these technologies will allow us to process data such as browsing behavior or unique IDs on this site. Not consenting or withdrawing consent, may adversely affect certain features and functions.
Functional
Always active
The technical storage or access is strictly necessary for the legitimate purpose of enabling the use of a specific service explicitly requested by the subscriber or user, or for the sole purpose of carrying out the transmission of a communication over an electronic communications network.
Preferences
The technical storage or access is necessary for the legitimate purpose of storing preferences that are not requested by the subscriber or user.
Statistics
The technical storage or access that is used exclusively for statistical purposes.The technical storage or access that is used exclusively for anonymous statistical purposes. Without a subpoena, voluntary compliance on the part of your Internet Service Provider, or additional records from a third party, information stored or retrieved for this purpose alone cannot usually be used to identify you.
Marketing
The technical storage or access is required to create user profiles to send advertising, or to track the user on a website or across several websites for similar marketing purposes.