AUD/JPY remains calm following missing domestic trade data expectations.
Australia’s Trade Balance shifted to a A$3,018M deficit in May, reversing April’s surplus.
The Japanese Yen may receive support amid the potential for government intervention.
AUD/JPY remains flat after recovering daily losses, trading around 112.10 during the Asian hours on Thursday. The currency cross held its ground as the Australian Dollar (AUD) showed resilience, even after domestic trade data significantly missed market expectations.
According to the Australian Bureau of Statistics (ABS), the Trade Balance unexpectedly swung into a deficit of A$3,018 million in May, a sharp reversal from the previous month’s revised surplus of A$1,383 million. This fell well short of the market consensus, which had anticipated a surplus of A$2,200 million. The downturn was primarily driven by a 6.9% month-on-month plunge in exports, compounded by a 2.6% increase in imports.
The AUD/JPY cross moves little as the Japanese Yen (JPY) remains under intense pressure despite mounting evidence that the Bank of Japan (BoJ) may continue normalizing its monetary policy. Japan’s latest Q2 Tankan Large Manufacturing Index climbed to 22 from 17 prior, the highest level in eight years, strengthening the case for further interest rate hikes later this year.
The JPY continues to languish near its weakest level against the US Dollar (USD) in four decades. This prolonged weakness has kept traders on high alert for potential government intervention, which could put downward pressure on the AUD/JPY cross, especially ahead of a US public holiday when thinner market liquidity could magnify the impact of any official action. Reinforcing this caution, Finance Minister Satsuki Katayama reiterated warnings that authorities stand ready to respond appropriately to currency market developments at any time.
AUD/JPY softens to near 112.20 in Wednesday’s early European session.
The cross maintains a mildly bearish bias in the near term, with soft RSI momentum.
The first upside barrier emerges at 112.32; the initial support level is located at 111.25.
The AUD/JPY cross trades in negative territory around 112.20 during the early European trading hours on Tuesday. The Japanese Yen (JPY) strengthens against the Australian Dollar (AUD) as traders are on alert for possible intervention from Japanese authorities.
Japan’s Finance Minister Satsuki Katayama said on Tuesday that the government was ready to take appropriate action against excessive currency moves. Additionally, Chief Cabinet Secretary Minoru Kihara stated that the government will work to build an economy less vulnerable to foreign-exchange volatility while remaining prepared to intervene in currency markets if necessary.
On the other hand, a hawkish tone from the Reserve Bank of Australia (RBA) might help limit the Aussie’s losses. According to the RBA Minutes from its June meeting, monetary policy needed to remain restrictive to remove excess demand in the economy. Markets were pricing only about 10 basis points (bps) of additional tightening by year-end, while pricing about 17 bps of easing by 2027, per Reuters.
Technical Analysis:
In the daily chart, AUD/JPY keeps a mildly bearish near-term tone as it slips just under the 100-day Simple Moving Average (SMA) and the Bollinger Bands midline. Price holding below these clustered moving-average resistances suggests rallies are likely to meet supply overhead, while the Relative Strength Index (RSI) around 44 points to soft but not extreme downside momentum.
On the topside, initial resistance is seen at the 100-day SMA at 112.32, with the Bollinger midline around 112.62 acting as the next cap, ahead of the upper Bollinger band near 114.01. On the downside, the first noteworthy support emerges at the lower Bollinger band around 111.25, where a break would open the door to a deeper correction within the broader range.
AUD/JPY falls despite hawkish RBA Minutes showing readiness to raise rates further if financial conditions require it.
China’s manufacturing and non-manufacturing PMIs both rose, beating market expectations to signal steady economic expansion.
Japan’s Finance Minister Katayama warned Tuesday that the government will intervene appropriately to address volatile currency moves as needed.
AUD/JPY loses ground after remaining flat in the previous day, trading around 111.40 during the Asian hours on Tuesday. The currency cross remains subdued as the Australian Dollar (AUD) holds losses following the release of the Reserve Bank of Australia’s (RBA) Meeting Minutes and key Purchasing Managers’ Index (PMI) data from China.
The RBA June monetary policy Meeting Minutes revealed that while the board views current financial conditions as somewhat tight, it remains prepared to implement further rate hikes if necessary to ensure price stability. The central bank highlighted that the ongoing conflict in the Middle East poses a dual threat to the economic outlook, presenting significant upside risks to inflation alongside downside risks to overall growth.
China, Australia’s close trading partner, showed stronger-than-expected resilience in June. The official Manufacturing PMI edged up to 50.3 from the previous 50.0, beating market expectations of 50.1. Simultaneously, the NBS Non-Manufacturing PMI improved to 50.2 from May’s 50.1, comfortably defying the consensus forecast of a contractionary 49.9 print and signaling expansion across both sectors.
The downside of the AUD/JPY cross is limited by persistent weakness in the Japanese Yen (JPY), which remains under pressure due to the wide interest rate gap between Japan and other major economies. This ongoing depreciation has kept policymakers concerned and investors on high alert for potential currency intervention by Tokyo. Highlighting this stance, Japan’s Finance Minister Satsuki Katayama stated on Tuesday that the government “will respond appropriately to currency moves at any time as needed.”
AUD/USD meets with a fresh supply on Friday, though the RBA’s hawkish tilt limits losses.
Hormuz risks and Fed rate hike bets revive USD demand, exerting pressure on spot prices.
Traders now look to the US Consumer Sentiment Index and Fedspeak for a fresh impetus.
The AUD/USD pair attracts fresh sellers following the previous day’s modest gains and drops to a fresh low since early April during the Asian session on Friday. Spot prices, however, recover a few pips in the last hour and currently trade just below the 0.6900 mark, still down over 0.25% for the day.
According to the third and final reading published by the US Bureau of Economic Analysis on Thursday, the economy grew at an annualized rate of 2.1% in the first quarter of 2026 compared to the second estimate of 1.6% rise. Adding to this, the US Personal Consumption Expenditures (PCE) Price Index highlighted persistent inflationary pressures, keeping an interest rate hike by the US Federal Reserve (Fed) this year firmly on the table. Apart from this, the cautious market mood helps the safe-haven US Dollar (USD) stall its corrective pullback from the highest level since May 2025, touched on Thursday, and exerts downward pressure on the AUD/USD pair.
Reports suggested that Iran’s Islamic Revolutionary Guard Corps (IRGC) attacked a Singapore-flagged cargo ship in the Strait of Hormuz. The latest development reignites worries about the sustainability of the preliminary US-Iran peace deal. Apart from this, the recent tech-driven selloff in the equity markets has triggered global risk aversion, which is seen as another factor behind the Greenback’s relative outperformance against the perceived riskier Australian Dollar (AUD). That said, expectations that the Reserve Bank of Australia (RBA) will stick to its hawkish stance hold back bearish traders from placing aggressive bets around the AUD/USD pair.
Traders now look forward to the release of the revived University of Michigan US Consumer Sentiment Index, which, along with Fedspeak, might influence the USD price dynamics. The focus will then shift to RBA Governor Michele Bullock’s speech on Sunday, which should provide a fresh impetus to the AUD/USD pair at the start of a new week. Nevertheless, spot prices remain on track to register heavy weekly losses, also marking the second straight week of a negative move.
n labour market proved more resilient than expected, with the unemployment rate falling to 4.4% from a five-year high of 4.5% , while employment increased by 40.3k , comfortably beating expectations for a gain of around 30k . At the same time, household spending surprised to the upside, rising 1.3% in May versus market expectations of just 0.5% . For investors, the key takeaway is that the combination of a strong labour market, resilient consumers and still-elevated inflation complicates the case for an early policy easing by the Reserve Bank of Australia (RBA). Money markets continue to price roughly an 80% probability that the RBA will leave interest rates unchanged in August , but the latest data has strengthened the arguments in favour of another rate hike. For the Australian dollar, this provides potential support from a relatively hawkish central bank, although the medium-term direction of the AUD will depend on upcoming inflation and labour market data.
Labour market: Headline numbers beat expectations
The latest figures from the Australian Bureau of Statistics (ABS) showed that the unemployment rate declined to 4.4% , after previously rising to 4.5% , its highest level in five years. This was an important surprise, as economists had expected unemployment to remain unchanged at 4.5%. Employment increased by 40.3k , significantly outperforming market forecasts. At the same time, around 18.3k people lost their jobs, leaving the overall balance of the labour market firmly positive. The ABS also noted that the backlog of people waiting to start new jobs eased during May, helping boost employment and reduce unemployment. One weaker aspect of the report was a 1.1% decline in hours worked . According to the ABS, this was largely due to Australians catching up on leave that had not been taken during April. At first glance, the report appears very strong: unemployment is falling, employment is rising, and consumers are spending more. These are typically supportive conditions for both the Australian dollar and government bond yields. However, the decline in hours worked and sluggish employment growth over recent quarters suggest the labour market may not be as strong beneath the surface as the headline figures imply. The economy could be approaching a turning point, but it has not reached one yet. For the RBA, the latest data still do not provide sufficient evidence that economic conditions are cooling sustainably.
RBA faces a difficult balancing act
The Reserve Bank of Australia has a dual mandate: maintaining inflation within its 2–3% target range while supporting full employment. The latest economic releases suggest that the Australian economy remains too resilient for the central bank to comfortably shift toward a more dovish stance. The next set of inflation and labour market data for June will therefore be crucial, as it will represent the final major batch of macroeconomic information before the RBA’s August policy meeting. The RBA recently left its cash rate unchanged at 4.35% , following three consecutive 25-basis-point rate hikes in 2026. Since the beginning of the year, the official cash rate has increased from 3.60% to 4.35% . For financial markets, the August meeting remains finely balanced. Money markets still assign roughly an 80% probability to a pause , but stronger employment data and the rebound in household spending make such a decision less straightforward.
Inflation remains the key risk
Australia’s headline CPI inflation eased to 4.0% YoY in May , down from 4.2% in April. At first glance, this appears to be encouraging news for the RBA. However, much of the improvement was driven by the Australian government’s temporary reduction in fuel excise taxes. Automotive fuel prices declined 11.9% in May , following a 7.0% decline in April. More importantly, the trimmed mean inflation rate —the RBA’s preferred measure of underlying inflation—rose to 3.6% from 3.4% , indicating that underlying price pressures remain persistent after excluding the most volatile components. For traders, this is the critical part of the inflation story. Unless core inflation begins to decline more convincingly, the RBA may have little choice but to maintain its hawkish rhetoric or even consider another rate increase.
Household spending rebounds
Another important feature of the latest data release was the 1.3% increase in household spending during May . This marked a sharp recovery following declines of 1.1% in April and 1.7% in March . The figure significantly exceeded expectations of a 0.5% increase , suggesting Australian consumers remain surprisingly resilient despite elevated living costs, higher energy bills and rising mortgage repayments. Part of the increase reflected the normalisation of airline ticket refunds following disruptions related to the Middle East conflict. Nevertheless, the broader picture remains unchanged: household spending has yet to show signs of a meaningful slowdown. For the RBA, this creates another challenge. A resilient labour market continues to support household incomes, helping sustain consumption and making it more difficult to return inflation to target.
Mortgage holders remain under pressure
Since the beginning of 2026, the RBA’s cash rate has increased from 3.60% to 4.35% . Three consecutive quarter-point rate hikes have added approximately AUD 342 to the average monthly repayment on a typical AUD 736,000 mortgage. On an annual basis, this translates into roughly AUD 4,128 in additional borrowing costs. Should the RBA deliver a fourth rate increase, Compare the Market estimates average monthly repayments would rise by a further AUD 114 . Combined with the previous hikes, annual mortgage servicing costs would increase by around AUD 5,472 . This is particularly important for investors because household finances remain one of the key transmission channels of monetary policy in Australia. The paradox is that despite mounting pressure on borrowers, consumer spending has yet to weaken materially. This increases the likelihood that the RBA continues to view the economy as too resilient.
Labour shortages remain widespread
Despite record migration levels, Australian businesses continue to report significant labour shortages. According to ABS data, job vacancies remain 45% above pre-pandemic levels and have stayed above 325,000 vacancies for five consecutive years. The most acute shortages remain in healthcare and social assistance , where vacancies are 90% higher than before the pandemic. Manufacturing vacancies are 78% higher , electricity, gas, water and waste services are 76% above pre-pandemic levels, while mining vacancies remain 58% higher . This matters because persistent labour shortages tend to keep wage pressures elevated. As long as businesses continue competing for workers, wage inflation could remain stronger than desired even if overall economic growth slows. For the RBA, this means the labour market may stay too tight for underlying inflation to return quickly to target. For investors, it raises the probability that monetary policy will remain restrictive for longer.
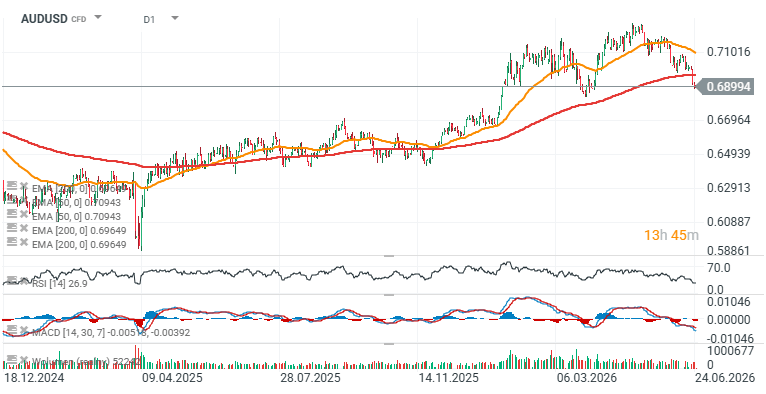
Implications for the Australian dollar – AUD/USD chart
The latest labour market report is broadly supportive for the Australian dollar because it reinforces the case for higher interest rates for longer. Stronger employment, lower unemployment and resilient consumer spending all reduce the scope for the RBA to pivot toward easier monetary policy. For currency pairs such as AUD/USD , AUD/JPY and EUR/AUD , the key question is whether markets begin shifting expectations from a rate pause toward another hike. If rate hike probabilities continue to increase, the Australian dollar could receive additional support through the interest rate channel. At the same time, the Australian dollar remains highly sensitive to global risk sentiment, commodity prices and developments in China. Consequently, stronger domestic macroeconomic data alone may not be sufficient to generate a sustained uptrend if global conditions become less supportive for cyclical currencies. The main conclusion for investors is straightforward: the latest labour market report has reduced expectations of an early dovish shift by the RBA while significantly increasing the importance of the next inflation release.
Looking at the AUD/USD chart, the pair has fallen below the 200-period EMA (red line), which has generally acted as a springboard for rebounds since April 2025. The key question now is whether this latest decline marks the beginning of a more durable trend reversal or simply a deeper correction similar to previous pullbacks. The nearest major support is located around 0.67 , corresponding to the March swing lows, while the 200-period EMA near 0.70 now represents the primary resistance level.
AUD/USD loses ground as the Australian Dollar holds losses following domestic labor market data.
Australia’s Unemployment Rate ticked down to 4.4% from 4.5%, as the economy added a strong 40.3K jobs in May.
CME FedWatch tool indicates markets are now pricing in an 83.1% probability of rate hikes by the end of December.
AUD/USD continues its losing streak for the eighth consecutive day, trading around 0.6900 during the Asian hours on Thursday. The pair remains subdued as the Australian Dollar (AUD) holds losses following the release of domestic labor market data.
According to the latest data from the Australian Bureau of Statistics (ABS), Australia’s labor market showed strong signs of recovery in May, highlighted by the Unemployment Rate trickling down to 4.4% from April’s 4.5%. This drop aligned perfectly with market expectations. The most striking takeaway from the report was the net Employment Change, which saw an influx of 40.3K jobs. This easily surpassed the consensus forecast of a 25K increase and marked a sharp turnaround from the 40.7K jobs lost during the previous month.
Under the hood, the data reveals that while the overall Participation Rate held steady at 66.7%, the workforce expansion was primarily driven by part-time roles. Part-Time Employment surged by 35.2K positions, completely reversing the 19K decline seen in April. Full-Time Employment also bounced back, albeit more modestly, adding 5.2K jobs following a notable drop of 21.7K in the prior reading.
The AUD/USD pair weakens as the US Dollar (USD) may continue its winning streak amid rising market expectations of Federal Reserve (Fed) interest rate hikes later this year. Traders are positioning for tighter monetary policy after Federal Reserve Chairman Kevin Warsh signaled a firm focus on taming inflation, noting that the broader economy remains on a stable footing. Reflecting this hawkish shift, the CME FedWatch tool shows that markets are now pricing in an 83.1% probability of rate hikes by the end of December.
Traders await the upcoming US Personal Consumption Expenditures (PCE) data release due later in the day, where headline inflation is expected to heat up to 4.1% YoY in May from April’s 3.8%, and core PCE is projected to edge higher to 3.4% YoY.
The Australian dollar fell further below $0.690, approaching a three-month low as broad US dollar strength outweighed a rebound in domestic employment data. Australia’s economy added 40,300 jobs in May, rebounding from a revised decline of 40,600 in April and exceeding market forecasts for a 30,000 increase, while the unemployment rate edged down to 4.4% from 4.5%, as expected. The latest labor market report comes on top of Wednesday’s mixed consumer inflation figures, which have left markets divided on another interest rate hike, priced in at 50% likely by year’s end rather than at the August meeting. RBA Deputy Governor Andrew Hauser said on Wednesday that the central bank still has more work to do to bring inflation back to its 2-3% target, indicating that further policy tightening may be needed as underlying price pressures remain elevated. Meanwhile, the US dollar remained broadly stronger as investors continued to price in Federal Reserve interest rate hikes later this year.
AUD/USD edges higher following the release of Australian consumer inflation figures for May.
Bulls, however, seem hesitant amid expectations that the RBA will hold interest rates steady.
The USD climbs to an over one-year high on hawkish Fed expectations and further caps the pair.
The AUD/USD pair attracts some buyers following the release of softer Australian consumer inflation figures during the Asian session on Wednesday and reverses a part of the previous day’s slump to the 0.6900 mark, or its lowest level since early April. Spot prices currently trade around the 0.6920-0.6925 region, though any meaningful recovery seems elusive amid a bullish US Dollar (USD).
The Australian Bureau of Statistics (ABS) reported that the headline Consumer Price Index (CPI) unexpectedly eased from 4.2% YoY to 4% in May. Adding to this, the monthly CPI fell more-than-expected, by 0.7% during the reported month, following a 0.4% growth recorded in April. The softer readings, however, were offset by the Trimmed Mean CPI, which rose 0.4% on a monthly basis and picked up slightly from the 3.4% to the 3.6% YoY rate in May.
The initial market reaction, however, turns out to be muted as the US-Iran peace deal has eased concerns about the energy shock, endorsing the view that the Reserve Bank of Australia (RBA) will hold rates steady in the coming months. This, in turn, holds back traders from placing aggressive bullish bets around the Australian Dollar (USD). Apart from this, the prevalent USD buying interest further contributes to capping the upside for the AUD/USD pair.
The USD Index (DXY) has advanced to a fresh high since May 2025 amid expectations for a rate hike by the US Federal Reserve (Fed). In fact, traders upped their bets that the US central bank will raise borrowing costs by at least 25-basis-points (bps) by the year-end following the Fed’s surprisingly hawkish turn last week. This offsets the optimism over the US-Iran peace deal and might continue to underpin the USD, warranting caution for AUD/USD bulls.
To provide the best experiences, we use technologies like cookies to store and/or access device information. Consenting to these technologies will allow us to process data such as browsing behavior or unique IDs on this site. Not consenting or withdrawing consent, may adversely affect certain features and functions.
Functional
Always active
The technical storage or access is strictly necessary for the legitimate purpose of enabling the use of a specific service explicitly requested by the subscriber or user, or for the sole purpose of carrying out the transmission of a communication over an electronic communications network.
Preferences
The technical storage or access is necessary for the legitimate purpose of storing preferences that are not requested by the subscriber or user.
Statistics
The technical storage or access that is used exclusively for statistical purposes.The technical storage or access that is used exclusively for anonymous statistical purposes. Without a subpoena, voluntary compliance on the part of your Internet Service Provider, or additional records from a third party, information stored or retrieved for this purpose alone cannot usually be used to identify you.
Marketing
The technical storage or access is required to create user profiles to send advertising, or to track the user on a website or across several websites for similar marketing purposes.