The euro hovered around $1.164, close to a six-week low, amid optimism over a potential US-Iran peace deal and reduced expectations for ECB rate hikes. Investors continue to monitor Middle East developments, encouraged by the recent lack of negative signals from both sides and persistent hopes that an agreement to ease tensions and reopen the Strait of Hormuz remains possible despite recent strikes. Money markets now expect the ECB deposit rate to reach 2.6% by December, up from the current 2% but below last weekโs 2.75% projection, with an 80% chance of a rate hike next month. Meanwhile, ECB official Isabel Schnabel told Reuters the central bank should still raise interest rates in June even if a peace deal is reached, citing the scale and persistence of the energy shock.
Euro hits fresh monthly highs with Japanese Yen weakness raising intervention concerns
- EUR/JPY rallies for the fourth consecutive day and hits fresh monthly highs above 185.46.
- BoJ Ueda’s comments backing an upcoming rate hike have failed to support the Yen.
- In Europe, ECB policymakers have endorsed hopes of a tightening move in June.
The Euro (EUR) extends its rally against the Japanese Yen (JPY) for the fourth consecutive day on Wednesday, reaching above 185.46 for the first time since an alleged intervention on April 30. The JPY has failed to draw support from Bank of Japan Governor (BoJ) Uedaโs hawkish comments and is dropping against its main peers, raising concerns of another intervention.
Ueda warned about second-round effects from inflation on Wednesday and stated that central banks should not look at Oil prices in isolation, because a temporary energy shock โmay turn lasting if it alters wages, expectations and price-setting behaviour.โ
These comments feed expectations that the BoJ will tighten its monetary policy at its June 15 meeting. The positive impact on the Yen, however, was minimal, with investorsโ concerns about the Japanese economyโs exposure to high Crude prices and the comparatively low yield of Japanese Government Bonds (JGB) undermining speculative demand for the Yen.
In the Eurozone, recent comments from European Central Bank (ECB) policymakers strengthened the case for a rate hike in June and provided support for the Euro. ECB Board member Isabel Schnabel said on Tuesday that โlooking through the inflation spike is no longer an optionโ and that a June rate will be needed. Also on Tuesday, ECB Chief Economist Philip Lane showed comfortable when asked about market speculation about an upcoming rate hike at an interview with Nikkei.
EUR/GBP Price Forecasts: Euro remains on the defensive with 0.8640 capping gains
- EUR/GBP bounces up from lows sub 0.8620, but remains capped below 0.8640.
- Hawkish comments by ECB’s Lane have failed to support the Euro.
- In the UK, fading expectations of BoE hikes are weighing on GBP rallies.
The Euroย (EUR) is trading higher against theย British Poundย (GBP) on Tuesday, trimming losses after depreciating more than 1% in a bit more than a week. Euro bulls, however, remain capped below the 0.8640 area so far, which leaves the pair trading within Mondayโs range, and keeps its broader bearish trend intact.
Hawkish comments by European Central Bank (ECB) Chief Economist Philippe Lane, who endorsed market expectations of upcoming rate hikes earlier on Tuesday, have failed to provide any significant support to the Euro.ย
The Pound, on the other hand, remains fairly resilient to the UKโs uncertain political scenario, although the low yield on UK Gilts amid fading hopes of Bank of England (BoE) monetary tightening, as well as a somewhat more cautious market, are keeping Cableโs upside attempts limited.
Technical Analysis: Euro bears remain in control

EUR/GBPย trades at 0.8634, with the near-term bearish structure still in place and momentum indicators pointing to moderate bearish pressure. The Relative Strength Index (RSI) has bounced up from oversold levels, but remains within negative territory. The Moving Average Convergence Divergence (MACD) has inched back into positive territory, yet hints at a consolidative, neutral bias, rather than at a trend shift.
Initial resistance lies at a previous support in the 0.8640 area (May 21 low). Further up, the May 20 and May 19 highs, near 0.8665, and the 0.8685 area, respectively, emerge as the next bullish targets.
On the downside, a break below 2026 lows between 0.8605 and 0.8615 would bring the August 2025 low, at the 0.8600 area, and the 127.2%ย Fibonacciย extension of the May selloff, at 0.8587, into focus.
(The technical analysis of this story was written with the help of an AI tool.)
Euro Price Today
The table below shows the percentage change of Euro (EUR) against listed major currencies today. Euro was the strongest against the New Zealand Dollar.
| USD | EUR | GBP | JPY | CAD | AUD | NZD | CHF | |
|---|---|---|---|---|---|---|---|---|
| USD | 0.05% | 0.19% | 0.18% | 0.03% | 0.12% | 0.47% | 0.28% | |
| EUR | -0.05% | 0.16% | 0.13% | -0.00% | 0.10% | 0.44% | 0.22% | |
| GBP | -0.19% | -0.16% | -0.02% | -0.16% | -0.06% | 0.28% | 0.08% | |
| JPY | -0.18% | -0.13% | 0.02% | -0.14% | -0.03% | 0.29% | 0.12% | |
| CAD | -0.03% | 0.00% | 0.16% | 0.14% | 0.12% | 0.46% | 0.25% | |
| AUD | -0.12% | -0.10% | 0.06% | 0.03% | -0.12% | 0.35% | 0.14% | |
| NZD | -0.47% | -0.44% | -0.28% | -0.29% | -0.46% | -0.35% | -0.21% | |
| CHF | -0.28% | -0.22% | -0.08% | -0.12% | -0.25% | -0.14% | 0.21% |
The heat map shows percentage changes of major currencies against each other. The base currency is picked from the left column, while the quote currency is picked from the top row. For example, if you pick the Euro from the left column and move along the horizontal line to the US Dollar, the percentage change displayed in the box will represent EUR (base)/USD (quote).
EUR/JPY Price Hovers around 185.00, descending channel top
- EUR/JPY hovers near the upper boundary of the channel around 185.00.
- The 14-day Relative Strength Index sits at 49.05 near neutral, signaling that momentum has cooled from prior overbought readings.
- The initial support appears at the 50-day EMA of 184.86.
EUR/JPY inches lower after posting modest gains in the previous day, trading around 184.90 during the Asian hours on Tuesday. The currency cross holds a constructive bias as it trades above both the nine-day and 50-day Exponential Moving Averages (EMAs), clustered just below 185.00 and suggesting underlying demand on shallow pullbacks.
The 14-day Relative Strength Index (RSI) at 49.05 sits near neutral, hinting that momentum has cooled from prior overbought readings but without signalling outright downside pressure while price stays supported by these short- and medium-term EMAs.
However, the technical analysis of the daily chart indicates the EUR/JPY cross is positioned on the upper boundary of the descending channel pattern, indicating a potential bullish reversal. A sustained break above the channel would cause an emergence of a bullish bias.
Further advances above the channel would support the EUR/JPY cross to explore the region around the all-time high of 187.95, which was recorded on April 17.
On the downside, the immediate support lies at the 50-day EMA of 184.86, aligned with the nine-day EMA at 184.84. A break below these moving averages would put downward pressure on the EUR/JPY cross to navigate the region around the three-month low of 181.87, recorded on March 16, followed by a five-month low of 180.81, which was reached on February 12.
(The technical analysis of this story was written with the help of an AI tool.)
Euro Price Today
The table below shows the percentage change of Euro (EUR) against listed major currencies today. Euro was the weakest against the US Dollar.
| USD | EUR | GBP | JPY | CAD | AUD | NZD | CHF | |
|---|---|---|---|---|---|---|---|---|
| USD | 0.06% | 0.08% | 0.00% | 0.03% | 0.00% | 0.23% | 0.04% | |
| EUR | -0.06% | 0.06% | -0.06% | -0.02% | -0.02% | 0.19% | -0.02% | |
| GBP | -0.08% | -0.06% | -0.09% | -0.06% | -0.07% | 0.15% | -0.05% | |
| JPY | 0.00% | 0.06% | 0.09% | 0.02% | 0.03% | 0.22% | 0.05% | |
| CAD | -0.03% | 0.02% | 0.06% | -0.02% | 0.01% | 0.22% | 0.02% | |
| AUD | -0.00% | 0.02% | 0.07% | -0.03% | -0.01% | 0.21% | 0.01% | |
| NZD | -0.23% | -0.19% | -0.15% | -0.22% | -0.22% | -0.21% | -0.20% | |
| CHF | -0.04% | 0.02% | 0.05% | -0.05% | -0.02% | -0.01% | 0.20% |
The heat map shows percentage changes of major currencies against each other. The base currency is picked from the left column, while the quote currency is picked from the top row. For example, if you pick the Euro from the left column and move along the horizontal line to the US Dollar, the percentage change displayed in the box will represent EUR (base)/USD (quote).
EUR/USD Price Near-term tone remains bearish as 20-day EMA slopes downwards
- EUR/USD ticks lower to near 1.1633 as US forces strike at Iranian missile launcher sites.
- The US military clarified that strikes were in โself-defenseโ and not meant to dismiss the ceasefire with Iran.
- US President Trump said that negotiations with Iran are proceeding nicely.
The EUR/USD pair trades marginally lower at around 1.1633 during the Asian trading session on Tuesday. The major currency pair faces slight selling pressure as the US Dollar (USD) attacks some bids due to fears that the United States (US)-Iran negotiations could face a setback.
According to a spokesperson from the US Central Command, US forces โconducted strikes in southern Iran on Monday, which were aimed at missile launch sites and Iranian vessels aiming to deploy mines.
However, the US military has clarified that the nature of the strikes was โdefensiveโ and were not meant to end the ceasefire with Tehran.
The event has resulted in a slight recovery in the US Dollar (USD) and a decent one in oil prices. As of writing, the US Dollar Index (DXY), which tracks the Greenbackโs value against six major currencies, trades marginally higher to near 99.05.
Meanwhile, US President Donald Trump has stated that negotiations with Iran to end the conflict are โproceeding nicelyโ, Bloomberg reported.
EUR/USD technical analysis
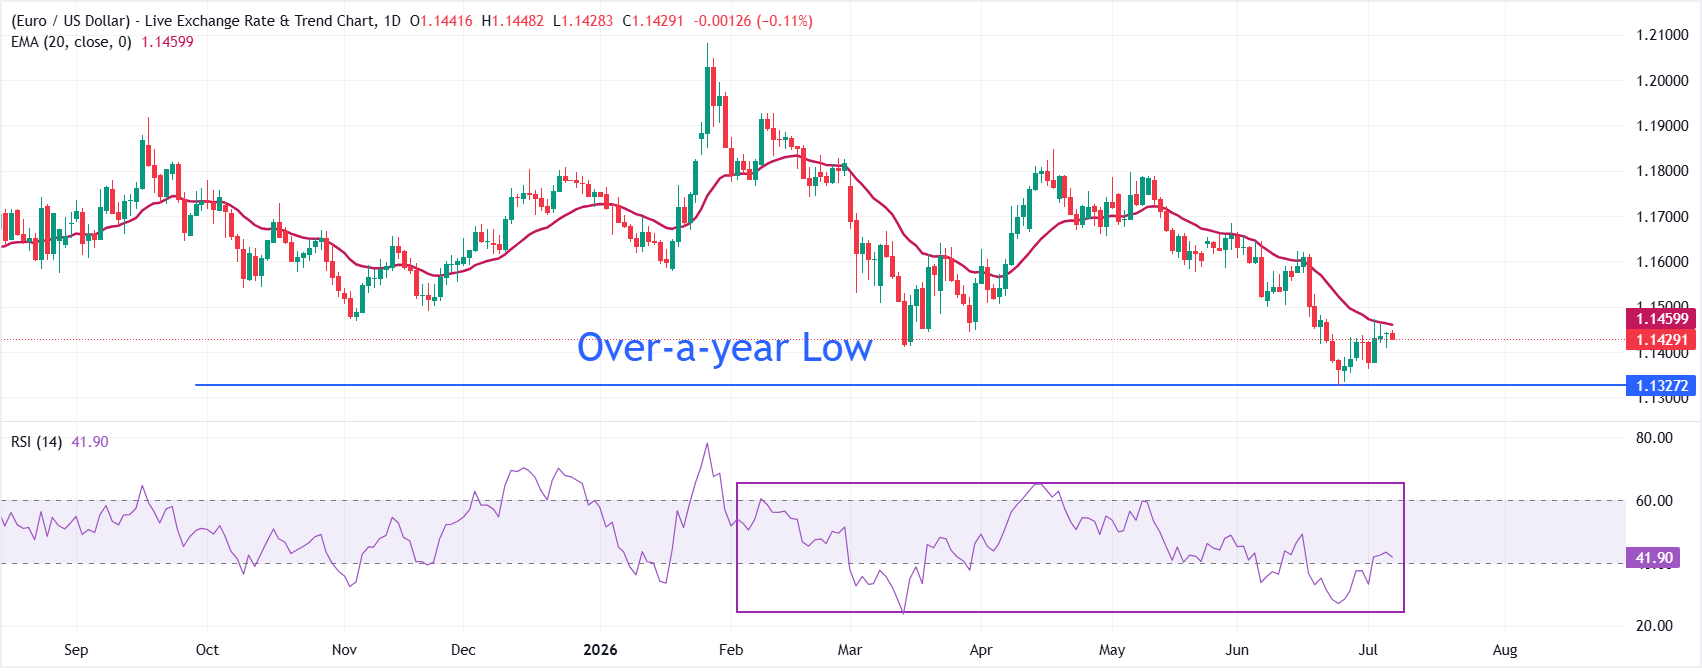
EUR/USD trades slightly lower at around 1.1635, keeping a bearish near-term bias as spot holds below the 20-day Exponential Moving Average (EMA) at 1.1667.
The pair has been grinding lower from early-month highs, and the subdued Relative Strength Index (RSI) around 45.1 hints at fading bullish momentum rather than oversold conditions, suggesting sellers retain the initiative while buyers remain cautious.
On the topside, initial resistance is defined by the 20-day EMA at 1.1667, and a daily close above this dynamic barrier would be needed to ease immediate downside pressure and open the way to a more meaningful recovery towards 1.1700. On the downside, the pair could resume its downside journey if it drops below the May 21 low of 1.1576. Key support area will be 1.1500.
Euro softens against British Pound despite ECB hike prospects
- EUR/GBP declines to near 0.8635 in Mondayโs early European session.
- ECB rate hike chance rises as Iran conflict fuels inflation.
- BoE’s Taylor sees less risk of inflation persistence than in 2022.
The EUR/GBP cross trades in negative territory around 0.8635 during the early European trading hours on Monday. Traders await the speeches from the European Central Bank (ECB) policymakers later this week, including President Christine Lagarde, for fresh impetus.
The ECB hinted that rising energy prices might push this year’s inflation forecasts upward, supporting the case for a potential interest rate hike this year. According to Reuters, the case for the ECB to raise the interest rates in June is nearly sealed, but the central bank is likely to be noncommittal about any further move, looking to temper bets for a quick follow-up step in July.
On the UKโs front, softer UK Retail Sales data and an unexpected rise in the Unemployment Rate to 5.0% have prompted traders to scale back expectations for future Bank of England (BoE) rate hikes by December. This, in turn, might weigh on the GBP and acts as a tailwind for the cross.
BoE Policymaker Alan Taylor said that an “extended hold” is likely sufficient, adding that second-round inflationary impacts are less severe than those seen during the 2022 Russia-Ukraine invasion due to a cooling domestic jobs market. Financial markets are pricing in two quarter-point increases in interest rates by the UK central bank by the end of the year.
EUR/JPY Price Tests 185.00 barrier near descending channel top
- EUR/JPY could test the immediate resistance at the upper boundary of the channel around 185.10.
- The 14-day Relative Strength Index sits near 50, hinting at neutral but stabilizing momentum.
- The initial support appears at the 50-day EMA of 184.85.
EUR/JPY extends its gains for the second successive day, trading around 184.90 during the Asian hours on Monday. The pair is holding a mild bullish bias as it consolidates above both the nine-day and 50-day Exponential Moving Averages (EMAs), which cluster just below price around the mid-184s and reinforce a nearby demand zone.
Moreover, the 14-day Relative Strength Index (RSI) sits close to the 50 line, hinting at neutral but stabilizing momentum that could allow the cross to extend gains while it remains supported by these short- and medium-term trend gauges.
However, the technical analysis of the daily chart indicates the EUR/JPY cross is still moving sideways within a descending channel pattern, indicating an ongoing bearish bias. A sustained break above the channel would offer a bearish confirmation.
The immediate resistance lies at the upper boundary of the channel around 185.10. Further advances would support the EUR/JPY cross to explore the region around the all-time high of 187.95, which was recorded on April 17.
The immediate support lies at the 50-day EMA of 184.85, followed by the nine-day EMA at 184.79. A break below these moving averages would put downward pressure on the EUR/JPY cross to navigate the region around the three-month low of 181.87, recorded on March 16, followed by a five-month low of 180.81, which was reached on February 12.
(The technical analysis of this story was written with the help of an AI tool.)
Euro Price Today
The table below shows the percentage change of Euro (EUR) against listed major currencies today. Euro was the strongest against the US Dollar.
| USD | EUR | GBP | JPY | CAD | AUD | NZD | CHF | |
|---|---|---|---|---|---|---|---|---|
| USD | -0.35% | -0.40% | -0.27% | -0.17% | -0.59% | -0.51% | -0.36% | |
| EUR | 0.35% | -0.06% | 0.07% | 0.16% | -0.27% | -0.17% | -0.03% | |
| GBP | 0.40% | 0.06% | 0.15% | 0.22% | -0.20% | -0.11% | 0.02% | |
| JPY | 0.27% | -0.07% | -0.15% | 0.09% | -0.37% | -0.29% | -0.16% | |
| CAD | 0.17% | -0.16% | -0.22% | -0.09% | -0.43% | -0.35% | -0.23% | |
| AUD | 0.59% | 0.27% | 0.20% | 0.37% | 0.43% | 0.08% | 0.21% | |
| NZD | 0.51% | 0.17% | 0.11% | 0.29% | 0.35% | -0.08% | 0.12% | |
| CHF | 0.36% | 0.03% | -0.02% | 0.16% | 0.23% | -0.21% | -0.12% |
The heat map shows percentage changes of major currencies against each other. The base currency is picked from the left column, while the quote currency is picked from the top row. For example, if you pick the Euro from the left column and move along the horizontal line to the US Dollar, the percentage change displayed in the box will represent EUR (base)/USD (quote).
EUR/USD Price Trades near 1.1650 as bulls look to extends gains above 23.6% Fibo.
- EUR/USD kicks off the new week on a positive note as US-Iran peace deal hopes undermine the USD.
- Bets for an interest rate hike by the Fed in 2026 could help limit deeper USD losses and cap spot prices.
- Acceptance above the 23.6% Fibo. backs the case for a further intraday appreciating move for the pair.
The EUR/USD pair opens with a bullish gap at the start of a new week as renewed optimism over a potential US-Iran peace deal weighs heavily on the safe-haven US Dollar (USD). Spot prices climb back closer to mid-1.1600s during the Asian session, though the broader setup warrants some caution before positioning for an extension of a modest recovery from the lowest level since April 7, around the 1.1575 region, touched last Thursday.
From a technical perspective, the EUR/USD pair is holding above the 23.6% Fibonacci retracement of the April-May downfall. Adding to this, the Relative Strength Index (RSI) is around 58 and a slightly positive Moving Average Convergence Divergence (MACD) reading hints at improving momentum. This, in turn, backs the case for a further intraday appreciating move, though hawkish US Federal Reserve (Fed) bets could limit USD losses and cap spot prices.
Hence, any subsequent move up is more likely to confront an immediate hurdle near the 38.2% Fibo. level, around the 1.1675-1.1680 region. This is followed by the 1.1710 confluence, comprising the 200-period Simple Moving Average (SMA) on the 4-hour chart and the 50% retracement. The said area should keep the near-term bias capped, above which the EUR/USD pair could target the 61.8% level around 1.1740 and the 78.6% retracement at 1.1785 en route to the cycle high at 1.1842.
On the downside, immediate support is located at the 23.6% retracement at 1.1638, with a deeper floor at the Fibonacci structural anchor around 1.1574, where a break would reopen the broader bearish phase.
(The technical analysis of this story was written with the help of an AI tool.)
EUR/USD 4-hour chart
US Dollar Price Today
The table below shows the percentage change of US Dollar (USD) against listed major currencies today. US Dollar was the strongest against the Canadian Dollar.
| USD | EUR | GBP | JPY | CAD | AUD | NZD | CHF | |
|---|---|---|---|---|---|---|---|---|
| USD | -0.32% | -0.37% | -0.25% | -0.16% | -0.57% | -0.46% | -0.35% | |
| EUR | 0.32% | -0.06% | 0.07% | 0.14% | -0.26% | -0.15% | -0.03% | |
| GBP | 0.37% | 0.06% | 0.13% | 0.20% | -0.21% | -0.08% | 0.02% | |
| JPY | 0.25% | -0.07% | -0.13% | 0.08% | -0.36% | -0.26% | -0.15% | |
| CAD | 0.16% | -0.14% | -0.20% | -0.08% | -0.42% | -0.32% | -0.21% | |
| AUD | 0.57% | 0.26% | 0.21% | 0.36% | 0.42% | 0.11% | 0.22% | |
| NZD | 0.46% | 0.15% | 0.08% | 0.26% | 0.32% | -0.11% | 0.10% | |
| CHF | 0.35% | 0.03% | -0.02% | 0.15% | 0.21% | -0.22% | -0.10% |
The heat map shows percentage changes of major currencies against each other. The base currency is picked from the left column, while the quote currency is picked from the top row. For example, if you pick the US Dollar from the left column and move along the horizontal line to the Japanese Yen, the percentage change displayed in the box will represent USD (base)/JPY (quote).


