

Technical Analysis – EUR/USD
Since mid-April, the EUR/USD pair has been trending downward. Recently, new lows were set and the March lows were broken, confirming the dominance of the supply side. We are currently observing a local upward correction. The price is approaching a key short-term resistance level at 1.1430, where, among other things, the lows from mid-March of this year are located.
This is the first zone where increased selling activity may emerge. If the 1.1430 level were to be broken through on a sustained basis, the next significant resistance level would be around 1.1466, where the upper boundary of the 1:1 geometry and the 100-period moving average—marked in blue on the chart—are located. A bounce off both the 1.1430 and 1.1466 levels could trigger another downward wave.
Only a sustained break above the 1.1466 zone could invalidate the current setup and increase the chances of a larger upward correction. For now, however, the base case scenario remains a continuation of the downtrend.
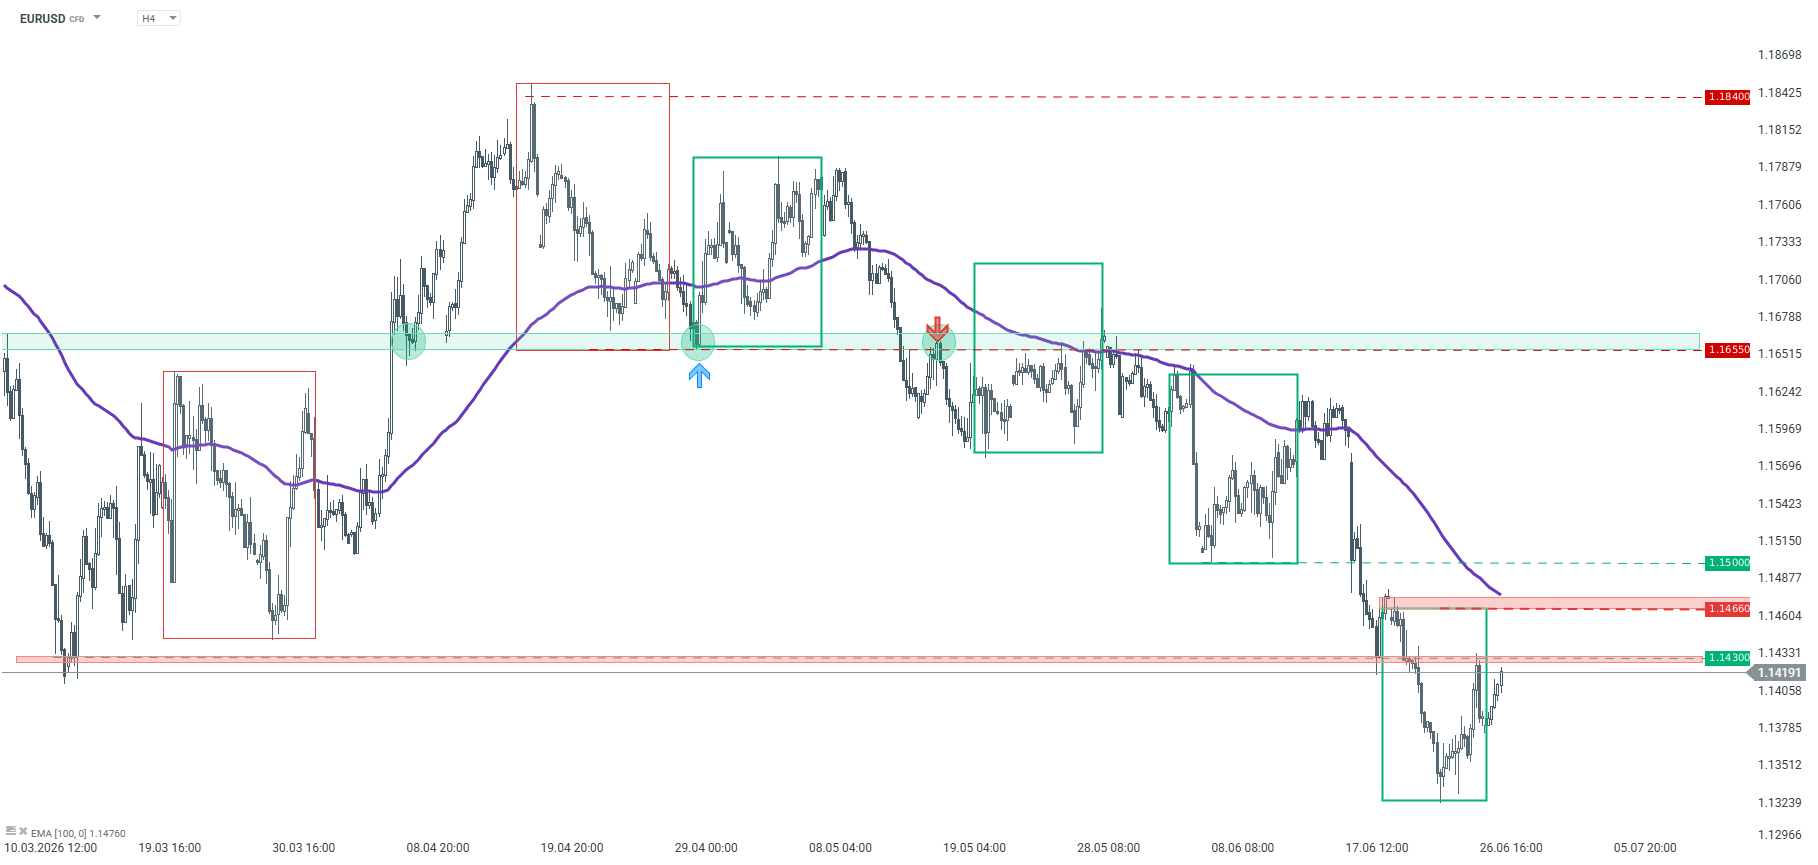
EURUSD – H4 timeframe. Source: xStation5
EUR/USD Price – Looks to extend intraday descent below 1.1400 on firmer USD
- EUR/USD meets with a fresh supply as Iran risks and hawkish Fed bets revive USD demand.
- Receding bets for a rate hike by the ECB undermine the Euro and contribute to the decline.
- The mixed technical setup warrants some caution before placing aggressive directional bets.
The EUR/USD pair attracts some sellers during the Asian session on Tuesday, snapping a three-day winning streak and stalling its recent recovery from the lowest level since May 2025 set last week. Spot prices slip below the 1.1400 mark amid a firmer US Dollar (USD) and seem vulnerable to weaken further.
Renewed US-Iran hostilities and Israeli strikes on Lebanon keep geopolitical risk premiums in play. This, along with elevated expectations of Federal Reserve (Fed) interest rate hikes, assists the safe-haven USD to regain positive traction following a three-day downfall. Adding to this, reduced bets for a rate hike by the European Central Bank (ECB) in 2026 exert some downward pressure on the EUR/USD pair.
From a technical perspective, spot prices maintain a bearish outlook below the 200-period Exponential Moving Average (EMA) on the 4-hour chart and the 1.1500 psychological mark. Moreover, momentum indicators suggest that the downside pressure is moderating but not yet strong enough to challenge overhead resistance. In fact, the Relative Strength Index (RSI) near 49.1 hints at neutral bias after recovering from oversold territory.
Adding to this, the Moving Average Convergence Divergence (MACD) is marginally positive, with the line above zero and a modestly positive profile. Hence, any subsequent decline below the 1.1380 immediate support is more likely to attract some buyers near the 1.1335 zone. The latter should act as a key pivotal point, which, if broken decisively, will be seen as a fresh trigger for bearish traders and pave the way for deeper losses.
On the topside, initial resistance is clearly defined by the 1.1500 psychological mark and the 200-period EMA at 1.1538, which acts as the primary cap on any recovery attempts. The EUR/USD pair would need to reclaim the said barriers to ease the broader bearish tone and shift the technical picture toward a more constructive outlook.
(The technical analysis of this story was written with the help of an AI tool.)
EUR/USD 4-hour chart
US Dollar Price Today
The table below shows the percentage change of US Dollar (USD) against listed major currencies today. US Dollar was the strongest against the Australian Dollar.
| USD | EUR | GBP | JPY | CAD | AUD | NZD | CHF | |
|---|---|---|---|---|---|---|---|---|
| USD | 0.21% | 0.18% | 0.15% | 0.15% | 0.24% | 0.01% | 0.20% | |
| EUR | -0.21% | -0.03% | -0.09% | -0.10% | 0.03% | -0.21% | -0.02% | |
| GBP | -0.18% | 0.03% | -0.04% | -0.04% | 0.08% | -0.16% | 0.00% | |
| JPY | -0.15% | 0.09% | 0.04% | 0.00% | 0.10% | -0.11% | 0.05% | |
| CAD | -0.15% | 0.10% | 0.04% | -0.01% | 0.08% | -0.13% | 0.04% | |
| AUD | -0.24% | -0.03% | -0.08% | -0.10% | -0.08% | -0.20% | -0.04% | |
| NZD | -0.01% | 0.21% | 0.16% | 0.11% | 0.13% | 0.20% | 0.15% | |
| CHF | -0.20% | 0.02% | -0.00% | -0.05% | -0.04% | 0.04% | -0.15% |
The heat map shows percentage changes of major currencies against each other. The base currency is picked from the left column, while the quote currency is picked from the top row. For example, if you pick the US Dollar from the left column and move along the horizontal line to the Japanese Yen, the percentage change displayed in the box will represent USD (base)/JPY (quote).

- EUR/JPY weakens to near 184.85 in Tuesday’s early European session.
- Japan’s Katayama said the government was ready to take appropriate action against excessive currency moves.
- Traders reduce their bets on the ECB rate hikes this year.
The EUR/JPY cross loses ground to around 184.85 during the early European trading hours on Tuesday. The Japanese Yen (JPY) rebounds against the Euro (EUR) as traders on alert for possible intervention from Japanese authorities. Germany’s Retail Sales and inflation data will be published later in the day.
Japanese Finance Minister Satsuki Katayama on Tuesday reiterated the authorities stood ready to respond appropriately at any time. Meanwhile, Chief Cabinet Secretary Minoru Kihara said that the Japanese government will work to build an economy less vulnerable to foreign-exchange volatility while remaining prepared to intervene in currency markets if necessary. Kihara also declined to comment on the Japanese Yen’s current level.
“It’s a question of when, not if, the Ministry of Finance (MOF) intervenes again to support the yen,” said Carol Kong, currency strategist at Commonwealth Bank of Australia.
ECB President Christine Lagarde said in a speech opening her institution’s annual retreat on Monday that Europe is becoming less vulnerable to outside shocks thanks to a better financial framework and progress on the green transition. Lagarde emphasized that tensions subside amid a peace deal, which is “far from assured.” Policymakers must decide whether further monetary tightening is needed.
Markets have pared expectations for future ECB rate increases as energy prices retreat. Oxford Economics and Capital Economics expect the ECB won’t raise the interest rates further, though investors are still pricing one more quarter-point move, which would bring the deposit rate to 2.50%.
Euro softens against Japanese Yen as traders on alert for possible intervention
- EUR/JPY weakens to near 184.85 in Tuesday’s early European session.
- Japan’s Katayama said the government was ready to take appropriate action against excessive currency moves.
- Traders reduce their bets on the ECB rate hikes this year.
The EUR/JPY cross loses ground to around 184.85 during the early European trading hours on Tuesday. The Japanese Yen (JPY) rebounds against the Euro (EUR) as traders on alert for possible intervention from Japanese authorities. Germany’s Retail Sales and inflation data will be published later in the day.
Japanese Finance Minister Satsuki Katayama on Tuesday reiterated the authorities stood ready to respond appropriately at any time. Meanwhile, Chief Cabinet Secretary Minoru Kihara said that the Japanese government will work to build an economy less vulnerable to foreign-exchange volatility while remaining prepared to intervene in currency markets if necessary. Kihara also declined to comment on the Japanese Yen’s current level.
“It’s a question of when, not if, the Ministry of Finance (MOF) intervenes again to support the yen,” said Carol Kong, currency strategist at Commonwealth Bank of Australia.
ECB President Christine Lagarde said in a speech opening her institution’s annual retreat on Monday that Europe is becoming less vulnerable to outside shocks thanks to a better financial framework and progress on the green transition. Lagarde emphasized that tensions subside amid a peace deal, which is “far from assured.” Policymakers must decide whether further monetary tightening is needed.
Markets have pared expectations for future ECB rate increases as energy prices retreat. Oxford Economics and Capital Economics expect the ECB won’t raise the interest rates further, though investors are still pricing one more quarter-point move, which would bring the deposit rate to 2.50%.
EUR/JPY Price – Gains above 184.00, but bearish technical bias persists below 100-day SMA
- EUR/JPY gains traction around 184.20 in Monday’s European session.
- The negative outlook for the cross prevails under the key 100-day SMA, with bearish RSI momentum.
- The initial support level is seen at 183.55; the first upside barrier to watch is 184.55.
The EUR/JPY cross trades in positive territory near 184.20 during the early European session on Monday. However, the potential upside for the cross might be limited as traders are nervous about a fragile US-Iran ceasefire.
The US and Iran traded fresh barbs over the weekend before they agreed to halt attacks and meet in Qatar on Tuesday. Uncertainty surrounding US-Iran talks could weigh on the riskier assets, such as the Euro (EUR) against the Japanese Yen (JPY).
Furthermore, mounting fears of Japanese market intervention could underpin the JPY. Japan’s Chief Cabinet Secretary Minoru Kihara said last week that officials will take appropriate action against the foreign exchange moves if needed.
The European Central Bank’s (ECB) annual forum this week will be closely watched as traders continue to monitor evolving central bank policies amid lower oil prices and stock market volatility. ECB President Christine Lagarde will open the forum on Monday. Any hawkish remarks from policymakers could help limit the EUR’s losses in the near term.
Technical Analysis:
In the daily chart, EUR/JPY holds a bearish near-term bias as the pair holds beneath the 100-day moving average and the Bollinger middle band. Price action remains capped by this clustered dynamic resistance, while the Relative Strength Index (14) at 42.65 stays below the neutral 50 line, hinting at fading bullish momentum rather than outright oversold conditions.
On the downside, initial support emerges at the lower Bollinger band around 183.55, which marks the first notable demand zone that could slow the current pullback. A clear break below this band would likely expose deeper corrective territory, while on the topside, a daily close back above the 100-day moving average at 184.55 would be needed to ease immediate pressure and open the way toward the Bollinger middle band near 184.95 and, later, the upper band at 186.35.
Euro steadies below 1.1400, Lagarde speech in spotlight
- EUR/USD trades flat around 1.1385 in Monday’s early European session.
- The US and Iran agreed to halt attacks and meet in Doha on Tuesday.
- Traders brace for the ECB’s Lagarde speech on Monday.
The EUR/USD pair holds steady near 1.1385 during the early European trading hours on Monday. Traders continue to assess the developments surrounding talks to end the US war with Iran. The European Central Bank’s (ECB) annual forum and the US June employment data will be the highlights later this week.
CNN reported on Monday that a US official said that the US and Iran will stand down for now after both sides traded fire near the Strait of Hormuz. Two countries plan to meet on Tuesday in Doha, Qatar.
Iran’s Foreign Minister Abbas Araghchi stated that responsibility for the Strait of Hormuz lies solely with Tehran and warned that any attempt to bypass its preferred route in the waterway will cause “tension and escalation.”
The Middle East tensions have continued to stoke inflation pressures, while a surprisingly hawkish debut from Kevin Warsh as a new Federal Reserve (Fed) chair earlier in the month has reversed market expectations for US rate cuts this year. This, in turn, could underpin the US Dollar (USD) against the Euro (EUR) in the near term.
ECB President Christine Lagarde will open the forum on Monday. Her speech could offer some hints about evolving central bank policies amid lower oil prices and stock market volatility. Any hawkish remarks from policymakers could provide some support to the shared currency.
Fed’s Kashkari says AI will force a rate hike; EURUSD and USD reverse early moves
s now losing buying momentum. In the second half of the session, the momentum has clearly shifted to the sellers. The US100, on the other hand, reflects relative strength—the index has gradually lost its downward momentum and is stabilizing in the second half of the day, ignoring some of the negative market signals.
The main topic of the day in the tech world is the potential delay of OpenAI’s IPO — reports in the NYT about the debut being pushed back to next year (in part due to SpaceX’s poor performance following its IPO) have hit the entire semiconductor sector hard. Micron, AMD, and Intel are down about 2% each, while Oracle is down more than 1%. The ripple effect was particularly evident in Asia: SoftBank, a key investor in OpenAI, plummeted by more than 12% , the Nikkei 225 lost 4.15% , and South Korea’s Kospi plunged by 5.81% .
JPMorgan warns outright that the IPO delay “could slow the pace of spending on AI infrastructure.” On the other hand, however, postponing the launch date will keep market expectations alive, which, paradoxically, could have a positive effect on market returns given the narrative being built and the promises of increasingly advanced AI development.
The main risk factor on the geopolitical front, however, is the U.S.-Iran situation. Trump reported on Truth Social that Iran had launched at least four kamikaze drones at ships in the Strait of Hormuz. One struck the deck of a large container ship—the vessel sustained damage but continued its voyage. The other three drones were shot down. Trump called the incident a “stupid violation of the ceasefire agreement.” The Strait of Hormuz is a key route for about 20% of global oil supplies—any escalation in this region immediately catches the attention of commodity markets.
At the same time, Fed’s Kashkari spoke out on inflation—according to him, the labor market is not currently a source of inflation. Price pressures are being driven by the supply side, and one of the factors he mentioned is… the expansion of AI infrastructure. Kashkari of the Fed said that the development of artificial intelligence likely means the Fed will have to raise interest rates.
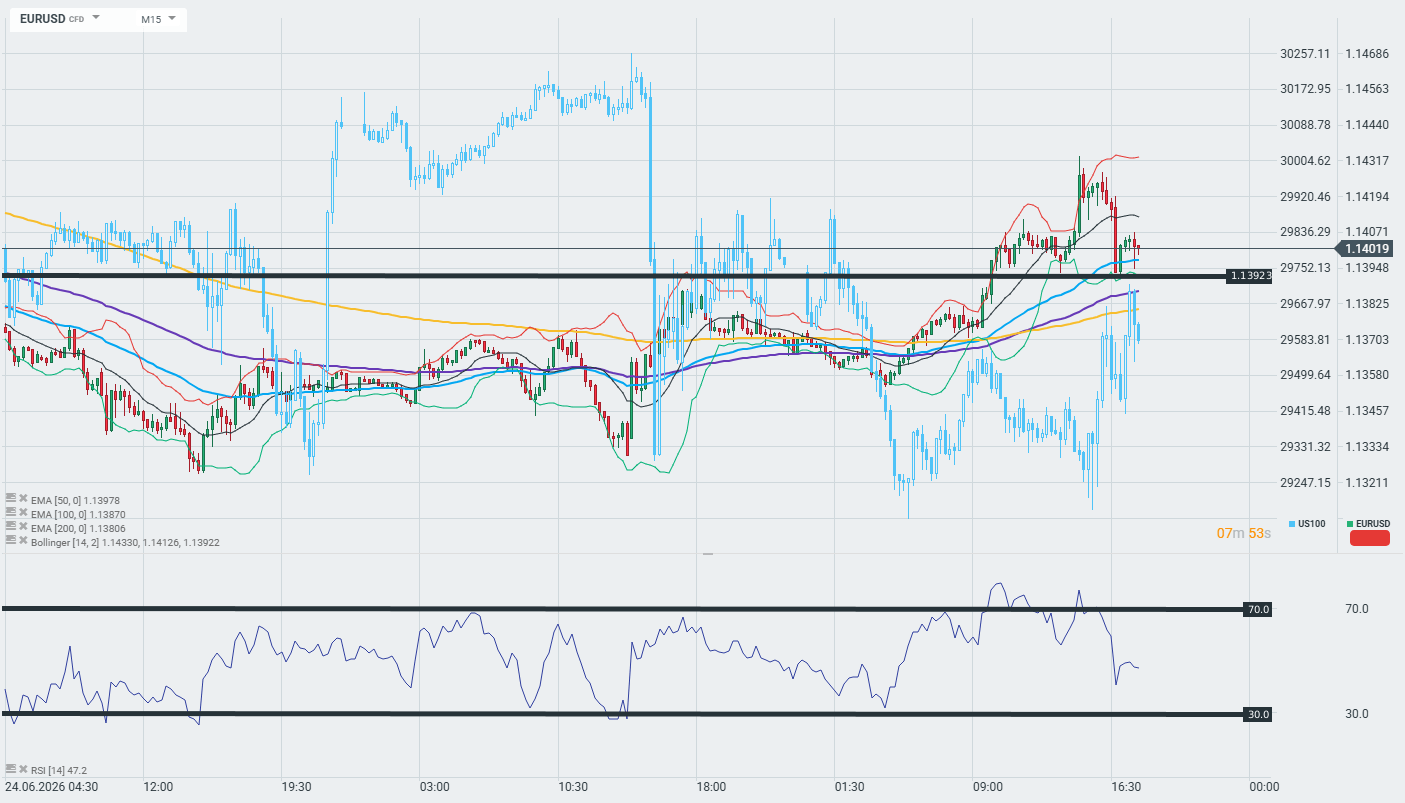
Source: xStation
