

The South Korean won strengthened to around 1,485 per dollar, advancing for a fifth straight session and reaching its highest level since mid-May, after the Bank of Korea raised interest rates. The central bank lifted its benchmark interest rate by 25 basis points to 2.75%, as widely expected, marking its first increase since early 2023 as policymakers sought to curb persistent inflation and support the currency following months of depreciation. The decision marked the start of a new tightening cycle, with investors assessing whether policymakers will deliver further rate increases if inflation remains elevated. Meanwhile, gains in the won were limited as fresh US strikes on Iran boosted demand for the safe-haven US dollar and heightened concerns over potential disruptions to global energy supplies. Broader market sentiment also remained fragile as renewed volatility in technology shares weighed on risk appetite.

Chart of the Day – What is next for July’s strongest currency?
The geopolitically turbulent start of July has brought a strengthening of commodity currencies (among them, the Norwegian krone). However, the top of the G10 list is occupied by the New Zealand dollar, which may come as a surprise to some. The currency has strengthened by nearly 2.5% against the dollar over the past two weeks.
What lies behind such a significant move?
Fundamental to this, as is often the case, were the actions of the central bank. On 8 July, the Reserve Bank of New Zealand raised the main interest rate by 25 bps, lifting it to 2.5%. This was the first rate hike in New Zealand in over three years. The key, however, was not just the decision to raise rates (which was largely priced in by markets) but the communication that accompanied it.
- The decision was made unanimously by the committee. At the previous meeting in May, there was a 3-3 split in votes, and the balance was only tipped by the new governor, Anna Breman.
- The RBNZ Chief Economist, Paul Conway, drew clear attention to pro-inflationary risks resulting from the escalation of tensions in the Middle East.
- The Bank stated in its communiqué that “while further interest rate hikes seem likely at upcoming meetings, their timing is highly uncertain.”
- RBNZ research suggests that after a long period of elevated inflation, New Zealand companies are significantly more inclined to immediately pass costs on to consumers and less willing to lower prices when costs fall.
As a result, the market’s baseline scenario is another hike in September and another upward move in October or December. This would bring the main interest rate (cash rate) to 3%, which the bank currently defines as the neutral level.
What lies ahead? There is still plenty of time until September.
- In the meantime, the Q2 inflation report will be published. The consensus assumes a significant increase in the headline indicator, most likely to around 4%.
- After the manufacturing PMI rose to its highest level since 2021 (59.7), data on production could prove particularly interesting.
Data from China, New Zealand’s largest trading partner, which absorbs nearly 25% of the country’s total exports (mainly dairy, meat, wood, and fruit), will also be significant.
- Stronger economic data from the Middle Kingdom usually means greater demand for products imported from New Zealand.
- In this context, the readings published today are not particularly optimistic. GDP dynamics fell to the lowest level since 2022 (+4.3% year-on-year).
- The Asian giant is burdened by a property market crisis, weak domestic demand, and a decline in investment (down 5.7% year-on-year in the first half of the year).
The strength of the dollar itself, which is awaiting further news from the geopolitical front and the September FOMC decision, could, of course, also prove key.
- The market does not really expect a hike, so the focus will be on communication. Kevin Warsh remains enigmatic, so upcoming conferences may attract particular attention.
Technical Analysis Figure 1: NZDUSD [D1] (08.07.2025 – 15.07.2026)
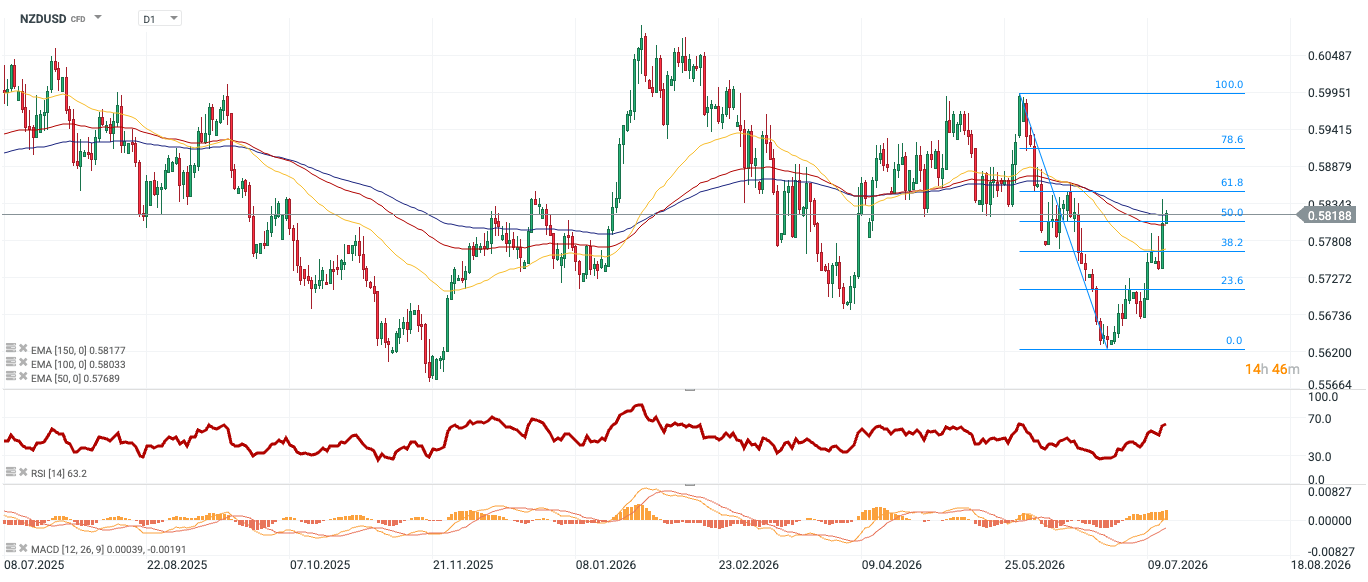
Source: xStation, 15.07.2026 The NZDUSD pair has broken out of the downtrend and is currently testing key support levels. The price has breached the 50% Fibonacci retracement and is hovering around the 150-day moving average. The upward momentum is also suggested by the MACD indicator. The Relative Strength Index (RSI) has reached 63.4, which confirms a clear advantage for market bulls, while at the same time indicating that the market is not yet in the extreme overbought zone (above 70).

EUR/USD Price – Bulls remain cautious below 23.6% Fibo. and 1.1470 hurdle
- EUR/USD trades with a positive bias for the second straight day amid a softer US Dollar.
- Escalating US-Iran tensions keep geopolitical risk premiums in play and support the USD.
- The technical setup also warrants some caution before placing bullish bets on the pair.
The EUR/USD pair attracts some dip-buyers following the previous day’s pullback from the 1.1460-1.1470 horizontal resistance, though it remains confined within a multi-week-old range. Spot prices trade around the 1.1435-1.1440 region during the Asian session on Wednesday, up for the second straight day amid modest US Dollar (USD) weakness.
Softer-than-expected US consumer inflation data, released on Tuesday, forced traders to scale back their expectations of Federal Reserve (Fed) rate hikes, which keeps the USD bulls depressed and acts as a tailwind for the EUR/USD pair. However, inflation risks stemming from elevated crude oil prices and Fed Chair Kevin Warsh’s price stability commitment, along with escalating US-Iran tensions, should limit deeper USD losses and cap the currency pair.
The EUR/USD pair has been struggling to find acceptance and build on its strength beyond the 23.6% Fibonacci retracement level of the April-June downfall. Adding to this, momentum indicators hint at scope for corrective upticks rather than a clear trend reversal. The Moving Average Convergence Divergence (MACD) indicator has turned positive, and the Relative Strength Index (RSI) around 56 suggests improving but still moderate bullish momentum.
This further warrants some caution before placing aggressive bullish bets on the EUR/USD pair and positioning for an extension of the recent recovery from the 1.1325 region, or the year-to-date low touched in June. The subsequent resistance below the 23.6% Fibo. aligns at the 200-period Simple Moving Average (SMA) on the 4-hour chart, near 1.1490, with the 38.2% retracement near 1.1523 and the 50.0% level around 1.1585 acting as the next relevant hurdles.
On the downside, the main structural support emerges at the Fibonacci anchor close to 1.1323, and a clear break under this floor would likely reinforce the broader bearish outlook for the EUR/USD pair.
EUR/USD 4-hour chart
US Dollar Price Today
The table below shows the percentage change of US Dollar (USD) against listed major currencies today. US Dollar was the strongest against the Swiss Franc.
| USD | EUR | GBP | JPY | CAD | AUD | NZD | CHF | |
|---|---|---|---|---|---|---|---|---|
| USD | -0.16% | -0.05% | -0.08% | -0.10% | -0.17% | -0.03% | -0.00% | |
| EUR | 0.16% | 0.05% | 0.07% | 0.05% | -0.06% | 0.07% | 0.15% | |
| GBP | 0.05% | -0.05% | 0.02% | -0.01% | -0.11% | 0.02% | 0.09% | |
| JPY | 0.08% | -0.07% | -0.02% | -0.03% | -0.11% | 0.03% | 0.06% | |
| CAD | 0.10% | -0.05% | 0.01% | 0.03% | -0.07% | 0.00% | 0.10% | |
| AUD | 0.17% | 0.06% | 0.11% | 0.11% | 0.07% | 0.11% | 0.16% | |
| NZD | 0.03% | -0.07% | -0.02% | -0.03% | -0.01% | -0.11% | 0.07% | |
| CHF | 0.00% | -0.15% | -0.09% | -0.06% | -0.10% | -0.16% | -0.07% |
The heat map shows percentage changes of major currencies against each other. The base currency is picked from the left column, while the quote currency is picked from the top row. For example, if you pick the US Dollar from the left column and move along the horizontal line to the Japanese Yen, the percentage change displayed in the box will represent USD (base)/JPY (quote).

British Pound advances as US Dollar remains subdued following inflation data
- GBP/USD rises as the US Dollar sustains losses from soft inflation data, raising expectations for a less hawkish Fed.
- US June CPI inflation slowed to 3.5% year-over-year from May’s 4.2%, comfortably beating the market consensus of 3.8%.
- The British Pound gains as energy-driven inflation worries push investors to price in aggressive BoE rate hikes.
GBP/USD rises for the second consecutive day, trading around 1.3400 during the Asian hours on Wednesday. The pair appreciates as the US Dollar (USD) holds losses following softer-than-expected US inflation data, fueling hopes that the US Federal Reserve (Fed) might adopt a less hawkish monetary stance.
The US Consumer Price Index (CPI) inflation eased to 3.5% year-over-year in June, dropping from a three-year high of 4.2% in May and coming in well below the market consensus of 3.8%. On a monthly basis, headline CPI actually declined by 0.4% in June, a notable shift from the 0.5% increase recorded in May.
However, the downside of the Greenback could be restrained amid rising safe-haven demand following renewed tensions between the United States (US) and Iran. The renewed Hormuz tensions drive up oil prices, fueling inflation concerns and prolonging higher interest rates by the Federal Reserve (Fed). The CME FedWatch Tool indicates that markets are now pricing in a roughly 50% chance of a Federal Reserve rate hike in September.
The British Pound (GBP) strengthens as Middle East tensions fuel inflation worries from rising energy prices, prompting investors to price in aggressive Bank of England (BoE) rate hikes. Markets now heavily anticipate two increases in 2026, with a September hike fully priced in.

Offshore Yuan Hits 1-Month High
The offshore yuan strengthened to around 6.76 per dollar on Wednesday, extending gains from the previous session to its strongest level in a month, supported by a weaker US dollar even as China’s economic data pointed to uneven growth. The greenback remained under pressure after softer-than-expected US inflation data reduced expectations for a near-term Federal Reserve rate hike, with traders now pricing in a pause at the July meeting despite ongoing oil-driven inflation risks. Meanwhile, China’s economy expanded 4.3% year-on-year in Q2, marking the weakest growth since Q4 2022 and falling below Beijing’s 2026 target range of 4.5%–5.0%. Fixed-asset investment declined 5.7% in the first half, worse than both market expectations and the January–May decline. However, signs of resilience emerged as industrial production accelerated to a three-month high of 5.3% in June, retail sales rebounded 1%, and the urban unemployment rate eased to a one-year low of 5.0%.

AUD/USD Price Tests nine-day EMA barrier near 0.6950
- AUD/USD may decline toward a nearly six-month low of 0.6833.
- The 14-day Relative Strength Index around 40 signals the asset remains under bearish pressure.
- The pair is testing the immediate barrier at the nine-day EMA of 0.6932.
AUD/USD edges higher after posting 0.5% losses in the previous day, trading around 0.6930 during the Asian hours on Tuesday. The technical analysis of the daily chart shows the pair remaining within the descending channel pattern, suggesting a prevailing bearish bias.
The AUD/USD pair is holding a bearish near-term bias as it remains under both the nine-day and 50-day Exponential Moving Averages (EMAs). The pair is attempting to stabilise after recent losses, but the 14-day Relative Strength Index (RSI) around 40 suggests only modest recovery momentum, hinting that any rebound may stay capped while price trades below these clustered moving-average barriers.
The AUD/USD pair may fall toward a nearly six-month low of 0.6833, recorded on March 30. Further declines would expose the lower boundary of the descending channel around 0.6770.
On the upside, the AUD/USD is testing the immediate barrier at the nine-day EMA of 0.6932, followed by the upper boundary of the descending channel around 0.6960. A break above the channel would cause a bullish emergence and support the pair to test the 50-day EMA of 0.7011.
Australian Dollar Price Today
The table below shows the percentage change of Australian Dollar (AUD) against listed major currencies today. Australian Dollar was the strongest against the US Dollar.
| USD | EUR | GBP | JPY | CAD | AUD | NZD | CHF | |
|---|---|---|---|---|---|---|---|---|
| USD | -0.11% | -0.10% | -0.13% | -0.18% | -0.17% | -0.75% | -0.16% | |
| EUR | 0.11% | 0.00% | 0.00% | -0.07% | -0.07% | -0.63% | -0.05% | |
| GBP | 0.10% | -0.00% | 0.00% | -0.06% | -0.05% | -0.64% | -0.05% | |
| JPY | 0.13% | 0.00% | 0.00% | -0.06% | -0.07% | -0.65% | -0.07% | |
| CAD | 0.18% | 0.07% | 0.06% | 0.06% | -0.01% | -0.57% | 0.01% | |
| AUD | 0.17% | 0.07% | 0.05% | 0.07% | 0.00% | -0.57% | 0.03% | |
| NZD | 0.75% | 0.63% | 0.64% | 0.65% | 0.57% | 0.57% | 0.59% | |
| CHF | 0.16% | 0.05% | 0.05% | 0.07% | -0.01% | -0.03% | -0.59% |
The heat map shows percentage changes of major currencies against each other. The base currency is picked from the left column, while the quote currency is picked from the top row. For example, if you pick the Australian Dollar from the left column and move along the horizontal line to the US Dollar, the percentage change displayed in the box will represent AUD (base)/USD (quote).
Offshore Yuan Holds Decline
The offshore yuan held its decline around 6.78 per dollar on Tuesday as investors balanced expectations of slower economic growth against stronger-than-expected trade data. China’s economy is projected to expand 4.5% year-on-year in Q2 on Wednesday, down from 5% in Q1 and near the lower end of Beijing’s 2026 growth target of 4.5%–5%, amid weak consumer spending, a prolonged property downturn, and subdued private investment. Meanwhile, June trade data pointed to solid external demand. Exports surged 27% year-on-year to a record USD 412.4 billion, while imports jumped 36% to an all-time high of USD 286.8 billion, both exceeding forecasts. As a result, the trade surplus widened to USD 125.6 billion. Strong global demand for AI-related hardware and higher semiconductor prices continued to support Asia’s trade flows, helping cushion the impact of domestic economic weakness. Investors are now awaiting this month’s Politburo meeting for clues on potential policy measures to bolster growth.
Kiwi Dollar Rises to 4-Week High
The New Zealand dollar rose to around $0.577 on Tuesday, its highest level in four weeks, following remarks from RBNZ Chief Economist Paul Conway. Conway warned that inflation may not ease as quickly as the central bank expects, raising the possibility of further interest rate hikes. Last week, the RBNZ lowered its forecast for third-quarter inflation to 3.3% from 4.3%, citing lower fuel prices following the interim US-Iran agreement. However, oil prices have rebounded in recent days as renewed fighting in the Middle East fueled supply concerns. The RBNZ’s hawkish stance last week, combined with a series of upbeat domestic economic data, has led markets to price in two additional rate hikes this year. However, the kiwi’s gains were limited as the standoff between the US and Iran intensified, with President Trump reimposing a US naval blockade of Iranian ports and announcing a 20% charge on all cargo shipped through the Strait of Hormuz, dampening risk appetite.
