Currency Hedger No Comments

AUD/USD Price Forecast: Rallies to June 2022 high, closer to mid-0.7200s on weaker USD

  • AUD/USD attracts strong follow-through buyers amid a combination of supporting factors.
  • US-Iran peace deal hopes and receding hawkish Fed expectations weigh heavily on the USD.
  • The RBAโ€™s hawkish outlook benefits the Aussie and contributes to the positive momentum.

Theย AUD/USDย pair is seen building on the previous day’s bounce from the 0.7135 region, or the weekly low, and gaining strong follow-through positive traction for the second straight day on Wednesday. The momentum lifts spot prices to a fresh high since June 2022, closer to mid-0.7200s, during the Asian session, and is sponsored by a broadly weaker US Dollar (USD).

The incoming headlines fuel optimism over a potential US-Iran peace deal and boost investors’ confidence, undermining the safe-haven buck and benefiting the risk-sensitive Aussie. Furthermore, sliding Crude Oil prices ease inflationary concerns and temper bets for a rate hike by the USย Federal Reserveย (Fed). This exerts additional pressure on the USD, which, along with the Reserve Bank of Australia’s (RBA) hawkishย outlook, contributes to the bid tone surrounding the AUD/USD pair.

From a technical perspective, spot prices hold a bullish near-term bias following the recent resilience below the 100-period Exponential Moving Average (EMA) on the 4-hour chart. The said support is pegged at 0.7145, which now underpins the broader upturn from recent lows. Moreover, a firm Relative Strength Index (RSI) around 65 suggests strong but maturing upside momentum, while the positive Moving Average Convergence Divergence (MACD) reading hints that buyers still retain control.

This, in turn, suggests that any corrective pullback might still be seen as a buying opportunity near the 100-period EMA on H4, at 0.7145, as the broader structure remains constructive above this zone. A sustained break beneath this moving average would weaken the current bullish tone and open the door to a deeper corrective phase on the four-hour timeframe.

(The technical analysis of this story was written with the help of an AI tool.)

AUD/USD 4-hour chart

Chart Analysis AUD/USD

US Dollar Price Today

The table below shows the percentage change of US Dollar (USD) against listed major currencies today. US Dollar was the strongest against the Japanese Yen.

USDEURGBPJPYCADAUDNZDCHF
USD-0.20%-0.18%-0.06%-0.14%-0.69%-0.75%-0.20%
EUR0.20%0.02%0.15%0.07%-0.48%-0.57%0.00%
GBP0.18%-0.02%0.13%0.06%-0.50%-0.57%0.00%
JPY0.06%-0.15%-0.13%-0.09%-0.64%-0.72%-0.12%
CAD0.14%-0.07%-0.06%0.09%-0.55%-0.62%-0.04%
AUD0.69%0.48%0.50%0.64%0.55%-0.07%0.50%
NZD0.75%0.57%0.57%0.72%0.62%0.07%0.57%
CHF0.20%-0.00%-0.00%0.12%0.04%-0.50%-0.57%

The heat map shows percentage changes of major currencies against each other. The base currency is picked from the left column, while the quote currency is picked from the top row. For example, if you pick the US Dollar from the left column and move along the horizontal line to the Japanese Yen, the percentage change displayed in the box will represent USD (base)/JPY (quote).

Currency Hedger No Comments

Trade of The Day – EUR/GBP

Facts: EURGBP bounced off the 1:1 structure at 0.8647 The pair is trading below the 100-period exponential moving average foram H1 interval Recommendation: Trade: Short position on EURGBP at market price Target: 0.8620, 0.8611 Stop Loss: 0.8655

Opinion: EURGBP has been trading in a downward trend recently. Taking a look at the H1 internal, we can see that the pair bounced off the key resistance, signaling a potential bearish trend resumption. The resistance at 0.8647 is marked with the upper limit of 1:1 structure. In addition the price sits below the 100- period moving average. According to the Overbalance strategy, as long as the price sits below the 0.8647 resistance, one should expect the price to continue to fall. Taking this into account, we recommend going short EURGBP at market price with two targets: 0.8620 and 0.8611. We also recommend placing a stop loss at 0.8655. Source: xStation5

Currency Hedger No Comments

Currency Talk – AUDCAD, GBPUSD, AUDUSD

Key takeaways

  • What is the technical outlook for AUD/CAD, GBP/USD and AUD/USD?

This analysis from the Overbalance series aims to identify three financial instruments, analysed primarily on the daily/four-hour timeframe (D1/H4). The analysis utilises only the Overbalance methodology, which helps to identify points where a trend may continue or where a reversal may occur. Todayโ€™s analysis covers three instruments, assessed solely in terms of 1:1 correction structures. AUDCAD After several tests, the AUDCAD exchange rate has broken through the key support level at 0.9755, which, according to the Overbalance methodology, paves the way for a deeper downward correction. A potential target for the downside is the 0.9610 level, where the lower boundary of the large 1:1 pattern is located. Currently, the 0.9755 level is acting as resistance, and only a sustained return of the price above this zone could restore the bullish scenario.

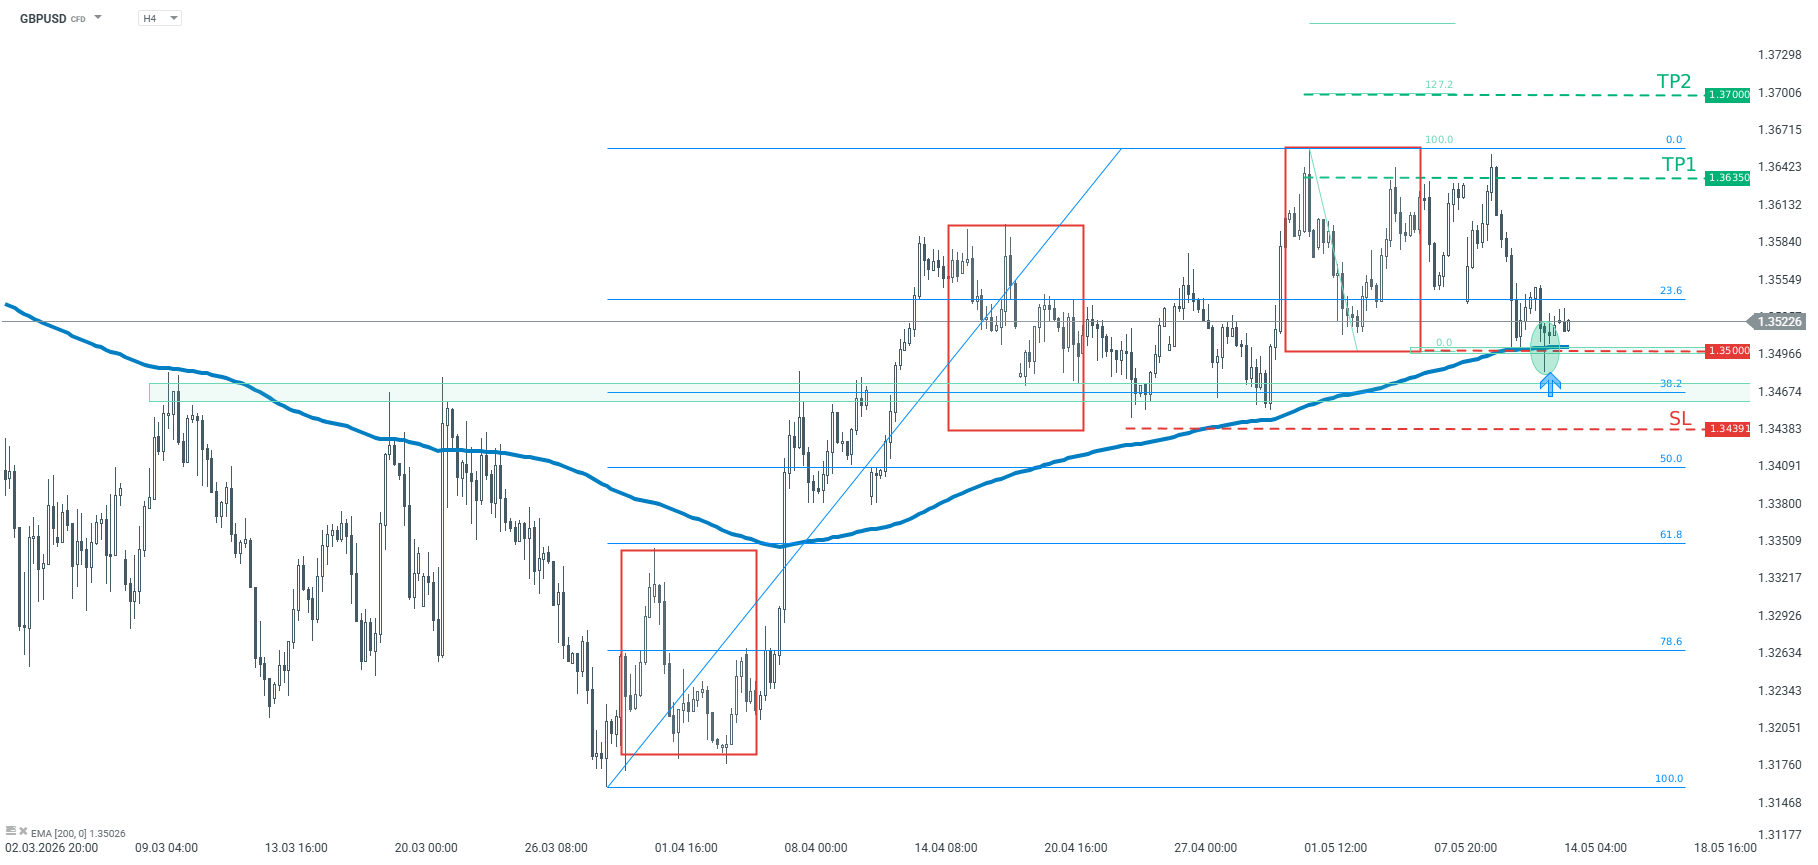
AUDCAD โ€“ H4 timeframe. Source: xStation GBPUSD Since the beginning of April, GBPUSD has been trading within a local uptrend, supported by the 1:1 bullish pattern highlighted in green. The key support level remains at 1.3488. A potential bounce at this point could lead to the generation of another upward impulse. Conversely, a break below this level would open the way for a decline towards 1.3360, where the polarity of the previously broken downward pattern lies.

GBPUSD โ€“ H4 chart. Source: xStation AUDUSD The AUDUSD pair remains in an uptrend. Recently, the pair reached a new local high, followed by a rapid correction. Should this correction deepen, the key support level is 0.7121, derived from the lower boundary of the 1:1 pattern. As long as this level holds, the base case scenario remains a continuation of the upward trend.

AUDUSD โ€“ H4 chart. Source: xStation

Currency Hedger No Comments

USD/INR stays near fresh record highs as risk aversion prevails

  • USD/INR appreciates as the US Dollar gains on increased risk aversion amid Middle East concerns.
  • Modiโ€™s BJP won a third term in Assam and captured opposition stronghold West Bengal in a key election.
  • Indiaโ€™s forex reserves fell from $728.5 billion, while equity outflows hit $19 billion in March and April.

USD/INR extends gains for the third successive day, trading around the fresh record high of 95.40, during the Asian hours on Tuesday. Traders will likely observe Indiaโ€™s HSBC Composite and Services Purchasing Managers’ Index (PMI) data to be released on Wednesday.

The USD/INR pair appreciates as the US Dollar (USD) strengthens on safe-haven demand following Iranโ€™s attack on the United Arab Emirates (UAE). CNBC reported Monday that the UAE was targeted by Iranian drones and missiles, while the US said it destroyed Iranian boats in the Strait of Hormuz. US President Donald Trump warned that Iran would be โ€œblown off the face of the earthโ€ if it targets US ships protecting commercial vessels passing through the Strait of Hormuz.

The Indian Rupee (INR) faced challenges as an overnight surge in crude oil prices dampened investor sentiment. Oil prices, however, have since declined as concerns over immediate supply disruptions eased, with the United States (US) Navy taking steps to reopen the crucial Strait after Iran attempted to close it. Maersk, a Danish shipping and logistics company, later confirmed that its Alliance Fairfax, a US-flagged vehicle carrier, exited the strait under US military escort.

Indian Prime Minister Narendra Modiโ€™s Bharatiya Janata Party (BJP) clinched a third straight term in Assam and captured opposition stronghold West Bengal in a key election.

On Monday, HSBC Manufacturing Purchasing Managers’ Index (PMI) in India came in at 54.7 for April, revised down from the preliminary 55.9 but higher than 53.9 in the prior month. Both output and new orders continued to expand, though growth remained subdued relative to levels seen over the past three and a half years.

Foreign institutional investors (FII) turned net buyers of Indian equities on Monday after nine consecutive days of selling, with inflows totaling 28.36 billion rupees ($298 million). Domestic institutional investors (DII) bought local shares worth 47.64 billion rupees, marking their seventh straight session of purchases, per Reuters.

Stock-specific moves linked to earnings are also expected to remain in focus. Nifty 50 constituents Larsen & Toubro, Mahindra and Mahindra, and Hero MotoCorp are scheduled to announce their quarterly results later in the day.

Indiaโ€™s foreign exchange reserves have declined from a peak of $728.5 billion, while equity outflows reached $19 billion across March and April. Nevertheless, the Reserve Bank of India (RBI) has stated that it remains comfortable with reserve levels sufficient to cover 11 months of imports, though recent policy discussions highlight renewed urgency to strengthen buffers amid ongoing capital outflows.

Technical Analysis: USD/INR nears rectangular channel top, all-time highs near 95.50

USD/INR trades around 95.40 at the time of writing on Tuesday. The technical analysis of the daily chart indicates a potential for a bullish emergence as the pair is testing the upper boundary of the rectangular channel.

However, the USD/INR pair retains a bullish near-term bias as price holds above the nine-day and 50-day Exponential Moving Averages (EMAs). The 14-day Relative Strength Index (RSI) at 66.7 points to firm positive momentum edging toward overbought territory, suggesting upside pressure persists while leaving the pair vulnerable to bouts of consolidation if buyers lose traction.

The USD/INR pair is testing the upper boundary of the rectangle, followed by the all-time high of 95.40, which was recorded on May 4. On the downside, the initial support lies at the nine-day EMA of 94.71. A break below the short-term average would lead the pair to test the 50-day EMA at 93.20, followed by the lower rectangle boundary around 92.50 and a seven-week low of 92.14.

(The story was corrected on May 5 at 6:10 GMT to say in the first paragraph to say that the HSBC PMI data will be released on Wednesday, not Tuesday.)

USD/INR: Daily Chart

US Dollar Price Today

The table below shows the percentage change of US Dollar (USD) against listed major currencies today. US Dollar was the strongest against the Australian Dollar.

USDEURGBPJPYCADAUDNZDINR
USD0.04%0.06%0.00%-0.02%0.16%0.10%0.14%
EUR-0.04%0.00%-0.02%-0.03%0.12%0.06%0.25%
GBP-0.06%-0.00%-0.04%-0.08%0.10%0.07%0.09%
JPY0.00%0.02%0.04%-0.01%0.15%0.11%0.30%
CAD0.02%0.03%0.08%0.00%0.16%0.11%0.32%
AUD-0.16%-0.12%-0.10%-0.15%-0.16%-0.04%0.15%
NZD-0.10%-0.06%-0.07%-0.11%-0.11%0.04%-0.01%
INR-0.14%-0.25%-0.09%-0.30%-0.32%-0.15%0.01%

The heat map shows percentage changes of major currencies against each other. The base currency is picked from the left column, while the quote currency is picked from the top row. For example, if you pick the US Dollar from the left column and move along the horizontal line to the Japanese Yen, the percentage change displayed in the box will represent USD (base)/JPY (quote).

Currency Hedger No Comments

EUR/GBP: Political strains and BoE doubts โ€“ Commerzbank

Commerzbankโ€™s Michael Pfister argues that recent strength in the Pound (GBP) is unlikely to last, as ambitious Bank of England (BoE) rate expectations and renewed political risks weigh on the outlook. The bank forecasts EUR/GBP rising towards 0.89 in coming weeks, while GBP/USD is seen gradually appreciating over the longer term, with current Pound levels not expected to be revisited until 2027.

BoE repricing and UK politics threaten Pound

“Of the G10 currencies, the pound is one of only five to have posted a positive performance since the start of the war, alongside the four major commodity exporters. This surprising performance is based on two factors: the Bank of England (BoE) is expected to respond very decisively, and the political risk premium was priced out in early March. However, we doubt the sustainability of these factors, which is why we expect the pound to weaken in the coming months.”

“Instead of anticipating two rate cuts by the end of the year, the market has at times priced in more than three rate hikes. This massive correction naturally gave the pound a strong boost.”

“We doubt that the Bank of England will meet these expectations.”

“The BoE may raise rates once, but the focus is likely to shift back to rate cuts in the second half of the year. If the market moves in this direction as well, the GBP gains driven by ambitious rate expectations will likely be priced out again.”

“Given the ambitious BoE expectations and the ongoing political risks, we believe there is a strong possibility that the pound will come under pressure again in the coming weeks. Although EUR/GBP is now trading close to the 0.86 level again, if the local elections yield a poor result for Labour, the exchange rate is likely to trend towards 0.89.”

“Nevertheless, political risks are unlikely to persist indefinitely, so we expect a recovery to begin in the second half of the year. But the current level is unlikely to be reached again until 2027.”

Currency Hedger No Comments

USD/CAD Price Forecast: Bulls hesitant above 1.3600 as Oil prices counter USD strength

  • USD/CAD stalls a two-day-old recovery move from a nearly two-month trough amid mixed cues.
  • Elevated Oil prices underpin the Loonie, while rising US-Iran tensions benefit the safe-haven USD.
  • The technical setup, too, warrants some caution before positioning for any meaningful upside.

The USD/CAD pair struggles to capitalize on a two-day-old recovery move from the 1.3550 area, or its lowest level since March 10, and oscillates in a range during the Asian session on Tuesday. Spot prices currently trade around the 1.3620 area amid a combination of diverging forces.

The risk of a further escalation of tensions in the Middle East amid the US-Iran standoff over the Strait of Hormuz acts as a tailwind for Crude Oil prices, which is seen underpinning the commodity-linked Loonie. This, along with the lack of follow-through US Dollar (USD) buying, keeps a lid on the USD/CAD pair. However, persistent geopolitical uncertainties and hawkish US Federal Reserve (Fed) expectations favor the USD bulls, backing the case for a further appreciating move for the currency pair.

The USD/CAD pair is holding a mildly bearish near-term bias as it remains capped beneath the 100-period Simple Moving Average (SMA) on the 4-hour chart. The said hurdle at 1.3650 coincides with the 23.6% Fibonacci retracement level of the late March-early May downfall and should act as a pivotal point. Momentum indicators are mixed, with the Relative Strength Index nearing the neutral territory at 51 and the Moving Average Convergence Divergence (MACD) marginally positive.

The technical setup, in turn, hints at fading downside pressure but not yet a clear bullish reversal while the USD/CAD pair trades below the aforementioned confluence hurdle. A sustained strength beyond, however, should pave the way for further gains towards the 38.2% retracement at 1.3710 and the 50.0% level at 1.3758. The momentum could extend further towards the 61.8% level at 1.3806, which is the prevailing supply zone on the topside.

On the downside, the next meaningful support aligns with the recent swing low around 1.3553, where buyers may attempt to rebuild a base should selling pressure resume.

(The technical analysis of this story was written with the help of an AI tool.)

USD/CAD 4-hour chart

Chart Analysis USD/CAD
Currency Hedger No Comments

EUR/USD Price Forecast: Tests 50-day EMA support after slipping below 1.1700

  • EUR/USD tests immediate support at the 50-day EMA near 1.1682.
  • The 14-day Relative Strength Index nears 50 underscores neutral momentum.
  • The immediate barrier lies at the nine-day EMA around 1.1706.

EUR/USD moves little after two days of losses, trading around 1.1690 during the Asian hours on Tuesday. The daily chart technical analysis indicates a potential for a bearish reversal, as the pair is testing the lower boundary of the ascending channel.

However, a neutral near-term stance prevails asย the EUR/USD pairย hovers just above the 50-period Exponential Moving Average (EMA) but is capped by the nine-period EMA. This tight EMA split suggests consolidation rather than a clear trend.

The 14-day Relative Strength Index near 50 reinforces the idea of balanced momentum after the recent recovery.

The EUR/USD pair is testing the immediate support at the 50-day EMA of 1.1682, aligned with the lower ascending channel boundary. A sustained break below the channel would put downward pressure on the pair to navigate the region around the nine-month low of 1.1411, recorded on March 13.

On the upside, the immediate barrier lies at the nine-day EMA of 1.1706. A break above the short-term average would support the pair to the 11-week high of 1.1849, reached on April 17, followed by the upper boundary of the ascending channel around 1.1960. Further advances above the channel would lead the pair to explore the region around 1.2082, the highest since June 2021, reached on January 27.

EUR/USD: Daily Chart

Euro Price Today

The table below shows the percentage change of Euro (EUR) against listed major currencies today. Euro was the strongest against the New Zealand Dollar.

USDEURGBPJPYCADAUDNZDCHF
USD-0.01%0.00%-0.03%-0.04%0.04%0.05%-0.04%
EUR0.01%0.00%-0.02%-0.03%0.04%0.05%-0.01%
GBP-0.01%-0.00%-0.02%-0.05%0.05%0.05%-0.02%
JPY0.03%0.02%0.02%-0.01%0.06%0.08%0.03%
CAD0.04%0.03%0.05%0.01%0.08%0.08%0.02%
AUD-0.04%-0.04%-0.05%-0.06%-0.08%0.02%-0.04%
NZD-0.05%-0.05%-0.05%-0.08%-0.08%-0.02%-0.07%
CHF0.04%0.01%0.02%-0.03%-0.02%0.04%0.07%

The heat map shows percentage changes of major currencies against each other. The base currency is picked from the left column, while the quote currency is picked from the top row. For example, if you pick the Euro from the left column and move along the horizontal line to the US Dollar, the percentage change displayed in the box will represent EUR (base)/USD (quote).

Currency Hedger No Comments

GBP remains on the back foot against firmer USD amid Mideast crisis

  • GBP/USD attracts some sellers for the third straight day as renewed US-Iran tensions benefit the USD.
  • Rising Oil prices fuel inflationary concerns and temper Fed rate cut bets, further underpinning the buck.
  • The BoEโ€™s more hawkish outlook could offer some support to the GBP and help limit losses for the pair.

The GBP/USD pair trades with a negative bias for the third straight day on Tuesday, though it lacks follow-through selling and holds above the 1.3500 psychological mark during the Asian session. Moreover, the mixed fundamental backdrop warrants some caution before positioning for an extension of the recent pullback from the 1.3655-1.3660 area, the highest level since February 16, touched last Friday.

The US Dollar (USD) attracts safe-haven flows amid the US-Iran standoff over the Strait of Hormuz and diminishing odds for a rate cut by the US Federal Reserve (Fed) in 2026. A firmer USD, in turn, is seen as a key factor exerting some pressure on the GBP/USD pair. However, the Bank of England’s (BoE) relatively more hawkish stance acts as a tailwind for theย British Poundย (GBP) and helps limit the downside for spot prices.

In the latest developments, Reuters reported that there was a fire and an explosion on a South Korean-flagged vessel in the strait. US President Donald Trump warned that Iran would be blown off the face of the earth if it attacks American vessels. Meanwhile, Iran attacked the United Arab Emirates (UAE) with a barrage of missiles and drones after the US announced a program called Project Freedom to guide ships stranded in the Gulf.

This raises the risk of a further escalation of tensions in the Middle East and triggers a fresh leg up in Crude Oil prices, fueling inflationary concerns and bets for more hawkish central banks, including the USย Federal Reserveย (Fed). Theย outlookย further underpins the USD and weighs on the GBP/USD pair. Meanwhile, theย BoEย signaled that rate hikes could be appropriate if inflation remains persistent, which should support spot prices.

Traders now look forward to Tuesday’s US economic docket โ€“ featuring the release of US ISM Services PMI, JOLTS Job Openings, andย New Home Salesย data. This, along with speeches from influential FOMC members, might provide some impetus to the buck and the GBP/USD pair. The focus, however, remains glued to the US Nonfarm Payrolls (NFP) report on Friday and geopolitical headlines, which might continue to infuse volatility.