Currency Hedger No Comments

GBP/USD holds above 1.3300 as haven bids lift the US Dollar

  • GBP/USD clings to 1.3300 as haven demand keeps the US Dollar supported.
  • UK Retail Sales slump and BoE caution weigh on Sterling sentiment.
  • Markets now see both the Fed and BoE leaning further hawkish.

Theย British Poundย (GBP) holds firm during the North American session on Friday, clings above the 1.3300 figure, yet seems poised to finish the week with 0.20% losses against the US Dollar (USD).ย Risk aversionย due to an energy shock caused by the Middle East conflict and the haven appeal of the Greenback keep GBP/USD on its way to monthly losses of more than 1%.

Sterling eyes weekly loss as Oil, war worries sour sentiment anew

On Thursday, US President Donald Trump announced a delay in attacks on Iranโ€™s energy facilities for 10 days, until April 6. Initially, the markets cheered the move as Oil prices fell. Nevertheless, WTI reversed the initial drop as traders faded theย news.

Hence, sentiment remains dismal, with Wall Street posting losses and the Greenback poised to finish the week with gains of over 0.45%, according to the US Dollar Index (DXY). The DXY, which tracks the buckโ€™s performance versus six other currencies, is at 99.94, virtually unchanged for the day.

Adding to the sour mood was the fact that theย Islamicย Revolutionary Guard Corps (IRGC) shut off the Strait of Hormuz.

Data from the US showed that American consumers had grown pessimistic about the economy, as the University of Michigan Consumer Sentiment Index dipped from 55.5 to 53.3, below forecasts of 54. Inflation expectations for the next twelve months jumped from 3.4% in February to 3.8%, while for the five years were unchanged at 3.2%.

In the UK, Retail Sales fell in February following January’s strong performance, coming in at -0.4% MoM, a collapse from the previous month’s 2% growth.

Aside from this, Bank of Englandโ€™s Alan Taylor said the bar for hiking interestย ratesย is quite high, revealing that holding rates is preferable until the central bank assesses the impact of Iranโ€™s war on the economy.

Traders expect further tightening by central banks

This week, money markets had priced out the possibility of rate cuts by theย Federal Reserveย and the Bank of England. Instead, they see the Fed raising rates by 5 basis points towards year-end. Theย BoEย is projected to increase rates by 78 basis points, according to Prime Market Terminal data.

Fed interest rate probabilites – Source: Prime Market Terminal

(This story was corrected on March 27 at 16:25 GMT to say that the University of Michigan Consumer Sentiment Index dipped to 53.3, not 53.5, that 5-year inflation expectations remained unchanged at 3.2% and that UK Retail Sales for January came in at 2%, not 1.8%.)

GBP/USD Price Forecast: Technical outlook

Chart Analysis GBP/USD

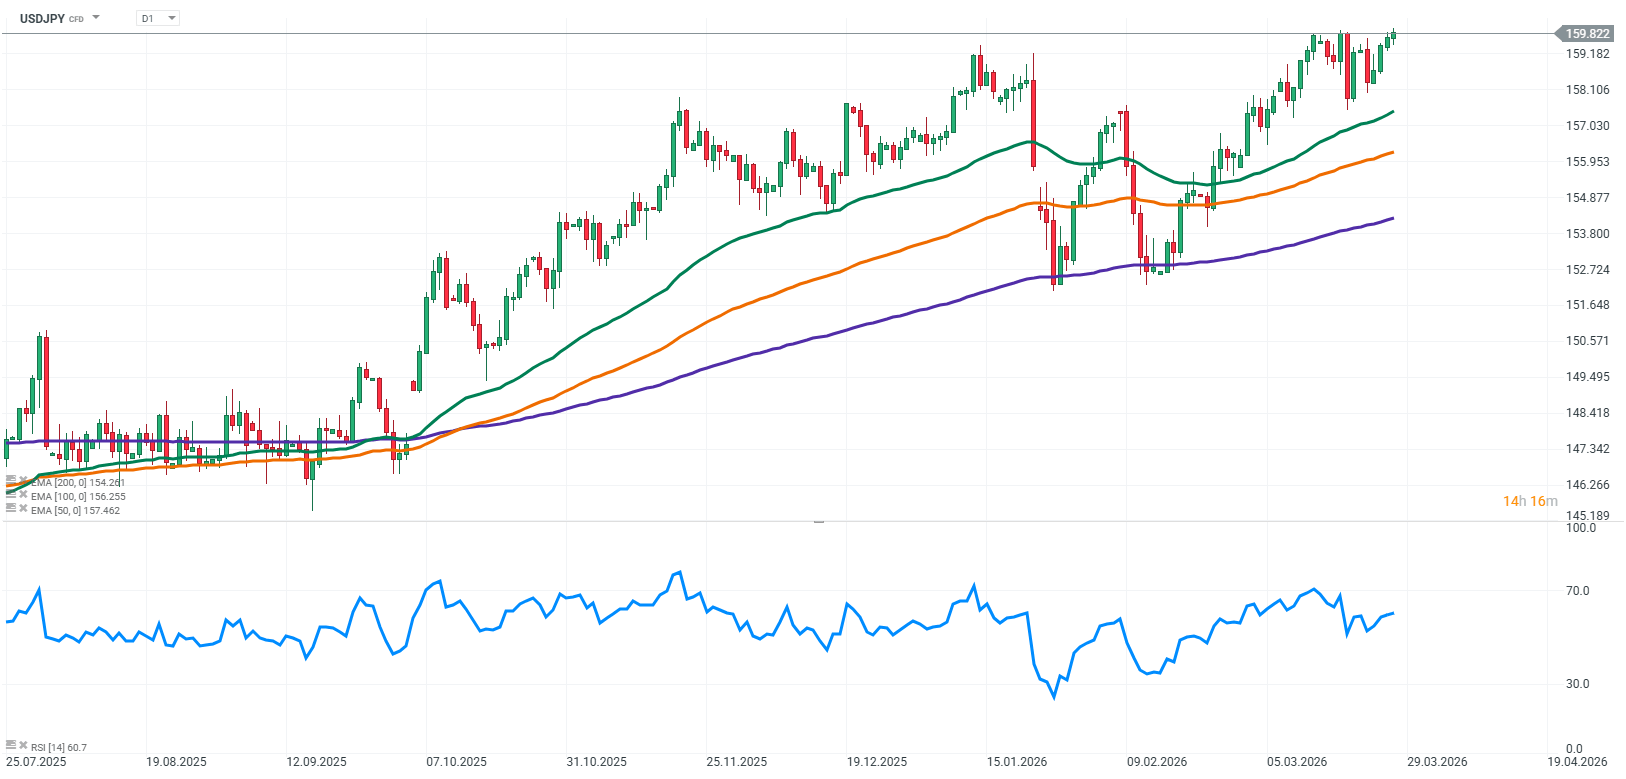
In the daily chart, GBP/USD trades at 1.3311. The near-term bias is mildly bearish as spot holds below the clustered simple moving averages near 1.35 and remains capped by the descending resistance line from 1.3869, which has contained every rebound since the recent 1.38 area highs. Price slipping back inside the broad contracting formation between that downtrend line and the still-rising support line from 1.3035 signals fading upside momentum, while the latest downtick in the Fed Sentiment Index above 119.000 hints that relative policy expectations continue to favor the dollar at the margin.

Immediate resistance stands at the descending trend line currently intersecting just above 1.3400, followed by the 1.3500/1.3520 zone where the daily moving averages converge and prior swing highs cluster. A daily close above that confluence would weaken the bearish bias and expose the 1.3700 region, ahead of the 1.3869 high. On the downside, initial support emerges at 1.3220, the latest swing low, with further traction expected around 1.3100 aligned with the rising trend line from 1.3035. A break beneath that structural floor would confirm a deeper bearish extension toward the psychological 1.3000 handle.

Currency Hedger No Comments

EUR/USD Price Forecast: Resumes downside after failing to hold above 200-day EMA

  • EUR/USD trades marginally lower around 1.1520 as the US Dollar remains firm amid Middle East conflicts.
  • Peace mediators dismiss Trumpโ€™s claim that the 10-day halt to attacks on Iranian energy plants was ordered as per Tehranโ€™s request.
  • ECBโ€™s Lagarde warns of persistent energy supply risks due to significant damage to Gulf energy infrastructure.

The EUR/USD pair trades subduedly around 1.1520 during the European trading session on Friday. The major currency pair faces slight selling pressure as the US Dollar (USD) trades firmly with hopes of a de-escalation in the Middle East war easing, which involves the United States (US), Israel, and Iran.

During the press time, the US Dollar Index (DXY), which tracks the Greenbackโ€™s value against six major currencies, trades 0.1% higher to near 100.00.

Investors turn doubtful over Mideast optimism amid the conflicting statements from peace mediators on US President Donald Trumpโ€™s claim that he ordered a pause on planned military strikes on Iranโ€™s power plans as per Tehranโ€™s request.

According to the Wall Street Journal (WSJ), peace talks mediators dismissed claims that Iran had requested a 10-day pause on strikes on its energy plants.

Onย the Euroย (EUR) front, the major currency is expected to remain under pressure amid fears of persistent energy supply disruption in the wake of damage to Gulf energy infrastructure amid the war.

European Central Bank (ECB) Presidentย Christine Lagardeย said in an interview with the Economistย that the negative energy shock to the world economy from the Mideast war would be larger than current projections, as too much energy infrastructure has been damaged.

EUR/USD technical analysis

EUR/USD trades lower at around 1.1520 as of writing. The pair holds just above the 200-day EMA near 1.1540 while extending a sequence of lower highs below the 20-day EMA around 1.1590, keeping the near-term bias modestly bearish within a broader sideways context.

The 14-day Relative Strength Index (RSI) struggles to hold its recovery move into the 40.00-60.00 zone, signifying heavy selling pressure at higher levels.

Immediate resistance emerges at the 20-day EMA around 1.1590, with a daily close above this barrier needed to ease bearish pressure and open a move toward 1.1690. A stronger recovery would then target the 1.1810/1.1850 area, where prior highs cluster and the recent breakdown began. On the downside, initial support is located at 1.1500, guarding the late pullback low at 1.1415. A decisive break below 1.1415 would confirm a continuation of the downswing and expose the next support zone closer to 1.1350, where longer-term buyers would be expected to re-emerge.

Currency Hedger No Comments

Chart of The Day – USD/JPY

USDJPY remains under strong pressure, trading in the 159.50โ€“159.80 range, close to the psychological barrier of 160.00. Current price movements are driven by a combination of dollar strength, concerns over potential Japanese government intervention, and macroeconomic and geopolitical factors.

Source: xStation5

What shapes USDJPY movements?

Dollar strength and global tensions
USDJPY is supported by the overall strength of the US dollar. Investors view the dollar as a safe-haven amid rising geopolitical tensions in the Middle East and uncertainty in commodity markets. Strong demand for the USD limits the potential for yen appreciation, especially in an environment of global unrest and increased risk aversion.

Risk of intervention by Japanese authorities
Japanese authorities have increasingly signaled their readiness to intervene if USDJPY exceeds the 160.00 level. The purpose of potential intervention is to protect Japanese exports and stabilize the economy. A strong dollar raises import costs and may increase inflationary pressure in Japan. Interventions serve as a tool for authorities to manage excessive currency fluctuations that could negatively impact the trade balance and financial market stability.

Monetary policy
The Bank of Japan continues its ultra-loose policy, maintaining low interest rates over the long term. At the same time, US rates remain elevated, widening the yield differential between the USD and JPY and supporting further dollar strength against the yen. This divergence in monetary policy makes the dollar more attractive to investors in the short and medium term, maintaining upward pressure on USDJPY.

Energy prices and Japanโ€™s trade balance
Japan is heavily reliant on imported oil and gas. Rising energy prices increase import costs, weaken the trade balance, and limit growth potential. Higher commodity prices also add to inflationary pressure, increasing the risk of currency instability. In this context, a strong dollar combined with high commodity prices can further weaken the yen, keeping USD/JPY near record levels.

Conclusion

USDJPY remains sensitive to a combination of dollar strength, intervention signals from Japanese authorities, and external factors such as energy prices and geopolitical tensions. Strong dollar momentum and potential actions by the Japanese government limit the scope for stable gains above 160.00.

The material on this page does not constitute financial advice and does not take into account your level of understanding, investment objectives, financial situation or any other specific needs. All information provided, including opinions, market research, mathematical results and technical analyzes published on the Website or transmitted To you by other means, it is provided for information purposes only and should in no way be construed as an offer or solicitation for a transaction in any financial instrument, nor should the information provided be construed as advice of a legal or financial nature on which any investment decisions you make should be based exclusively To your level of understanding, investment objectives, financial situation, or other specific needs, any decision to act on the information published on the Website or sent to you by other means is entirely at your own risk if you In doubt or unsure about your understanding of a particular product, instrument, service or transaction, you should seek professional or legal advice before trading. Investing in CFDs carries a high level of risk, as they are leveraged products and have small movements Often the market can result in much larger movements in the value of your investment, and this can work against you or in your favor. Please ensure you fully understand the risks involved, taking into account investments objectives and level of experience, before trading and, if necessary, seek independent advice.

Currency Hedger No Comments

Australian Dollar falls to two-month lows on USโ€“Iran peace uncertainty

  • AUD/USD fell to a two-month low of 0.6877 on Friday.
  • Rising oil prices weighed on sentiment amid USโ€“Iran peace uncertainty.
  • Trump said Washington would pause attacks on Iranโ€™s energy sector for 10 days, while Tehran denied any request.

AUD/USD extends its losing streak for the fourth consecutive day, trading around 0.6880 during the Asian hours on Friday. The pair recorded a two-month low of 0.6877, pressured by weakness in the Australian Dollar (AUD) as rising oil prices weigh on sentiment amid uncertainty surrounding United States (US)โ€“Iran peace talks.

US President Donald Trump said earlier that Washington would pause attacks on Iranโ€™s energy sector for 10 days, extending the previous April 6 deadline to allow room for negotiations. Trump suggested the decision followed a request from Iran. However, the Wall Street Journal reported that mediators say Iran denies making such a request, underscoring the fragility of the diplomatic process and the low likelihood of a near-term ceasefire.

Meanwhile, the Pentagon is considering plans to deploy up to 10,000 additional ground troops to the Middle East. Defence officials noted that the option is intended to enhance strategic flexibility, enabling rapid escalation if talks break down while maintaining a credible deterrent in the region.

On the monetary policy front, Reserve Bank of Australia (RBA) Assistant Governor Christopher Kent warned on Thursday that policymakers may need to act to contain inflation as energy prices rise. Kent added that the board remains focused on achieving low, stable inflation and full employment, which could push up short-run neutralย ratesย and necessitate tighter policy.

Federal Reserve (Fed) Governor Stephen Miran said on Thursday that reducing the size of the Fedโ€™s balance sheet would support more effective interest rate policy. Miran outlined a potential path to shrink holdings by $1 trillion to $2 trillion, noting that a smaller balance sheet would give the Fed greater flexibility in future crises, while a larger one risks distorting markets.

US data offered little fresh direction, with Initial Jobless Claims coming in exactly as expected at 210K. Attention now turns to Fridayโ€™s University of Michigan (UoM) consumer sentiment and one-year inflation expectations.

Currency Hedger No Comments

EUR/USD inches up after Trump’s Hormuz deadline extension; remains below mid-1.1500s

  • EUR/USD attracts some buyers during the Asian session amid a modest USD downtick.
  • Trump extends the deadline to reopen the Strait of Hormuz, undermining the buck.
  • Persistent geopolitical uncertainty and hawkish Fed bets could limit the USD downside.

The EUR/USD pairย edges higher during the Asian session on Friday, though it lacks bullish conviction and risks attracting fresh sellers amid a bullish US Dollar (USD). Nevertheless, spot prices, for now, seem to have snapped a three-day losing streak and currently trade around the 1.1535-1.1540 area, up nearly 0.10% for the day.

US President Donald Trump delayed a threatened strike on Iranโ€™s energy infrastructure and extended his deadline for Tehran to reopen the Strait of Hormuz until April 6. This helps ease concerns about a further escalation of tensions in the Middle East and dents the USD’s safe-haven demand, which turns out to be a key factor offering some support to the EUR/USD pair.

Meanwhile, Iran has threatened to retaliate against regional infrastructure, including desalination facilities, if Trump follows through with his threat. Moreover, the deployment of additional US troops has been fueling speculation of a potential ground operation. This keeps geopolitical risks in play and should underpin the USD’s status as the global reserve currency.

Apart from this, hawkish USย Federal Reserveย (Fed) expectations might continue to act as a tailwind for the buck and cap the upside for the EUR/USD pair. Investors remain worried that the war-driven surge in energy prices would revive inflationary pressures and now seem to have fully priced out the possibility of any further interest rate cuts by the Fed this year.

Moreover, traders are rapidly increasing bets for a hike by the end of this year. Theย outlookย remains supportive of elevated US Treasury bond yields and validates the USD bullish bias. This, in turn, warrants some caution for the EUR/USD bulls and makes it prudent to wait for some follow-through buying before positioning for any further intraday appreciating move.

US Dollar Price Today

The table below shows the percentage change of US Dollar (USD) against listed major currencies today. US Dollar was the strongest against the Swiss Franc.

USDEURGBPJPYCADAUDNZDCHF
USD-0.10%-0.08%-0.14%-0.09%-0.07%-0.10%-0.04%
EUR0.10%0.02%-0.06%0.00%0.02%-0.00%0.06%
GBP0.08%-0.02%-0.09%-0.02%0.01%-0.03%0.04%
JPY0.14%0.06%0.09%0.07%0.06%0.04%0.12%
CAD0.09%-0.01%0.02%-0.07%0.00%-0.00%0.05%
AUD0.07%-0.02%-0.01%-0.06%-0.00%-0.02%0.04%
NZD0.10%0.00%0.03%-0.04%0.00%0.02%0.06%
CHF0.04%-0.06%-0.04%-0.12%-0.05%-0.04%-0.06%

The heat map shows percentage changes of major currencies against each other. The base currency is picked from the left column, while the quote currency is picked from the top row. For example, if you pick the US Dollar from the left column and move along the horizontal line to the Japanese Yen, the percentage change displayed in the box will represent USD (base)/JPY (quote).

Currency Hedger No Comments

Canadian Dollar gains as US Dollar weakens on easing risk aversion

  • USD/CAD depreciates as market sentiment improves on the US pausing attacks on Iranโ€™s energy sector.
  • The US Dollar may rebound as inflation fears curb Fed cut bets, boosting hike expectations.
  • The commodity-linked CAD may face challenges amid softer oil prices.

USD/CAD halts its four-day winning streak, trading around 1.3850 during the Asian hours on Friday. The pair weakens as the US Dollar (USD) softens on decreasingย risk aversionย after recent remarks from US President Donald Trump.

Trump said Washington would pause attacks on Iranโ€™s energy sector for 10 days at Tehranโ€™s request, extending the April 6 deadline to allow more time for negotiations. However, the Wall Street Journal reported that mediators said Iran denied making such a request, underscoring fragile diplomacy and low odds of a near-term ceasefire.

The Greenback may regain its ground on rising inflation concerns, prompting traders to scale back expectations of furtherย Federal Reserveย (Fed) rate cuts and increase bets on a potential hike by year-end.

Federal Reserve (Fed) Vice Chair of Supervision Philip Jefferson said higher energy prices should have a modest impact on inflation, though a sustained shock could be more significant. Meanwhile, Fed Governor Michael Barr warned that another price shock could lift inflation expectations, reinforcing the case for the Fed to assess economic conditions before adjusting policy.

The downside inย USD/CADย may be limited as the commodity-linked Canadian Dollar (CAD) could struggle amid softer oil prices. Traders remain cautious as the Pentagon considers deploying up to 10,000 additional ground troops to the Middle East to maintain strategic flexibility and deterrence if talks fail.

Currency Hedger No Comments

GBP/USD Price Forecast: Snaps three-day losing streak as market sentiment improves

  • GBP/USD rises to near 1.3345 as market sentiment turns favorable for riskier assets.
  • US President Trump extended the postponement of scheduled military action on Iranโ€™s power plants.
  • Investors await UK Retail Sales data for February.

The GBP/USD pair snaps its three-day losing streak on Friday, trading 0.1% higher to near 1.3345 during the Asian trading session. The Cable rises as the market sentiment turns favorable for riskier assets, following United States (US) President Donald Trumpโ€™s extended pause on scheduled attacks on Iranian power plants until April 6, which boosts hopes of de-escalation in conflicts in the Middle East.

As of writing, S&P 500 futures trade 0.3% higher to near 6,500, indicating an improvement in investorsโ€™ risk appetite. Meanwhile, the US Dollar Index (DXY), which tracks the Greenbackโ€™s value against six major currencies, trades flat near a three-day high of around 100.00.

Late Thursday, US President Trump said through a post on Truth.Social, โ€œI am pausing the period of Energy Plant destruction by 10 Days to Monday, April 6, 2026, at 8 P.M., Eastern Time,โ€ and expressed confidence that talks with Iran regarding an end to the Middle East war are going well.

In Fridayโ€™s session, investors will focus on the United Kingdom (UK) Retail Sales data for February, which will be published at 07:00 GMT. Month-on-month Retail Sales, a key measure of consumer spending, is estimated to have declined 0.8% after a 1.8% growth seen in January. On an annualized basis, the consumer spending measure is expected to have risen at a moderate pace of 2.1% against the previous reading of 4.5%.

GBP/USD technical analysis

GBP/USD trades higher at around1.3345 as of writing. The near-term bias is bearish as recent lower highs reinforce the downside tone. The spot trades close to the 20-day Exponential Moving Average (EMA), which has flattened after a prior decline and now caps the upside around 1.34.

The 14-day Relative Strength Index (RSI) oscillates in the 40.00-60.00 zone, signaling a pause in the bearish momentum, while the bearish bias remains intact.

Initial resistance emerges at the 20-day EMA near 1.3400, followed by the March 23 high around 1.3480, where recent supply halted rebounds. A daily close above that level would ease the bearish pressure and open the way toward the mid-1.35 region. On the downside, immediate support aligns with Monday’s low at 1.3257, with a break exposing the next bearish target at 1.3220. A drop through 1.3220 would confirm a stronger downward extension toward the 1.31 area.

Currency Hedger No Comments

AUD/USD remains under pressure as geopolitical risks support the US Dollar

  • AUD/USD trades around 0.6920, holding near its lowest level since early February.
  • The US Dollar is supported by safe-haven demand and rising US Treasury yields.
  • Markets largely ignore the RBAโ€™s hawkish tone, reinforcing the bearish outlook.

AUD/USDย trades around 0.6920 on Thursday at the time of writing, down 0.35% on the day, and remains close to its monthly lows amid a bearish consolidation phase. The pair struggles to stage any meaningful rebound as the US Dollar (USD) continues to draw solid support.

Market sentiment remains fragile despite conciliatory remarks from US President Donald Trump, as Iran has rejected any prospect of negotiations and dismissed a ceasefire proposal. Persistent tensions in the Middle East, combined with additional US troop deployments, are fueling fears of further escalation. In this context, the US Dollar benefits from its safe-haven status, weighing on the Australian Dollar (AUD).

At the same time, the energy situation is adding to global inflationary pressures. The effective closure of the Strait of Hormuz is pushing Oil prices higher, reinforcing expectations that major central banks, including theย Federal Reserveย (Fed), will maintain a hawkish stance. This dynamic is driving US Treasury yields higher, further supporting the Greenback.

On the domestic front, comments from Reserve Bank of Australia (RBA) Assistant Governor Christopher Kent failed to provide support to the currency. Although he highlighted inflation risks linked to rising energy prices and stressed the need to maintain restrictive monetary conditions, the market reaction remained muted. This lack of traction reflects growing concerns about the domestic economicย outlook.

According to economists at Commerzbank, Australia is facing a stagflation dilemma, with slowing growth and energy-driven inflation pressures. They note that consumer confidence has dropped sharply while Services Purchasing Managers Index (PMI) indicators have slipped into contraction territory, complicating the central bankโ€™s policy path. Markets still price in around a 54% chance of a rate hike in May, according to the economists.

Over the longer term, Rabobank maintains a more constructive view. The bank argues that Australiaโ€™s status as a net energy exporter could support its terms of trade in the current environment, potentially allowing AUD/USD to return to the 0.71 area over a three- to six-month horizon, and to 0.72 over twelve months.

In the near term, however, the combination of a resilient US Dollar driven by safe-haven flows, elevated US yields, and a lack of supportive domestic catalysts suggests that the bearish bias for the pair is likely to persist.

Australian Dollar Price Today

The table below shows the percentage change of Australian Dollar (AUD) against listed major currencies today. Australian Dollar was the strongest against the New Zealand Dollar.

USDEURGBPJPYCADAUDNZDCHF
USD0.08%-0.03%0.05%0.12%0.31%0.27%0.13%
EUR-0.08%-0.11%-0.06%0.03%0.23%0.19%0.05%
GBP0.03%0.11%0.09%0.16%0.34%0.30%0.16%
JPY-0.05%0.06%-0.09%0.07%0.26%0.21%0.08%
CAD-0.12%-0.03%-0.16%-0.07%0.20%0.15%0.01%
AUD-0.31%-0.23%-0.34%-0.26%-0.20%-0.04%-0.15%
NZD-0.27%-0.19%-0.30%-0.21%-0.15%0.04%-0.14%
CHF-0.13%-0.05%-0.16%-0.08%-0.01%0.15%0.14%

The heat map shows percentage changes of major currencies against each other. The base currency is picked from the left column, while the quote currency is picked from the top row. For example, if you pick the Australian Dollar from the left column and move along the horizontal line to the US Dollar, the percentage change displayed in the box will represent AUD (base)/USD (quote).